R E S E A R C H
Open Access
Complementary analysis of Mueller-matrix
images of optically anisotropic highly
scattering biological tissues
Mariia Borovkova
1,5*, Motahareh Peyvasteh
1, Olexander Dubolazov
2, Yurii Ushenko
2, Volodymyr Ushenko
2,
Alexander Bykov
1, Stanislas Deby
3, Jean Rehbinder
3, Tatiana Novikova
3and Igor Meglinski
1,4,5,6*Abstract
Background:Using optical techniques for tissue diagnostics (so-called‘optical biopsy’) has been a subject of extensive research for many years. Various groups have been exploring different spectral and/or imaging modalities (e.g. diffuse reflectance spectroscopy, autofluorescence, Raman spectroscopy, optical coherence tomography (OCT), polarized light microscopy, etc.) for biomedical applications. In this paper, we report on using multi-wavelength imaging Mueller polarimetry combined with an appropriated image post-processing for the detection of tissue malignancy.
Methods:We investigate a possibility of complementary analysis of Mueller matrix images obtained for turbid tissue-like scattering phantoms and excised human normal and cancerous colorectal tissue samples embedded in paraffin. Combined application of correlation, fractal and statistical analysis was employed to assess quantitatively the polarization-inhomogeneous scattered fields observed at the surface of tissue samples.
Results:The combined analysis of the polarimetric images of paraffin-embedded tissue blocks has proved to be an efficient tool for the unambiguous detection of tissue malignant transformation. A fractal structure was clearly observed at spatial distributions of depolarization of light scattered in healthy tissues in a visible range of spectrum, while corresponding distributions for cancerous tissues did not show such dependence. We demonstrate that paraffin does not destroy a fractal structure of spatial distribution of depolarization. Thus, the loss of fractality in spatial distributions of depolarization for cancerous tissue is related to the structural changes in the tissue sample induced by cancer itself and, therefore, may serve as a marker of the disease.
Conclusion:The obtained results emphasize that a combined use of statistical, correlation and fractal analysis for the Mueller-matrix image post-processing is an effective approach for an assessment of variations of optical properties in turbid tissue-like scattering media and biological tissues, with a high potential to be transferred to clinical practice for screening cancerous tissue samples.
Keywords:Statistical, Correlation and fractal image analysis, Polarimetry, Mueller matrix, Optical anisotropy, Multiple scattering
* Correspondence:[email protected];[email protected]
1Optoelectronics and Measurement Techniques Laboratory, University of
Oulu, P.O. Box 4500, 90014 Oulu, Finland
Full list of author information is available at the end of the article
Background
Mueller polarimetry is the cutting edge optical technique widely used in various applications, associated with the studies of heterogeneous complex structures, including composite anisotropic materials, polymers, biological tis-sues, etc. [1–5]. This technique analyzes the changes of polarization states of incident light reflected/transmitted/ scattered by a sample. In particular, a polarized light, which propagates through biological tissue, may change its state of polarization due to optical anisotropy of tissue and even become partially or fully depolarized because of scattering within a tissue. Typically, phase anisotropy (linear and cular birefringence), amplitude anisotropy (linear and cir-cular dichroism) and scattering properties of tissues (depolarization power) are altered by structural and/or biochemical tissue malformation changes, e.g. due to inflammation, tumor growth, etc. Therefore, the phys-ical parameters, which quantitatively define these changes, are considered as valuable markers for the diagnostic purpose [6–12].
The real 4 × 4 Mueller matrix contains complete infor-mation about polarization and depolarization properties of the scattering medium [13]. In fact, the straightfor-ward interpretation of matrix elements in term of optical properties suitable for quantitative characterization of studied medium can be performed for very limited class of samples (e.g. homogenous isotropic scattering media). Probing a multi-component highly heterogeneous struc-ture of real biological tissue with polarized light pro-duces very complex optical response due to the anisotropic scattering that lead to non-linear depend-ence of the elements of measured Mueller matrix on tis-sue optical properties [14]. A phenomenological approach is used for a decomposition of measured Mueller matrix into the set of Mueller matrices de-scribing the basic optical properties, such as dichro-ism, retardation and depolarization. Well-developed Mueller matrix algebra describes the numerous types of decompositions algorithms, including sum, product serial-parallel ones and others [15–21]. The selection of a particular decomposition algorithm depends on the specific application. In present study of tissue phantoms and real tissues specimens we applied Lu-Chipman polar decomposition approach [18] and then complementary applied statistical, correlation and fractal analysis utilizing images of depolarization parameter Δ.
Most of modern polarimetric imaging systems [7–11] present the measured Mueller matrix data in form of two-dimensional (m×n) distributions of matrix ele-ments, known also as Mueller matrix images (MMI) and denoted here asq(m×n).
For the quantitative evaluation of two-dimensional dis-tributions q(m×n) the statistical moments of the first
(Z1), second (Z2), third (Z3), and fourth (Z4) orders are used [22]:
Z1¼ 1
N
XN
j¼1qj
Z2¼
ffiffiffiffiffiffiffiffiffiffiffiffiffiffiffiffiffiffiffiffiffiffiffiffiffiffiffiffiffiffiffiffiffiffiffiffiffiffiffiffiffiffiffi
1
N−1
XN
j¼1 qj−Z1
2
r
Z3¼ 1
Z32 1
N
XN
j¼1 qj−Z1
3
Z4¼ 1
Z42 1
N
XN
j¼1 qj−Z1
4
ð1Þ
where N=m×n is the number of pixels in the light-sensitive zone of digital cameras.
The conventional autocorrelation approach [22] imple-mented for the assessment of spatial homogeneity by calculating the autocorrelation functions of eachnthline of the image is used:
Knð Þ ¼Δx lim x→0
1
m Z x
0 q
ðx¼1mÞ
½ ½qðx−ΔxÞdx ð2Þ
The notation Δx stands for the‘pitch’ of the coordin-ate (x) variation in the distribution qðxÞ ¼qðxÞ−q , whereqis the mean value, which is defined over the en-tire line.
The autocorrelation function is defined by summing partial dependencies:
Kð Þ ¼Δx P
Knð ÞΔx
n : ð3Þ
For the quantitative assessment of the relationships (3), the statistical moments of the second (K2) and forth (K4) orders, which characterize the FWHM and the sharpness of the autocorrelation function K(Δx) peak, respectively, were calculated.
The assessment of scale self-similarity of distributions
q(m×n) is based on the fractal analysis, which includes the following steps [22]:
(i) Calculation of power spectraJ(q) using a discrete
Fourier transform of the corresponding autocorrelation function;
(ii) Determination of the log-log dependence of logJ(q)
−log(ν), whereν=l−1is the spatial frequency, andl
is the size of the structural element inq(m×n);
(iii) Dependencies logJ(q)−log(ν) are approximated by
the least square fit with curves V(η) The straight
segments of these curves serve to determine the
slope anglesηand calculate fractal dimensions.
V(η) curves, the distributions q(m×n) become multi-fractal. If there are no stable constant values of slope angle η within the whole range of sizes l, the distribu-tionsq(m×n) are believed to be random.
For the quantitative assessment of the logarithmic de-pendencies logJ(q)−log(ν) a second-order statistical mo-ment was proposed in [22].
Df ¼
ffiffiffiffiffiffiffiffiffiffiffiffiffiffiffiffiffiffiffiffiffiffiffiffiffiffiffiffiffiffiffiffiffiffiffiffiffiffiffiffiffiffiffiffiffiffiffiffiffiffiffiffiffiffiffiffiffiffi
1
N
XN
j¼1 logJ qð Þ−logð Þν 2
j
r
ð4Þ
In current paper, we demonstrate new opportunities for differentiation of depolarizing samples by using com-bined application of statistical, correlational and fractal analysis of the image of depolarization parameterΔ.
Methods
Tissue phantoms and paraffin-embedded blocks of excised normal and cancerous colorectal tissues in vitro have been used in the experiments. The tissue phantoms contain rutile (TiO2) particles (mean size 0.53μm, standard devi-ation 0.01 μm, confirmed by electron microscopy mea-surements), embedded in 1 mm thick PVC-based host matrix (2 cm × 2 cm), with different concentrations: 1.5, 3.0, and 6.0 mg/ml. The concentration values were se-lected to assure the scattering coefficientsμsof the phan-toms vary providing change from single scattering regime (optically thin layer) to multiple scattering regime (optic-ally thick layer). From spectrophotometric measurements the intrinsic absorption coefficient was found to be negli-gible, therefore, all three tissue phantoms were considered as pure scattering ones. The details on phantom fabrica-tion and characterizafabrica-tion are described in [23].
The paraffin-embedded blocks of excised colorectal human tissue were prepared according to standard protocol utilized for the pathology analysis. First, the tis-sue specimens were fixed in formalin for several hours, then they were dehydrated by immersion in alcohol, cleared by organic solvent to remove alcohol and finally were infiltrated with paraffin wax. When molten paraffin solidified, it provided a support matrix for tissue. Then thin sectioning of two selected blocks was performed. A conventional histological analysis of stained tissue sec-tions by pathologist did not find malignancy on the histological cut from the first block and confirmed the presence of malignancy in tissue from the second block.
The experimental measurements with phantoms were performed in the transmission mode with Mueller polari-metric microscope, whereas the measurements with the thick tissue blocks were performed in reflection mode by using multi-wavelength imaging Mueller-matrix polar-imeter. The detailed description and specifications of the experimental system used in current study are presented in [19, 24], and omitted here for brevity. We applied
Lu-Chipman decomposition of experimental Mueller matrices. Neither significant diatteniation nor retardance were found for any class of studied samples. The depolarization (Δ) maps were used for further analysis.
The set of chosen samples provides the possibility of conducting a comparative analysis of the dependencies of statistical (Eq. (1)), correlational (see Eqs. (2-3)) and fractal parameters (Eq. (4)). These parameters characterize the spatial distribution of depolarization parameter Δ values in terms of different scattering multiplicities of the model samples with controlled parameters (“phantoms”) and samples of real partially-depolarizing tissues with various pathological conditions.
Results and discussion
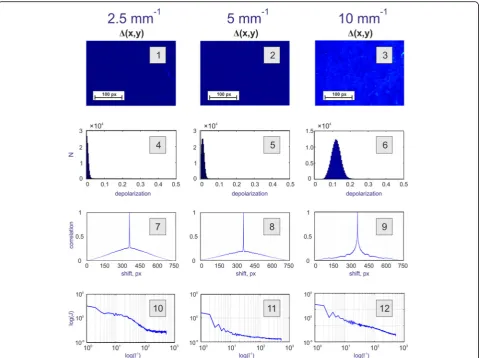
The Fig.1demonstrates the maps of depolarization par-ameterΔ(see Figs.1, 1.1–1.3), the histogramsN(Δ) (see Figs. 1, 1.4–1.6), the autocorrelation functions KΔ(Δx) (see Figs. 1, 1.7–1.9) and the logarithmic dependencies of power spectra logJ(Δ)−logl−1(see Figs. 1, 1.10–1.12) of the distributions Δ(m×n) (320 × 240 = 76,800 pixels) for the set of tissue phantoms with scattering coefficients
μs=2.5 mm− 1
(see Figs.1, 1.1, 1.4, 1.7, 1.10);μs=5 mm− 1
(see Figs.1, 1.2, 1.5, 1.8, 1.11);μs=10 mm−1(see Figs.1, 1.3, 1.6, 1.9, 1.12). The measurements were performed with low-coherence light at wavelengthλ = 0.55 μm fil-tered from a white light LED source [19].
The analysis of depolarizing properties of tissue phan-toms 1–3 in the frameworks of the statistical, correlation and fractal approaches reveals that with the increase in number of scattering events along the light propagation path (i.e. increase of scattering coefficient from 2.5 mm−1 to 10 mm−1) the maximum of the distribution shifts to lar-ger value of depolarization (see Figs.1, 1.4–1.6). The disper-sion of Δvalues distribution increases monotonically with the increase of mean value of depolarization (see Figs. 1, 1.4–1.6). This fact correlates well with the measurements of the degree of depolarization, averaged over an emerging beam area [19]. On the other hand, the different phantom samples are characterized by the “individual” half-width, asymmetry and sharpness of the peak of distributionN(Δ).
correlation analysis of the depolarization map of the par-tially depolarizing sample 3. Two-dimensional distribution of depolarization parameterΔfor this sample is character-ized by a larger range of values. As a result, the autocor-relation function KΔ(Δx) shows smooth decreasing dependency (see Fig.1, 1.9) [22].
Scale self-similar structure of the depolarization maps of phantom samples 1–3 essentially depends on the scat-tering multiplicity. Therefore, for the samples 1 and 2 the logarithmic dependencies logJ(Δ)−logl−1 do not have a constant slope angle η of the approximating curvesV(η) in the entire range of the structural elements dimensions l of the depolarization maps (see Figs. 1, 1.10, 1.11). Distribution Δ(m×n) for the sample 3 is multi-fractal (two values of η) (see Fig. 1, 1.12). Thus, the increase of scattering multiplicity leads to almost equiprobable contribution of the different-scale struc-tural elements of the phantom samples to the polarization structure of the optical object field forma-tion. Along with this, the raise of the depolarization par-ameter value is accompanied by an increase of the
values for low (~10 μm) and medium (~100μm) sizes l
of structural elements in the dependencies logJ(Δ)−logl−1. Apparently, this regularity is conditioned by the growth of the high-frequency component in the distributionΔ(m×n) due to the increasing scattering multiplicity of optically-thick phantom sample (scattering coefficient of 10 mm−1). The results of the statistical, correlational and fractal analysis ofΔ(m×n) for the wavelength 0.55μm are shown in the Table1.
Analysis of the obtained results revealed that the fol-lowing parameters are the most sensitive to the increase of scattering multiplicity within the volume of phantom samples with the scattering coefficient varying from 2.5 mm−1to 10 mm−1:
– the dispersion of distributionΔ(m×n) (increases up
to 24 times);
– the 4th order statistical moment, which
characterizes the sharpness of the peak
of distribution of depolarization parameterΔvalues
(decreases 20 times).
– the 4th order correlation moment, which characterizes the sharpness of the peak of autocorrelation function
KΔ(Δx) (theK4value decreases 16 times);
– the 2nd order correlation moment, which characterizes
the half-width of autocorrelation functionKΔ(Δx) (the
K2value increases by almost 4 times).
– dispersionDfof logarithmic dependencies logJ(Δ)−
logl−1increases by almost 7 times.
We found following behavior of the parameters with the increase of the scattering coefficient from 2.5 mm−1 to 10 mm−1:
Z1↑;Z2↑;Z3↓;Z4↓;
K2↑;K4↓;
Df↑:
Thus, a high sensitivity of the set of statistical (Zi), cor-relational (Kj), and fractal (Df) parameters to the changes
of two-dimensional distributions of depolarization de-greeΔof structurally similar samples with different scat-tering coefficients was identified. These findings open the perspectives for the quantitative characterization of partially depolarizing optically anisotropic biological tis-sues, which are much more complex samples compared to optically isotropic tissue phantoms.
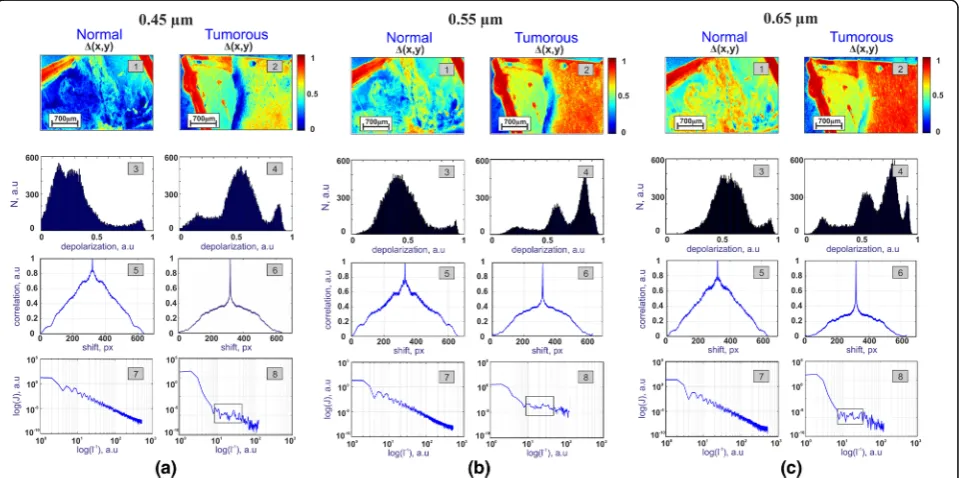
In a similar manner Fig. 2 presents the spatial depolarization distribution Δ (panels 1, 2), the histo-grams N(Δ) (panels 3, 4), the autocorrelation functions
KΔ(Δx) (panels 5, 6), and presented in logarithmic scale power spectra logJ(Δ)−logl−1 (panels 7, 8) ob-tained for normal (panels 1, 3, 5, 7) and cancerous (panels 2, 4, 6, 8) paraffin-embedded tissue blocks, mea-sured in the reflection mode at the selected wavelengths: λ1= 450 nm (Fig. 2a), λ2 = 550 nm (Fig. 2b), and λ3= 650 nm (Fig.2c).
The peaks of spatial distributions of depolarization parameter Δ for the samples of paraffin-embedded tis-sue blocks are localized within the range 0.25≤Δ≤0.85 (see Fig.2a-c, panels 3, 4). The comparison of distribu-tions of depolarization Δfor the phantom samples (see Figs. 1, 1.4–1.6) and biological tissue reveals that latter distributions are multi-modal with several peaks. With the increase of wavelength the peaks of histograms of depolarization parameter Δ are shifted to larger values for both healthy and cancerous samples of paraffin-embedded tissue blocks (see Fig. 2a-c), panels 3, 4). Besides, the range of Δ values expands. This fact Table 1Statistic (Zi), correlation (Kj), and fractal (Df) parameters
used for characterization of depolarization distributiosΔ(m×n) of three phantom samples
Z1 Z2 Z3 Z4 K2 K4 Df
sample 1 0.015 0.005 0.41 3.09 0.094 6.87 0.025
sample 2 0.017 0.009 0.32 3.09 0.22 2.31 0.052
sample 3 0.15 0.12 0.19 0.14 0.35 0.42 0.17
Fig. 2Examples of depolarization distributionΔ- (1, 2), N (Δ) histograms–(3, 4), autocorrelation functions KΔ(Δx)–(5, 6) and power
spectra (logJ(Δ) - logl−1)–(7, 8) obtained for normal and cancerous paraffin-embedded tissue blocks, measured in the reflection mode
indicates the ‘longwave’ increase of depolarization of the radiation rearranged by the biological samples. We attribute this fact to deeper penetration of longer wavelengths into the tissue. Increased optical path re-sults in larger number of scattering events, which randomize the polarization of incident light. Further-more, the depolarization parameter Δ of cancerous paraffin-embedded tissues is higher than that of the normal tissue sample. It is worth to mention that an opposite trend on depolarization was observed in the experiments with fresh thick tissue specimens (colon, uterine cervix) [8, 24] when epithelial surface of tis-sue was imaged. In the above-mentioned measure-ment configuration [8, 24] an imaging plane was orthogonal to the plane of tissue histological cuts seen and analyzed by pathologist.
As one can see, spatial depolarization distributions
Δ(m×n) for the paraffin-embedded tissue blocks have complex coordinate-heterogeneous topographic struc-ture (see Fig.2a-c, panels 1, 2) compared to the similar maps obtained for the tissue phantoms (see Figs. 1, 1.1–1.3). Obviously, this difference is related to the morphological structure of biological tissue. Quantita-tively, the topographic heterogeneity in the spatial dis-tribution of depolarization Δ(m×n) is illustrated by the trend of autocorrelation functionsKΔ(Δx) achieved for healthy and cancerous paraffin-embedded tissue blocks (see Fig.2a-c, panels 5, 6), which have a larger half-width K2↑ and less sharp peak K4↓ compared to the phantom samples due to a larger range of values of the depolarization parameterΔ(see Tables1and2).
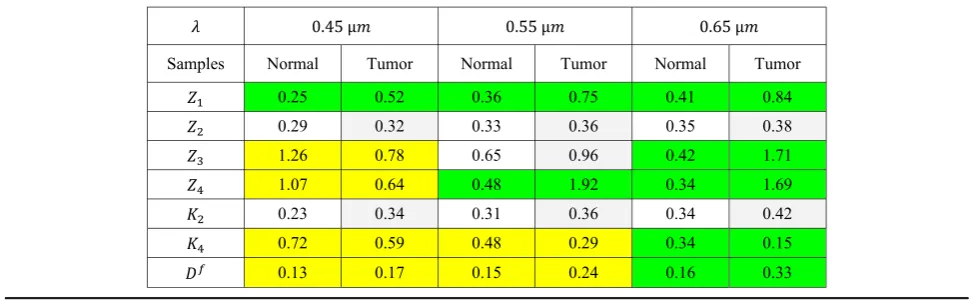
The analysis of data presented in Table2 revealed the most sensitive parameters for the differentiation of nor-mal and cancerous tissue:
1st group (non-colored boxes): the difference between the parameter values for cancerous and non-cancerous tissues does not exceed 25–45 percent;
2nd group (highlighted in yellow): the difference tween the corresponding values of parameters varies be-tween 50 and 100 percent;
3rdgroup (highlighted in green): the difference between the corresponding values of parameters is two to five-fold.
Spectral analysis shows that with the increase of probe beam wavelength, coordinate uniformity of the distribu-tionsΔ(m×n) grows for both healthy and cancerous sam-ples due to the depolarization enhancement. From the quantitative point of view, this trend is illustrated by the in-crease of the FWHM and dein-crease of the peak sharpness of the dependencies KΔ(Δx) (see Fig.2a-c, panels 5, 6). As it can be seen from Table 2, along with the wavelength in-crease (λ↑) the parameter K2increases and the parameter
K4decreases.
Comparative analysis of the logarithmic dependen-cies logJ(Δ)−logl−1 calculated for the distributions of depolarizationΔ(m×n) of biological samples, reveals sig-nificant differences for normal and cancerous tissues. It has been shown, that the distributions of depolarization
Δ(m×n) for normal tissue are fractal in all spectral range (see Fig.2a-c, panels (7)). For cancerous sample, the distri-butions of depolarizationΔ(m×n) are random in the re-gion of medium sizes (~100μm−300μm) (see Fig.2a-c, panels (8), rectangular boxes). The discovered pattern is in a good correlation with the data obtained by Mueller-matrix mapping of optically-thin histological cuts of different organ tissues (prostate, cervix and uterine wall) [22] where the‘oncological destruction’ of fractality of two-dimensional structure of depolarization maps is as-sociated with the formation of new fibrillar networks.
Conclusions
The combined application of statistical, correlation and fractal analysis for the quantitative assessment of polarization-inhomogeneous scattered fields observed at the surfaces of isotropic scattering tissue phantoms and
Table 2Statistical (Zi), correlation (Kj) and fractal (Df) parameters introduced for quantitative assessment of depolarizationΔ(m×
biological tissue samples has been performed in these ini-tial exploratory studies. It has been shown that using the results of the analysis of paraffin-embedded tissue blocks one can unambiguously detect the malignant transform-ation of tissue. The distributions of depolariztransform-ationΔ(m×
n) for healthy tissue are fractal at all studied wavelengths, while corresponding distributions for cancerous tissue loose fractality for medium size features (few hundreds of microns). Adding paraffin to tissue alters its optical prop-erties and increase scattering [25]. Our experiments with isotropic scattering phantoms have proved that simple in-crease in scattering (from single scattering regime to mul-tiple scattering regime) does not destroy the fractality of distributions of Δ(m×n). It suggests that possible differ-ence in paraffin intake by healthy and cancerous tissue can not be the reason for the observed loss of fractal prop-erties of two-dimensional distributions of depolarization
Δ(m×n) for cancerous tissue. The most plausible explan-ation of this effect is related to the structural changes of tissue induced by cancer development.
The obtained results suggest that Mueller-matrix po-larimetry can be an effective approach for screening op-tical anisotropy variations in tissue-like highly scattering media, with a high potential in clinical application for diagnosis of cancerous tissues. Using the thick blocks of excised tissue for the preliminary optical analysis by pathologist may considerably reduce the time and cost of diagnostics. To capitalize on our initial findings the measurements and statistical, correlation and fractal analysis of larger number of paraffin-embedded tissue samples will be undertaken in a future work.
Abbreviations
FWHM:Full width at half maximum; MMI: Mueller-matrix images
Acknowledgements
The authors express their gratitude to Dr. E. Garcia-Caurel, N. Agarwal and J. Yoon for helping with polarimetric measurements of tissue phantoms.
Funding
Authors acknowledge financial support of the international program of Ecole polytechnique“Campagne de chercheurs invités 2015-2016, 2016-2017”, and Academy of Finland (grant projects: 314369 and 290596). MB and MP would like to express sincere thanks to I4Future (Imaging for the Future) doctoral programme, and acknowledge funding from the European Union’s Horizon 2020 research and innovation programme under the Marie Sklodowska-Curie grant agreement No.713606. IM acknowledges partial support provided by Government of Russian Federation (grant 074-U01), MEPhI Academic Excellence Project (Contract No. 02.a03.21.0005), and National Research Tomsk State University Academic D.I. Mendeleev Fund Program.
Availability of data and materials
Data sharing is not applicable to this article as no datasets were generated or analyzed during the current study.
Authors’contributions
Manuscript preparation, reviewing drafts of the paper: MB, MP, OD, IM, SD, JR, TN. Conceptualization: OD, YU, TN, IM. Measurements, data processing AB, SD, JR. Data curation, figures preparation: AB, OD, VU. Formal analysis: OD, AB, YU, VU. Funding acquisition: AB, YU, IM, TN. Investigation: OD, AB, IM, YU,
TN. Methodology: OD, YU, VU, AB. Project administration: YU, TN, IM. All authors read and approved the final manuscript.
Competing interests
The authors declare that they have no competing interests.
Publisher’s Note
Springer Nature remains neutral with regard to jurisdictional claims in published maps and institutional affiliations.
Author details
1
Optoelectronics and Measurement Techniques Laboratory, University of Oulu, P.O. Box 4500, 90014 Oulu, Finland.2Yuriy Fedkovych Chernivtsi
National University, 2 Kotsubinsky Str, Chernivtsi 58012, Ukraine.3LPICM,
CNRS, Ecole polytechnique, University Paris-Saclay, 91128 Palaiseau, France.
4
National Research Tomsk State University, Interdisciplinary Laboratory of Biophotonics, Tomsk 634050, Russia.5Department of Photonics and Optical
Information Technology, ITMO University, Kronverkskiy Prospect 49, St Petersburg 197101, Russia.6Institute of Engineering Physics for Biomedicine
(PhysBio), National Research Nuclear University“MEPhI”, Moscow 115409, Russia.
Received: 24 October 2017 Accepted: 4 June 2018
References
1. Luo, D.A., Barraza, E.T., Kudenov, M.W. Mueller matrix polarimetry on plasma sprayed thermal barrier coatings for porosity measurement. Appl. Opt. 56(35), 9770 (2017).https://doi.org/10.1364/AO.56.009770
2. Novikova, T., Bulkin, P., Popov, V., Haj Ibrahim, B., De Martino, A. Mueller polarimetry as a tool for detecting asymmetry in diffraction grating profiles. J. Vac. Sci. Tech. B.29(5), 051804 (2011).https://doi.org/10.1116/1.3633693
3. Ortega-Quijano, N., Fanjul-Vélez, F., Arce-Diego, J.L.: Polarimetric study of birefringent turbid media with three-dimensional optic axis orientation. Biomed Opt Express.5(1), 287 (2014).https://doi.org/10.1364/BOE.5.000287
4. Dubreuil, M., Delrot, P., Leonard, I., Alfalou, A., Brosseau, C., Dogariu, A.: Exploring underwater target detection by imaging polarimetry and correlation techniques. Appl. Opt.52(5), 997 (2013).https://doi.org/10.1364/ AO.52.00099
5. Manhas, S., Swami, M.K., Buddhiwant, P., Ghosh, N., Gupta, P.K., Singh, K.: Mueller matrix approach for determination of optical rotation in chiral turbid media in backscattering geometry. Opt. Express.14(1), 190–202 (2006).https://doi.org/10.1117/12.697294.
6. Angelsky, O.V., Tomka, Y.Y., Ushenko, A.G., Ushenko, Y.G., Ushenko, Y.A.: Investigation of 2D Mueller matrix structure of biological tissues for pre-clinical diagnostics of their pathological states. J. Phys. D. Appl. Phys.38, 4227 (2005).https://doi.org/10.1088/0022-3727/38/23/014
7. Novikova, T.: Optical techniques for cervical neoplasia detection. Beilstein J. Nanotechnol.8, 1844 (2017).https://doi.org/10.3762/bjnano.8.186
8. Pierangelo, A., Manhas, S., Benali, A., Fallet, C., Totobenazara, J.L., Antonelli, M.R., Novikova, T., Gayet, B., De Martino, A., Validire, P.: Multispectral Mueller polarimetric imaging detecting residual cancer and cancer regression after neoadjuvant treatment for colorectal carcinomas. J. Biomed. Opt.18(4), 046014 (2013).https://doi.org/10.1117/1.JBO.18.4.046014
9. Chue-Sang, J., Bai, Y., Stoff, S., Gonzalez, M., Holness, N., Gomes, J., Jung, R., Gandjbakhche, A., Chernomordik, V.V., Ramella-Roman, J.C.: Use of Mueller matrix polarimetry and optical coherence tomography in the
characterization of cervical collagen anisotropy. J. Biomed. Opt.22(8), 086010 (2017).https://doi.org/10.1117/1.JBO.22.8.086010
10. Vizet, J., Rehbinder, J., Deby, S., Roussel, S., Nazac, A., Soufan, R., Genestie, C., Haie-Meder, C., Fernandez, H., Moreau, F., Pierangelo, A.: In vivo imaging of uterine cervix with a Mueller polarimetric colposcope. Sci. Rep.7(1), 2471 (2017).https://doi.org/10.1038/s41598-017-02645-9.
11. He, C., He, H., Chang, J., Dong, Y., Liu, S., Zeng, N., He, Y., Ma, H.: Characterizing microstructures of cancerous tissues using multispectral transformed Mueller matrix polarization parameters. Biomed. Opt. Express.6, 2934 (2015).https://doi.org/10.1364/BOE.6.002934
13. Gil, J.J., Ossikovski, R. Polarized Light and the Mueller Matrix Approach. CRC Press, Series in Optics and Optoelectronics, Boca Raton (2016).
14. Ghosh, N., Vitkin, A.: Tissue polarimetry: concepts, challenges, applications, and outlook. J. Biomed. Opt.16, 110801 (2011).https://doi.org/10.1117/1. 3652896
15. Savenkov, S.N., Marienko, V.V., Oberemok, E.A., Sydoruk, O.I. Generalized matrix equivalence theorem for polarization theory. Phys. Rev. E.056607, 74 (2006).https://doi.org/10.1103/PhysRevE.74.056607
16. Gil, J.J.: Review on Mueller matrix algebra for the analysis of polarimetric measurements. J. Appl. Remote Sensing.8(1), 081599 (2014).https://doi.org/ 10.1117/1.JRS.8.081599
17. Gil, J.J., San José, I., Ossikovski, R. Serial–parallel decompositions of Mueller matrices. J. Opt. Soc. Am. A.30(1), 32 (2013).https://doi.org/10.1364/JOSAA. 30.000032
18. Lu, S.Y., Chipman, R.A.: Interpetation of Mueller matrices based on polar decomposition. J. Opt. Soc. Am. A.13, 1106–1113 (1996).https://doi.org/10. 1364/JOSAA.13.001106
19. Agarwal, N., Yoon, J., Garcia-Caurel, E., Novikova, T., Vanel, J.C., Pierangelo, A., Bykov, A., Popov, A., Meglinski, I., Ossikovski, R.: Spatial evolution of depolarization in homogeneous turbid media within the differential Mueller matrix formalism. Opt. Lett.40(23), 5634 (2015).https://doi.org/10.1364/OL. 40.005634
20. Ossikovski, R., Arteaga, O.: Statistical meaning of the differential Mueller matrix of depolarizing homogeneous media. Opt. Lett.39(15), 4470–4473 (2014).https://doi.org/10.1364/OL.39.004470
21. Cloude, S.R.: Group theory and polarization algebra. Optik.75, 26 (1986) 22. Angelsky, O.V., Ushenko, A.G., Ushenko, Y.A., Pishak, V.P., Peresunko, A.P.: Statistical, correlation, and topological approaches in diagnostics of the structure and physiological state of birefringent biological tissues. In: Tuchin, V.V. (ed.) Handbook of Photonics for Biomedical Science, pp. 283–322. CRC Press, London (2010)
23. Wróbel, M.S., Popov, A.P., Bykov, A.V., Kinnunen, M., Jędrzejewska-Szczerska, M., Tuchin, V.V. Measurements of fundamental properties of homogeneous tissue phantoms. J. Biomed. Opt.20, 045004 (2015).https://doi.org/10.1117/ 1.JBO.20.4.045004
24. Novikova, T., Rehbinder, J., Haddad, H., Deby, S., Teig, B., Nazac, A., Pierangelo, A., Moreau, F., De Martino, A.: Multi-spectral Mueller matrix imaging polarimetry for studies of human tissue. Biomedical Optics. (2016).
https://doi.org/10.1364/TRANSLATIONAL.2016.TTh3B.2OSA Technical Digest, paper TTh3B.2