R E S E A R C H A R T I C L E
Open Access
Effects of a moderate intake of beer on
markers of hydration after exercise in the
heat: a crossover study
David Jiménez-Pavón
1,2*, Mónica Sofía Cervantes-Borunda
1, Ligia Esperanza Díaz
3, Ascensión Marcos
3and Manuel J. Castillo
1Abstract
Background:Exercise in the heat causes important water and electrolytes losses through perspiration. Optimal rehydration is crucial to facilitate the recuperation process after exercise. The aim of our study was to examine whether a moderate beer intake as part of the rehydration has any negative effect protocol after a short but dehydrating bout of exercise in the heat.
Methods:Sixteen active male (VO2max, 56 ± 4 mL/kg/min), were included in a crossover study and performed a
dehydrating exercise (≤1 h running, 60 %VO2max) twice and 3 weeks apart, in a hot laboratory setting (35 ± 1 °C,
humidity 60 ± 2 %). During the two hours following the exercise bouts participants consumed either mineral water ad-libitum(W) or up to 660 ml regular beer followed by waterad-libitum(BW). Body composition, hematological and serum parameters, fluid balance and urine excretion were assessed before, after exercise and after rehydration. Results:Body mass (BM) decreased (both ~ 2.4 %) after exercise in both trials. After rehydration, BM and fat free mass significantly increased although BM did not return to baseline levels (BM, 72.6 ± 6.7 to 73.6 ± 6.9; fat free mass, 56.9 ± 4.7 to 57.5 ± 4.5, no differences BW vs W). Beer intake did not adversely affect any measured parameter. Fluid balance and urine excretion values did not differ between the rehydration strategies.
Conclusions:After exercise and subsequent water losses, a moderate beer (regular) intake has no deleterious effects on markers of hydration in active individuals.
Keywords:Dehydration, Hot conditions, Running, Alcohol, Diuresis, Young men
Background
Exercise in the heat causes important water and elec-trolyte losses through perspiration. Optimal rehydra-tion is crucial to facilitate the recuperarehydra-tion process after exercise [1, 2]. The American College of Sport Medicine (ACSM) [1] guidelines were designed to achieve an optimal rehydration protocol after exercise with sport beverage intake. In general, fluid replace-ment beverages should contain water and ~20–30 mEq/L sodium (chloride as the anion), ~2–5 mEq/L potassium, and ~5–10 % carbohydrate, depending on the specific
exercise task (e.g., intensity and duration) and enviromen-tal conditions [1].
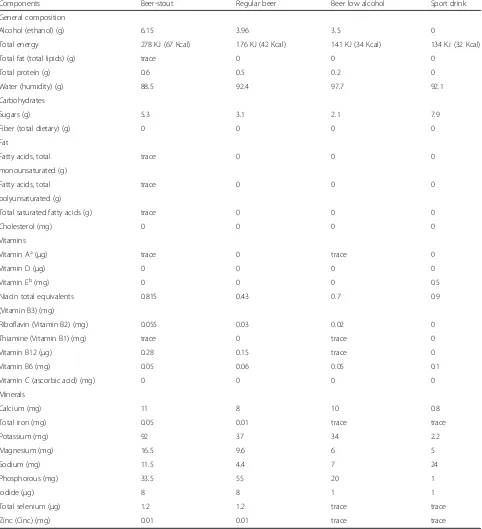
In Western countries it is common practice to drink beer (regular) after exercise [3, 4], as part of social rela-tionships [5] or after other physical activities (ie: manual worker in warm environments) [6]. This is particularly the case in the non-professional (amateur) context, where this practice is considered part of the social aspect of many sport activities. This is mostly the case when temperature conditions, and consequently perspiration rates, are high. Regular beer is a naturally fermented beverage, composed mainly of water, which contains some nutrients (such as carbohydrates, B vitamins, and minerals) [7]. Except for sodium and alcohol, beer has similar properties to that of sports beverages [1]. How-ever, the standard beer (regular) commonly consumed
* Correspondence:[email protected]
1
Department of Medical Physiology, School of Medicine, University of Granada, Avd. Madrid s/n, CP: 18012 Granada, Spain
2
GALENO Research Group, Department of Physical Education, Univeristy of Cadiz, Puerto Real, Spain
Full list of author information is available at the end of the article
contains alcohol (4–4.5 %) rather than low alcohol beers which are rarely consumed [5] (Table 1). Alcohol may represent a serious drawback that can blunt beer’s rehy-drating capacity and negatively affect the restoration of fluid balance increasing the diuretic response in the
body [8, 9]. Recently, interest has increased in under-standing how alcohol intake affects sports performance [8, 10, 11], but little is known regarding how alcohol in-fluences the recovery process and hydration status after exercise in the heat [12–15]. A moderate intake of
Table 1Composition of different beers and Sport Drink (for 100 g of edible portion)
Components Beer-stout Regular beer Beer low alcohol Sport drink
General composition
Alcohol (ethanol) (g) 6.15 3.96 3.5 0
Total energy 278 KJ (67 Kcal) 176 KJ (42 Kcal) 141 KJ (34 Kcal) 134 KJ (32 Kcal)
Total fat (total lipids) (g) trace 0 0 0
Total protein (g) 0.6 0.5 0.2 0
Water (humidity) (g) 88.5 92.4 97.7 92.1
Carbohydrates
Sugars (g) 5.3 3.1 2.1 7.9
Fiber (total dietary) (g) 0 0 0 0
Fat
Fatty acids, total trace 0 0 0
monounsaturated (g)
Fatty acids, total trace 0 0 0
polyunsaturated (g)
Total saturated fatty acids (g) trace 0 0 0
Cholesterol (mg) 0 0 0 0
Vitamins
Vitamin Aa(μg) trace 0 trace 0
Vitamin D (μg) 0 0 0 0
Vitamin Eb(mg) 0 0 0 0.5
Niacin total equivalents 0.815 0.43 0.7 0.9
(Vitamin B3) (mg)
Riboflavin (Vitamin B2) (mg) 0.055 0.03 0.02 0
Thiamine (Vitamin B1) (mg) trace 0 trace 0
Vitamin B12 (μg) 0.28 0.15 trace 0
Vitamin B6 (mg) 0.05 0.06 0.05 0.1
Vitamin C (ascorbic acid) (mg) 0 0 0 0
Minerals
Calcium (mg) 11 8 10 0.8
Total iron (mg) 0.05 0.01 trace trace
Potassium (mg) 92 37 34 2.2
Magnesium (mg) 16.5 9.6 6 5
Sodium (mg) 11.5 4.4 7 24
Phosphorous (mg) 33.5 55 20 1
Iodide (μg) 8 8 1 1
Total selenium (μg) 1.2 1.2 trace trace
Zinc (Cinc) (mg) 0.01 0.01 trace trace
BEDCA. Base de Datos Española de Composición de Alimentos (online). <http://www.bedca.net> a
Equivalents of retinol as retinos and carotenoids activities b
alcohol (2–4 drinks/day) has showed to have health bene-fits [16], however, individuals who regularly consume beer after sport may not have clear information about its dose-response effect. This is an important issue to study in order to advise those who regularly drink beer after sport or physical activity in the heat, or those using this bever-age by its well-known thirst quenching effect [17, 18].
The objective of the present study was to examine whether a moderate beer intake as part of the rehydra-tion has any negative effect after a short but dehydrating bout of exercise in the heat.
Methods Study design
A crossover, counter-balanced and randomized study was conducted in a group of 22 physically active men from the southerm Spain (Granada) to examine the ef-fect of rehydration with beer plus water (intervention phase) vs. water alone (control phase) after a running bout under hot environmental laboratory conditions.
The study protocol was performed in accordance with the ethical standards established in the Declaration of Helsinki. The study was approved by the Review Com-mittee for Research Involving Human Subjects of the University of Granada and by the Bioethics Committee of the Spanish National Research Council (CSIC). All participants were informed about the characteristics of the study and signed an informed consent. Inclusion cri-teria were being physically active, having a good fitness level, following a varied diet that included alcohol in moderate amounts, and being devoid of personal or fam-ily history of alcoholism. Participants were considered physically active if they practiced physical activity for at least 1 h, ≥4 times/week. To determine the level of fit-ness, aerobic capacity was assessed prior to inclusion and participants’VO2maxshould be above 50 ml/kg/min to be considered with a “good fitness level”. Maximal aerobic capacity (MAS) and maximal heart rate (Polar® 720i, Polar Electro Inc, Kempele, Finland) were assessed by the Université de Montréal Track Test [19]. A previ-ously validated equation was used to estimate VO2max [20]. A minimum of 40-min of treadmill running was re-quired. Finally, participants were asked to avoid strenu-ous exercise and consumption of alcohol or medication during the previous 2 days. Interview questionnaires were used to check for compliance when participants ar-rived to the laboratory. The participants were asked to follow a hydration protocol and to come the laboratory every morning during 1 week to record their weights in order to ensure euhydration status. The average body mass during the last 4 days was considered as euhydra-tion status if the standard deviaeuhydra-tion was < 150 g. Three participants did not fulfill the inclusion criteria of achiev-ing a VO2maxabove 50 ml/kg/min and 3 participants were
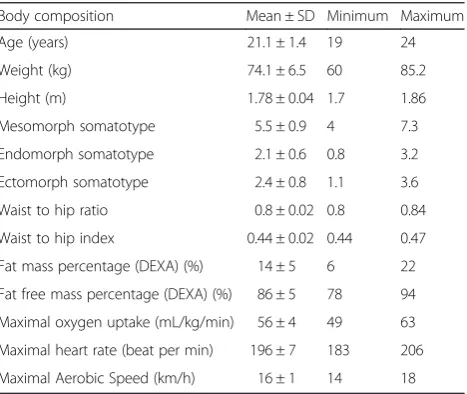
not able to run for at least 40 min in one of the 2 trials days. The final study sample therefore included 16 individ-uals, their features and body composition are described in Table 2.
Participants performed two identical trials, 3 weeks apart, with different rehydration in a hot laboratory set-ting. Temperature (35 ± 1 °C) and relative humidity (60 ± 2 %) in the laboratory were kept constant with an electric heating system and continuously checked using a portable digital weather tracker (Radio Controlled, Oregon Scien-tific). The exercise trial consisted of treadmill running for up to 1 h at 60 % VO2max(see below). After exercise, they were offered to drink either mineral waterad libitum or up to 660 ml of standard beer (4.5 %) and then waterad libitum. Rehydration strategies were randomly assigned and then swapped for the second trial, so that each par-ticipant was his own control. A set of measurements including body composition, hematological and serum pa-rameters, fluid balance, urine excretion (both composition and total urine volume), hormones, markers of muscular damage and inflammation parameters was assessed before exercise, immediately after exercise, and after 2 h of rehy-dration phase.
Running protocol
When the participants arrived to the laboratory they were asked to void all urine before measuring body mass in order to determine euhydration status. Differences in body mass compared to body mass in the previous week were not found (<150 ml) and the urine color was con-sidered adequate within the lighter color of the scale [21]. The running protocol was performed on a treadmill (h/p/cosmos®, Nussdorf-Traunstein, Germany), starting with 5 min of warming-up at 40 % of the individual
Table 2Body composition and physical characteristics of the participants at baseline
Body composition Mean ± SD Minimum Maximum
Age (years) 21.1 ± 1.4 19 24
Weight (kg) 74.1 ± 6.5 60 85.2
Height (m) 1.78 ± 0.04 1.7 1.86
Mesomorph somatotype 5.5 ± 0.9 4 7.3
Endomorph somatotype 2.1 ± 0.6 0.8 3.2
Ectomorph somatotype 2.4 ± 0.8 1.1 3.6
Waist to hip ratio 0.8 ± 0.02 0.8 0.84
Waist to hip index 0.44 ± 0.02 0.44 0.47
Fat mass percentage (DEXA) (%) 14 ± 5 6 22
Fat free mass percentage (DEXA) (%) 86 ± 5 78 94
Maximal oxygen uptake (mL/kg/min) 56 ± 4 49 63
Maximal heart rate (beat per min) 196 ± 7 183 206
Maximal Aerobic Speed (km/h) 16 ± 1 14 18
MAS, followed by up to 60 min at 60 % MAS (average speed: 9.6 ± 0.6 km/h), and 5 min at 30 % MAS for cool-ing down. Each participant provided a ratcool-ing of his own thirst perception before and after the running protocol, using a category scale ranging from one (“not thirsty”) to ten (“very, very thirsty”), as indicated elsewhere [22]. Seven participants completed the 60-min running time, while the rest of the sample (nine) performed between 40 and 59 min (average time: 52.4 ± 7.6 min). The rate of perceived exertion (RPE) was evaluated immediately before and after the running protocol using a standard-ized Borg scale board [23]. The exercise protocol was per-ceived as hard and increased from 8 to 18 in RPE (p< 0.001). Maximal heart rate percentage increased from 60 % to 95 % (p< 0.001). A fan was used in order to facili-tate sweat evaporation and thermoregulation, and for comfort reasons. Participants were advised to run wearing only shorts.
Rehydration phase
The rehydration phase was conducted by one of two dif-ferent rehydration strategies, randomly assigned before the first trial. Participants drank either standard beer (4.5 %) up to maximum 660 ml followed by mineral water ad libitum (intervention) or mineral water alone ad libitum(control). In the beer trial, participants’were able to drink less than the 660 ml of beer available prior to consuming waterad libitum, however, all participants voluntary drank 660 ml of beer before continue with water. On the second trial, participants who had re-ceived the intervention on the first trial were given the control treatment, and vice versa. During the rehydra-tion phase, the participants were asked to sit quietly in the laboratory and were allowed to drink the beverages on demand during a 2 h period. A researcher was in the room to serve liquids (6 °C) in doses of 200 ml on de-mand (glass beaker) and total fluid intake (ml) and time required were registered. Despite the ACSM guidelines prescribe a rehydration volume intake of 150 % of body mass loss [1], the current study include an ad libitum intake, however, due to the alcohol content beer was limited up to maximum 660 mL. Moreover, the thirst scale was used during the rehydration protocol to ensure that ad libitum rehydration was enough to calm the thirst.
Set of measurements
The set of measurements included several dimensions such as body composition, hematologic and serum pro-file, fluid balance and urine excretion in order to explore the consequences at different levels (for detailed des-cription of the techniques, methods and complementary parameters, see Additional file 1: Tables S1 and S2). Briefly, body mass (kg) and height (cm) were measured
with a standard balance beam incorporating a stadiometer (SECA, Vogel & Halke GmbH & CO. Hamburg, Germany; precision of 0.1 kg and 0.1 cm) with participants in under-wear and barefoot [24]. In addition, fat free mass and fat mass were measured by full body dual energy X-ray absorp-tiometry (DXA) using a Norland XR- 46 scanner (Norland, Fort Atkinson, WI) located in the exercise laboratory. Blood and urine parameters were also assessed. A 5 mL blood sample was taken three times by puncture of the cubital vein with minimum stasis and participants seated in com-fortable position. The first blood sample was taken just be-fore the exercise bout, after 8-h fasting plus one 1-h rest period; the second and third blood samples were taken im-mediately after exercise and rehydration, respectively. The samples were immediately aliquoted and stored at −80 °C until determination. The complete list of biological mea-surements included hematocrit (%), hemoglobin, mean cor-puscular volume (MCV [fL]), changes in plasma volume (%), iron (g/dL), urea (mg/dL), creatinine (mg/dL), sodium (mEq/L) and potassium (mEq/L). Changes in plasma vol-ume (%) were calculated [25]. The total urine volvol-ume (mL) was registered during the rehydration period (2 h) and dur-ing the last set of measurements (1.5 h) when participants needed to void, thus, the urine excretion rate (mL/min) was calculated from these variables. Urinary osmolality (mOsm/kg), urea (mg/dL), creatinine (mg/dL), uric acid (mg/dL), potassium (mEq/L), sodium (mEq/L), calcium (mg/dL), phosphorus (mg/dL), chlorine (mEq/L) and mag-nesium (mg/dL) were measured. The absolute excreted values were derived from the urine concentrations values and the total urine volume excreted in each trial.
Statistical analyses
Predictive Analytics SoftWare (PASW, version 18; SPSS Inc., Chicago, IL, USA) was used to perform the analyses. Statistical significance was set at p< 0.05. The data are presented as mean ± standard deviation (SD) or 95 % con-fidence intervals as appropriate. The changes across the 3 points of measurements for all the variables were analyzed using the general linear model (GLM) repeated measure adjusting for treatment, group and order, with Bonferroni pairwise post-hoc comparisons. Relative increments be-tween the two post-exercise measurement points (B and C) were calculated with the formula:Δ= (C-B)/B. The dif-ferences between the relative increments in each rehydra-tion strategy were examined using the GLM univariate analysis after adjusting for treatment. All the residuals showed a satisfactory pattern.
Results
Running protocol
per min; 2 ± 1vs.9 ± 1.3 thirst scores and 8 ± 1.2vs.18 ± 1.8 point for RPE, respectively). Post-exercise, after 5 min resting, mean heart rate and RPE significantly de-creased (185 ± 7.5 vs. 144 ± 5.1 beats per min and 18 ± 1.8 vs. 10 ± 1 point for RPE) (p< 0.001). There were no significant differences between the 2 days of evaluation. The exercise-induced dehydration was around 2.5 % (W, 2.4 % ± 0.3 %, BW, 2.3 % ± 0.1) of the body mass in both trials.
Body composition, hematologic and serum parameters
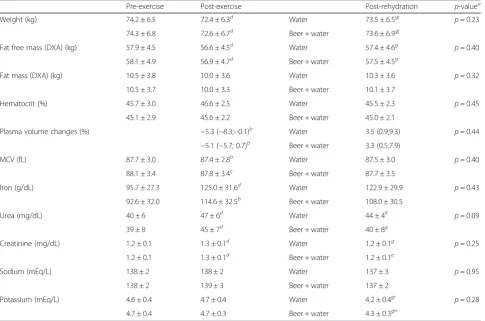
Table 3 shows pre-exercise, exercise and post-rehydration levels of body composition, hematologic and serum parameters. Body mass, fat free mass, plasma vol-ume and MCV significantly decreased, while iron, urea and creatinine significantly increased after exercise in both tests (p< 0.05). After rehydration, body mass and fat free mass significantly increased (p< 0.001), although body mass still remained under the baseline levels with both rehydration strategies (p< 0.001). Particularly, the average weight balance between post-rehydration and pre-exercise was minus 0.7 kg (<1 % of initial body
mass) with both strategies. Similarly, urea and creatin-ine decreased significantly after rehydration (p< 0.05), with urea remaining significantly higher than baseline levels with the control (water alone) strategy (p< 0.05). Moreover, potassium levels also decreased after rehy-dration with both strategies (p< 0.05), despite not hav-ing changed durhav-ing the exercise bouts. No differences between rehydration strategies for any of the variables were found at the end point (allp> 0.2, except for urea, p= 0.09).
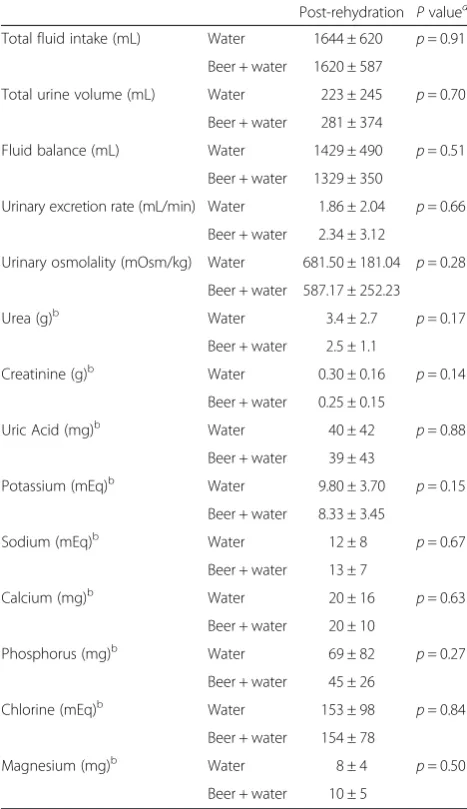
Fluid balance and urine excretion
Table 4 details the status of fluid balance and urine ex-cretion. None of the parameters analyzed differed signifi-cantly between rehydration strategies. Voluntary total fluid intake was approximately 90 % of the body mass lost after exercise; after taking into account the total urine volume, the fluid balance resulted in approxi-mately 80 % of the body mass lost. The time spent for voluntary total fluid intake ranged from 20 to 40 min. Thirst scores after rehydration protocol were 1 for all the participants in both trials.
Table 3Body composition, hematologic and serum parameters through the whole protocol
Pre-exercise Post-exercise Post-rehydration p-valuea
Weight (kg) 74.2 ± 6.5 72.4 ± 6.3d Water 73.5 ± 6.5gj p= 0.23
74.3 ± 6.8 72.6 ± 6.7d Beer + water 73.6 ± 6.9gj
Fat free mass (DXA) (kg) 57.9 ± 4.5 56.6 ± 4.5d Water 57.4 ± 4.6g p= 0.40
58.1 ± 4.9 56.9 ± 4.7d Beer + water 57.5 ± 4.5g
Fat mass (DXA) (kg) 10.5 ± 3.8 10.0 ± 3.6 Water 10.3 ± 3.6 p= 0.32
10.5 ± 3.7 10.0 ± 3.3 Beer + water 10.1 ± 3.7
Hematocrit (%) 45.7 ± 3.0 46.6 ± 2.5 Water 45.5 ± 2.3 p= 0.45
45.1 ± 2.9 45.6 ± 2.2 Beer + water 45.0 ± 2.1
Plasma volume changes (%) −5.3 (−8.3;−0.1)b Water 3.5 (0.9;9.3) p= 0.44
−5.1 (−5.7; 0.7)b Beer + water 3.3 (0.5;7.9)
MCV (fL) 87.7 ± 3.0 87.4 ± 2.8b Water 87.5 ± 3.0 p= 0.40
88.1 ± 3.4 87.8 ± 3.4c Beer + water 87.7 ± 3.5
Iron (g/dL) 95.7 ± 27.3 125.0 ± 31.6d Water 122.9 ± 29.9 p= 0.43
92.6 ± 32.0 114.6 ± 32.5b Beer + water 108.0 ± 30.5
Urea (mg/dL) 40 ± 6 47 ± 6d Water 44 ± 4fi p= 0.09
39 ± 8 45 ± 7d Beer + water 40 ± 8g
Creatinine (mg/dL) 1.2 ± 0.1 1.3 ± 0.1d Water 1.2 ± 0.1g p= 0.25
1.2 ± 0.1 1.3 ± 0.1d Beer + water 1.2 ± 0.1e
Sodium (mEq/L) 138 ± 2 138 ± 2 Water 137 ± 3 p= 0.95
138 ± 2 139 ± 3 Beer + water 137 ± 2
Potassium (mEq/L) 4.6 ± 0.4 4.7 ± 0.4 Water 4.2 ± 0.4gi p= 0.28
4.7 ± 0.4 4.7 ± 0.3 Beer + water 4.3 ± 0.3gh
a
differences between rehydration strategies Post- vs Pre-exerciseb
p≤0.05;c
p≤0.01;d
p≤0.001. Post-rehydration vs Post-exercisee
p≤0.05;f
p≤0.01;g
p≤0.001. Post-rehydration vs Pre-exercise h
p≤0.05;i
p≤0.001
Results for complementary parameters are showed in Additional file 1.
Discussion
The main findings from our study show that restoration of markers of hydration after a dehydrating bout of exer-cise in the heat is not negatively influenced by the acute intake of a moderate amount of beer (up to 660 mL) as part of the rehydration strategy. The present study also shows that the voluntary fluid intake in the 2 h following exercise and based on thirst sensation is not enough to completely recover the initial hydration status and this is neither influenced by beer intake or its palatability.
Although there are few studies analyzing the role of moderate alcohol intake on hydration status after exer-cise, our results partially concur with previous studies
regarding the lack of negative effects of moderate al-cohol intake after exercise [13–15]; however, differences in methodology, exercise protocols and alcohol usage hamper the comparison among studies. Shirreffs and Maughan (1997) studied the effect of the consumption of four beverages with different alcohol concentrations (0, 1, 2 and 4 %) on the restoration of fluid and electro-lyte balance after exercise-induced dehydration (loss of 2 % body mass, n= 6). The average volume consumed was 2212 mL, well above the amount provided in our study (up to 660 mL). They found that there was no dif-ference in body water content after rehydration with beverage without alcohol, or containing 1 or 2 % of alco-hol. By contrast, 4 % alcohol drink increased urine out-put and delayed the recovery process. In our study, no differences were found for any of the parameters assessed such as total urine volume, electrolyte excretion or body mass recovery when participants drank up to 660 mL of 4.5 % alcohol beer as part of the rehydration strategy, compared with drinking only mineral water. However, the final concentration of alcohol in relation to total fluid intake in our study (1.8 %) was similar to that reported by Shirreffs and Maughan (1997) (2 %), and the total amount of alcohol ingested was even lower (~24 gvs.35 g in Shirreffs and Maughan [1997]). An im-portant difference between our study and that of Shir-reffs’ is the use of regular beer, which is a commonly consumed beverage, instead of a prepared solution with alcohol. Recently, Desbrow et al. [15] analyzed the role of adding sodium in two type of beers with different al-cohol concentrations and they found similar conclusions that Shirreffs and Maughan (1997) regarding the lower urine output with ≤2 % of alcohol concentration [15]. Despite that on both studies [13, 15] a higher volume and total amount of alcohol intake were used in the re-hydration protocol and consequently their participants registered higher total volume of urine output, we con-cur with them in the lack of negative influence on hy-dration when the final alcohol concentration is around 2 % (1.8 % in the present study).
Hobson and Maughan (2010) performed an interesting study in 12 males aimed to examine the effect of beer intake (4 % alcohol) on urine production in euhydrated and hypohydrated individuals. With this purpose, the participants completed an intermittent cycling protocol in hot and humid conditions (35 °C and 68 %, respect-ively). On the following morning the participants were provided with 1000 mL of alcohol-free beer or 960 ml of this alcohol-free beer with 40 ml of ethanol added. They observed that ingestion of alcohol (4 %) did not cause differences in the urine volume between alcohol and non-alcohol beer when hypohydrated, but there were differences when euhydrated. The results in hypohy-drated participants are in agreement with our study, as Table 4Fluid balance and urine excretion
Post-rehydration Pvaluea Total fluid intake (mL) Water 1644 ± 620 p= 0.91
Beer + water 1620 ± 587
Total urine volume (mL) Water 223 ± 245 p= 0.70
Beer + water 281 ± 374
Fluid balance (mL) Water 1429 ± 490 p= 0.51
Beer + water 1329 ± 350
Urinary excretion rate (mL/min) Water 1.86 ± 2.04 p= 0.66
Beer + water 2.34 ± 3.12
Urinary osmolality (mOsm/kg) Water 681.50 ± 181.04 p= 0.28
Beer + water 587.17 ± 252.23
Urea (g)b Water 3.4 ± 2.7 p= 0.17 Beer + water 2.5 ± 1.1
Creatinine (g)b Water 0.30 ± 0.16 p= 0.14 Beer + water 0.25 ± 0.15
Uric Acid (mg)b Water 40 ± 42 p= 0.88 Beer + water 39 ± 43
Potassium (mEq)b Water 9.80 ± 3.70 p= 0.15 Beer + water 8.33 ± 3.45
Sodium (mEq)b Water 12 ± 8 p= 0.67 Beer + water 13 ± 7
Calcium (mg)b Water 20 ± 16 p= 0.63 Beer + water 20 ± 10
Phosphorus (mg)b Water 69 ± 82 p= 0.27 Beer + water 45 ± 26
Chlorine (mEq)b Water 153 ± 98 p= 0.84 Beer + water 154 ± 78
Magnesium (mg)b Water 8 ± 4 p= 0.50 Beer + water 10 ± 5
a
differences between rehydration strategies b
neither total urine volume, urine solutes nor plasma vol-ume were different when using alcohol beer (4.5 %) plus water or water alone in dehydrated participants. However, important differences exist between the exercise protocols for inducing dehydration of the above-mentioned studies [13–15], when compared with the current study. The main difference is that those authors used exercise specif-ically for achieving the dehydration status, while in our study we aimed to recreate a real life situation such as a short bout of exercise under hot conditions that induces dehydration, followed by moderate intake of beer (not pre-pared solution). Other studies have analyzed the effect of alcohol on hematological parameters and hydration status using high alcohol intakes, which constitutes a totally dif-ferent research paradigm [12, 26].
The findings and information on hormones, muscular damage, and stress and inflammation parameters from the current study (Additional file 1) add a new dimen-sion to the classical variables assessed in previous studies [13, 14], although these aspects have been partially ad-dressed in recent studies on muscular performance but using different doses of alcohol (high intake) and meth-odologies [10, 11, 27]. Briefly, In our study the consump-tion of a moderate intake of beer (up to 660 ml) plus water did not influence the normal recovery of several indicators of physiological stress and inflammation com-pared with a rehydration with water alone in participants dehydrated after exercise in the heat. These findings add new insights on the dose-response between beer intake and recovery processes.
The reasons why moderate alcohol intake does not substantially affect diuresis or hydration status in dedrated participants are not totally clear, but some hy-potheses have been suggested. Alcohol has classically been shown to exert its diuretic action by the inhibitory effect of ethanol on vasopressin release from the poster-ior pituitary gland [28]. However, with perspiration (and subsequent decrease in plasma volume and increase in plasma osmolality), a counteracting reduction in urine production could also be expected as a result of stimula-tion of vasopressin release. Which of these two opposite mechanisms will be the dominant might depend on the level of dehydration [9, 14], but could also depend on the effectiveness, lifespan of alcohol in the body or the type of beverage/nutrients included. Thus, it could be expected that the diuretic response to moderate alcohol intake would be blunted as the level of dehydration in-creased [29]. Additionally, the human body has the abil-ity to metabolize moderate quantities of alcohol through the family of enzymes called alcohol dehydrogenases [30]. Unfortunately, our study was not able to assess vasopressin, aldosterone or alcohol dehydrogenases in order to better understand the mechanisms underlying our results.
To the best of our knowledge this is the first study examining a practical and widespread use such as the in-clusion of a moderate consumption of beer as part of the rehydration strategy after exercise. Moreover, the use of a naturally-fermented and habitual beverage rather than prepared solutions, the implementation of a com-mon exercise protocol acom-mong amateur sport participants and the inclusion of an extensive set of precise measure-ments are strong points of this study. However, the present research has some limitations. First, due to the type of beverage used, a double-blind design was not possible. Secondly, the lack of information regarding vasopressin, aldosterone, alcohol dehydrogenases or blood alcohol, partially limits the interpretation of the results; however, other authors assessed these parameters in similar studies, obtaining results coherent with our findings [13, 14]. The fact that the total amount of fluid consumed was not fixed (a priori) between trials could constitute a limitation; however, we aimed to provide information about the voluntary total fluid drank when beer is included in the rehydration (up to 660 ml) ra-ther than high beer consumption. Moreover, we were not able to take blood samples hourly or after 48 h which would allow to better knowledge the evolution of these measurements. Further research is required to provide more insight into the effects of different rehy-dration strategies and using different types of bever-ages, including alcohol on recovery.
Conclusion
Our observations suggest that after exercise in the heat, and subsequent water losses, the acute intake of a moderate amount of beer (up to 660 ml) has no deleterious effects on markers of hydration neither on indicators of physio-logical stress recuperation in young healthy, physically ac-tive, male individuals. Taken together these findings we could advise those who regularly consume beer after sport or are physically active in the heat that a moderate intake would not alter the recuperation process. Nevertheless, high alcohol intake should not be recommended as the physiological and health consequences could be dangerous.
Additional file
Additional file 1:Additional methodological and result issues.
Abbreviations
Competing interests
The authors declare that they have no competing interests.
Authors’contributions
DJP carried out the study design and field work, performed the statistical analysis and drafted the manuscript. MSCB carried out the body composition measurements and helped to draft the manuscript. LED carried out the blood parameter analysis helped to draft the manuscript. AM made substantial contributions to conception and design, helped to interpretation of blood parameters measurements and helped to draft the manuscript. MJC made substantial contributions to conception and design, helped to interpretation and to draft the manuscript. All authors read and approved the final manuscript.
Acknowledgments
We gratefully acknowledge all participants who took part in this study for their collaboration. We also acknowledge the technical assistance of Fatima F de Heredia, Vanesa España-Romero and Enrique Garcia Artero. This article is dedicated to the memory of Dr. Javier Romeo. All authors wished to acknowledge his inestimable personal and professional contribution to the Immunonutrition Research group, and to this work in particular.
This study was partially supported by the“Centro de Información Cerveza y Salud”(n° C-2534-00). The authors declare no conflicts of interest as the funding organization has not any role in the collection of data, their analysis and interpretation, or in the right to approve or disapprove publication of the finished manuscript.
The study complies with the current laws of the country involved.
Author details
1Department of Medical Physiology, School of Medicine, University of
Granada, Avd. Madrid s/n, CP: 18012 Granada, Spain.2GALENO Research Group, Department of Physical Education, Univeristy of Cadiz, Puerto Real, Spain.3Immunonutrition Research Group, Department of Metabolism and Nutrition, Institute of Food Science and Technology and Nutrition. Spanish National Research Council (CSIC), Madrid, Spain.
Received: 22 December 2014 Accepted: 26 May 2015
References
1. Sawka MN, Burke LM, Eichner ER, Maughan RJ, Montain SJ, Stachenfeld NS. American College of Sports Medicine position stand. Exercise and fluid replacement. Med Sci Sports Exerc. 2007;39:377–90.
2. Rodriguez NR, Di Marco NM, Langley S. American College of Sports Medicine position stand. Nutrition and athletic performance. Med Sci Sports Exerc. 2009;41:709–31.
3. Watten RG. Sports, physical exercise and use of alcohol. Scand J Med Sci Sports. 1995;5:364–8.
4. Perez-Bibbins B, Torrado-Agrasar A, Salgado JM, Oliveira RP, Dominguez JM. Potential of lees from wine, beer and cider manufacturing as a source of economic nutrients: An overview. Waste Manage (New York, NY). 2015;40:72–81.
5. Anonymous. Socioeconomic report of the beer industry in Spain, 2012. In: Ministry of Agriculture, Food and Environment Technical Secretariat. 2013. 6. Irwin C, Leveritt M, Desbrow B. A hard earned thirst: workplace hydration
and attitudes regarding post-shift alcohol consumption. J Health Safety Environ. 2013;29:51–67.
7. Romeo J, Diaz L, Gonzalez-Gross M, Warnberg J, Marcos A. Contribution to the intake of macro and micro nutrients exerted by moderate beer consumption. Nutr Hosp. 2006;21:84–91.
8. Shirreffs SM, Maughan RJ. The effect of alcohol on athletic performance. Curr Sports Med Rep. 2006;5:192–6.
9. Kleeman CR, Rubini ME, Lamdin E, Epstein FH. Studies on alcohol diuresis. II. The evaluation of ethyl alcohol as an inhibitor of the neurohypophysis. J Clin Invest. 1955;34:448–55.
10. Barnes MJ, Mundel T, Stannard SR. A low dose of alcohol does not impact skeletal muscle performance after exercise-induced muscle damage. Eur J Appl Physiol. 2011;111:725–9.
11. Barnes MJ, Mundel T, Stannard SR. The effects of acute alcohol consumption on recovery from a simulated rugby match. J Sports Sci. 2012;30:295–304.
12. Burke LM, Collier GR, Broad EM, Davis PG, Martin DT, Sanigorski AJ, et al. Effect of alcohol intake on muscle glycogen storage after prolonged exercise. J Appl Physiol (Bethesda, Md: 1985). 2003;95:983–90.
13. Shirreffs SM, Maughan RJ. Restoration of fluid balance after exercise-induced dehydration: effects of alcohol consumption. J Appl Physiol (Bethesda, Md: 1985). 1997;83:1152–8.
14. Hobson RM, Maughan RJ. Hydration status and the diuretic action of a small dose of alcohol. Alcohol Alcoholism (Oxford, Oxfordshire). 2010;45:366–73.
15. Desbrow B, Murray D, Leveritt M. Beer as a Sports Drink? Manipulating Beer's Ingredients to Replace Lost Fluid. Int J Sport Nutr Exerc Metab. 2013;23(6):593–600.
16. Di Castelnuovo A, Costanzo S, Bagnardi V, Donati MB, Iacoviello L, de Gaetano G. Alcohol dosing and total mortality in men and women: an updated meta-analysis of 34 prospective studies. Arch Intern Med. 2006;166:2437–45.
17. Guinard JX, Souchard A, Picot M, Rogeaux M, Sieffermann JM. Determinants of the thirst-quenching character of beer. Appetite. 1998;31:101–15. 18. Rudnitskaya A, Polshin E, Kirsanov D, Lammertyn J, Nicolai B, Saison D, et al.
Instrumental measurement of beer taste attributes using an electronic tongue. Anal Chim Acta. 2009;646:111–8.
19. Léger L, Mercier D. Cofit energetique de la course sur tapis roulant et sur piste. Motricité Humainer. 1983;2:66–9.
20. Ahmaidi S, Collomp K, Caillaud C, Prefaut C. Maximal and functional aerobic capacity as assessed by two graduated field methods in comparison to laboratory exercise testing in moderately trained subjects. Int J Sports Med. 1992;13:243–8.
21. Armstrong LE, Soto JA, Hacker Jr FT, Casa DJ, Kavouras SA, Maresh CM. Urinary indices during dehydration, exercise, and rehydration. Int J Sport Nutr. 1998;8:345–55.
22. Maresh CM, Gabaree-Boulant CL, Armstrong LE, Judelson DA, Hoffman JR, Castellani JW, et al. Effect of hydration status on thirst, drinking, and related hormonal responses during low-intensity exercise in the heat. J Appl Physiol (Bethesda, Md: 1985). 2004;97:39–44.
23. Borg C. Perceived exertion and pain scales. Champaign, IL: Human Kinetics; 1998.
24. Marfell-Jones M, Olds T, Stewart A, Carter L. International standards for anthropometric assessment. Potchefstroom, South Africa: ISAK; 2006. 25. Dill DB, Costill DL. Calculation of percentage changes in volumes of blood,
plasma, and red cells in dehydration. J Appl Physiol (Bethesda, Md: 1985). 1974;37:247–8.
26. Irwin C, Goodwin A, Leveritt M, Davey AK, Desbrow B. Alcohol pharmacokinetics and risk-taking behaviour following exercise-induced dehydration. Pharmacol Biochem Behav. 2012;101:609–16.
27. Barnes MJ, Mundel T, Stannard SR. Acute alcohol consumption aggravates the decline in muscle performance following strenuous eccentric exercise. J Sci Med Sport. 2010;13:189–93.
28. Murray MM. The diuretic action of alcohol and its relation to pituitrin. J Physiol. 1932;76:379–86.
29. Taivainen H, Laitinen K, Tahtela R, Kilanmaa K, Valimaki MJ. Role of plasma vasopressin in changes of water balance accompanying acute alcohol intoxication. Alcohol Clin Exp Res. 1995;19:759–62.
30. Sher KJ, Grekin ER, Williams NA. The development of alcohol use disorders. Annu Rev Clin Psychol. 2005;1:493–523.
Submit your next manuscript to BioMed Central and take full advantage of:
• Convenient online submission
• Thorough peer review
• No space constraints or color figure charges
• Immediate publication on acceptance
• Inclusion in PubMed, CAS, Scopus and Google Scholar
• Research which is freely available for redistribution