69
Copyright © 2011-15. Vandana Publications. All Rights Reserved.Volume-5, Issue-1, February-2015
International Journal of Engineering and Management Research
Page Number: 69-74
Simulink Models of PV Array under Varying Conditions
Amrita Mantri1, Dr. Ajay Verma2 1
M.E. Scholar Department of Electronics Instrumentation, IET DAVV, INDIA 2
Professor, Department of Electronics Instrumentation, IET DAVV, INDIA
ABSTRACT
This paper presents the modeling and simulation results of PV array characteristics under varying conditions, including irradiation and temperature. A model is developed in sim electronics tool box of Simulink/Matlab. This modeling method and proposed step by step procedure is very useful to the designers for designing the PV array using basic mathematical equations. Simulated circuits are provided to aid students and engineers better understand PV operational characteristics through simulation. The parameters of the photovoltaic array model are obtained from the information available in the datasheet. The same is also explained in this paper.
Keywords— Renewable Energy, Solar cell, PV Array, MATLAB/SIMULINK
I.
INTRODUCTION
Due to consumption of electricity rapidly increases with the population growth, the new power generation capacities are required to cover that demand. Thus, the renewable energy is developing rapidly and become a more important contributor to the total energy consumed in the world.
The demand of solar energy has increased 20% to 25 % over the past of 20 years. The application of solar energy focusing on PV system has been increasing popularly. The market of PV system is growing worldwide, because of its silent operation, long life time, low maintenance, absence of fuel cost and inexhaustible. Even researchers have shown greater interest on PV technology due to its simplicity and elegant method of harnessing solar energy.
A PV cell converts the sunlight directly into electrical by means of photovoltaic effect. PV cell consist of P-N junction semiconductor polycrystalline material. A single PV cell generates a voltage around 0.5V to 0.8V. A PV module consists of number of PV cells connected in
particular configuration. A PV array consists of number of PV Modules connected in either in series and parallel configuration.
II.
MATHEMATICAL MODELING
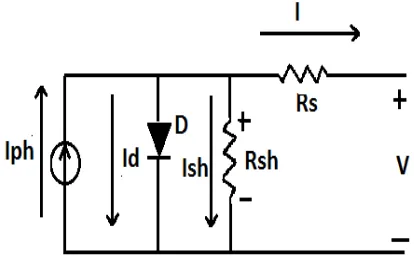
PV Cell has a non linear (V-I) characteristics, which can be modeled using current source, diode and resistor. A single diode and double diode models are widely used to simulate PV characteristics, but the single diode emulates the PV characteristics fairly and accurate. Fig 1 is model of the most commonly used PV cell; a current source, parallel with on diode, a series resistor Rs and shunt resistor Rp.
Figure 1: Equivalent Circuit of PV cell
PV cells are grouped in larger units called PV modules which are further interconnected in a parallel or series configuration to form PV arrays.
The photovoltaic array can be modeled mathematically as given in the following equations.
Module photo current
𝐼𝐼𝐼𝐼ℎ= [𝐼𝐼𝐼𝐼𝐼𝐼𝐼𝐼+𝐾𝐾𝐾𝐾(𝑇𝑇 −298)∗ 𝛾𝛾/1000…………(1)
Module Reverse saturation current
70
Copyright © 2011-15. Vandana Publications. All Rights Reserved. Module Saturation Current𝐼𝐼𝑉𝑉=𝐼𝐼𝐼𝐼𝐼𝐼 ∗ �𝑇𝑇𝐼𝐼𝑇𝑇�3𝑒𝑒𝑒𝑒𝐼𝐼[𝑞𝑞 ∗ 𝐸𝐸𝐸𝐸𝑉𝑉 ��𝑇𝑇𝐼𝐼1� − �𝑇𝑇1��] …….(3)
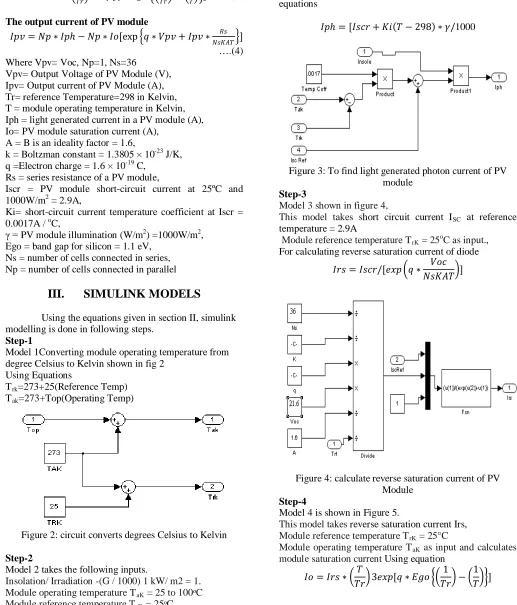
The output current of PV module
𝐼𝐼𝐼𝐼𝐼𝐼=𝑁𝑁𝐼𝐼 ∗ 𝐼𝐼𝐼𝐼ℎ − 𝑁𝑁𝐼𝐼 ∗ 𝐼𝐼𝑉𝑉[exp�𝑞𝑞 ∗ 𝑉𝑉𝐼𝐼𝐼𝐼+𝐼𝐼𝐼𝐼𝐼𝐼 ∗𝑁𝑁𝐼𝐼𝐾𝐾𝑁𝑁𝑇𝑇𝑅𝑅𝐼𝐼 �] ….(4) Where Vpv= Voc, Np=1, Ns=36
Vpv= Output Voltage of PV Module (V), Ipv= Output current of PV Module (A), Tr= reference Temperature=298 in Kelvin, T = module operating temperature in Kelvin, Iph = light generated current in a PV module (A), Io= PV module saturation current (A),
A = B is an ideality factor = 1.6,
k = Boltzman constant = 1.3805 × 10⁻²³ J/K, q =Electron charge = 1.6 × 10⁻¹⁹ C,
Rs = series resistance of a PV module,
Iscr = PV module short-circuit current at 25ºC and 1000W/m2 = 2.9A,
Ki= short-circuit current temperature coefficient at Iscr = 0.0017A / oC,
γ = PV module illumination (W/m2) =1000W/m2
III. SIMULINK MODELS
Using the equations given in section II, simulink modelling is done in following steps.
, Ego = band gap for silicon = 1.1 eV,
Ns = number of cells connected in series, Np = number of cells connected in parallel
Step-1
Model 1Converting module operating temperature from degree Celsius to Kelvin shown in fig 2
Using Equations
Trk=273+25(Reference Temp) Tak
Figure 2: circuit converts degrees Celsius to Kelvin =273+Top(Operating Temp)
Step-2
Model 2 takes the following inputs.
Insolation/ Irradiation -(G / 1000) 1 kW/ m2 = 1.
Module operating temperature TaK = 25 to 100ᵒC
Module reference temperature TrK
Short circuit current (I
= 25ᵒC.
SC
This model calculates the module photon current at given short circuit current (ISC) and operating temperature using equations
𝐼𝐼𝐼𝐼ℎ= [𝐼𝐼𝐼𝐼𝐼𝐼𝐼𝐼+𝐾𝐾𝐾𝐾(𝑇𝑇 −298)∗ 𝛾𝛾/1000 ) at reference temp. = 2.9A
Figure 3: To find light generated photon current of PV module
Step-3
Model 3 shown in figure 4,
This model takes short circuit current ISC at reference
temperature = 2.9A
Modulereference temperature TrK = 25o
Figure 4: calculate reverse saturation current of PV Module
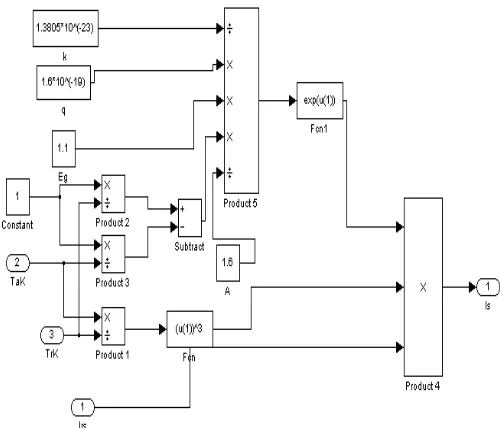
Step-4
Model 4 is shown in Figure 5.
This model takes reverse saturation current Irs,
Module reference temperature T
C as input.,
For calculating reverse saturation current of diode
𝐼𝐼𝐼𝐼𝐼𝐼=𝐼𝐼𝐼𝐼𝐼𝐼𝐼𝐼/[𝑒𝑒𝑒𝑒𝐼𝐼�𝑞𝑞 ∗𝑁𝑁𝐼𝐼𝐾𝐾𝑁𝑁𝑇𝑇𝑉𝑉𝑉𝑉𝐼𝐼 �]
rK = 25°C
Module operating temperature TaK as input and calculates
module saturation current Using equation
71
Copyright © 2011-15. Vandana Publications. All Rights Reserved.Figure 5: calculates module saturation current
Step-5
Model 5 is shown in Figure 6.
This model takes operating temperature in Kelvin TaK and calculates the product NsAkT, the denominator of the exponential function.
Figure 6: calculate NsKAT
Step-6
Model 6 is shown in Figure 7.
This model executes the function given by the equation (4) given in section III.
The following function equation is also used. IPV
Figure7: Module output current Model.
= u(3)-u(4)*(exp((u(2)*(u(1)+u(6)))/(u(5)))-1)
Step-7
All above six models are interconnected as given in Fig.8
Figure 8: Interconnection of subsystems of all six Models
72
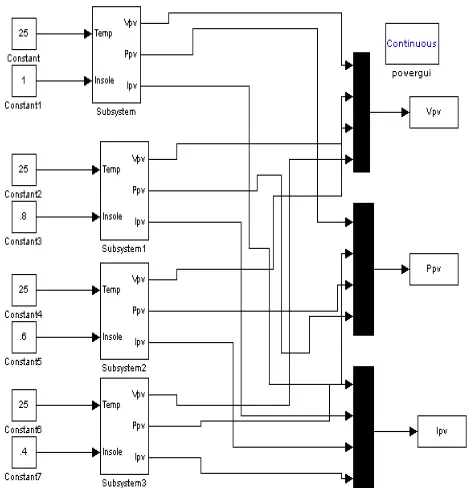
Copyright © 2011-15. Vandana Publications. All Rights Reserved.Figure 9: Simulink model of PV module
The final model takes irradiation, operating temperature in Celsius and module voltage as input and gives the output current Ipv and output power Ppv directly.
IV. OUTPUT MODEL AND
CHARACTERISTICS AT DIFFERENT
IRRADIATION
With the developed model, the PV module characteristics is estimated with variation of Irradiation
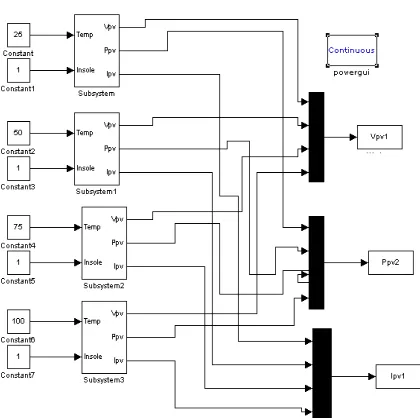
Figure 10: Subsystem of PV Module at different irradiation
Figure 11: I-V Characteristics of PV array at different Irradiation
73
Copyright © 2011-15. Vandana Publications. All Rights Reserved.V. OUTPUT MODEL AND
CHARACTERISTICS AT DIFFERENT
TEMPERATURE
Figure 13: Subsystem of PV Module at different irradiation
Figure 14: I-V Characteristics of PV array at different Temperature
Figure 15: P-V Characteristics of PV array at different Temperature
VI.
RESULTS
The I-V and P-V characteristic curves of the simulated model for different irradiation and constant temperature at 25°C are shown in Figure 11 and 12 shows that as the Irradiation increases, the current increase and voltage also increases, As a result, the power increasing with increasing Irradiation.
The I-V and P-V characteristic curves of the simulated model for different Temperature and constant Irradiation at 1KW/m2
[3] J. A. Gow and C. D. Manning, “Development of a photovoltaic array model for use in power-electronics
are shown in Figure 14 and 15 shows that
As
temperature increases, the voltage decreases substantially while the current undergoes significant increase. As a result, the power decreases with increasing temperature.VII. CONCLUSION
The step by step procedure of PV module is presented in this paper. This simulated circuit is very helpful to the students and those peoples who are doing photovoltaic research. Such a PV module is easy for the implementation on MATLAB/ SIMULINK modeling and simulation plat form.
REFERENCES
[1] I. H. Altas, A.M. Sharaf,” A Photovoltaic Array Simulation Model for Matlab-Simulink GUI Environment”, IEEE TRANSACTIONS ON POWER ENERGY, VOL .30,pg 341-345.
74
Copyright © 2011-15. Vandana Publications. All Rights Reserved.simulation studies”, IEE Proceedings- Electric Power Applications, vol. 146, no. 2, pp.193-199, 1999.
[4] Bhuvaneswari and R, Annamalai G, "Development of a solar cell model in MATLAB for PV based generation system," in India Conference (INDICON), 2011 Annual IEEE, 2011, pp. 1--5.
[5] M. G. Villalva, et al., "Comprehensive Approach to Modeling and Simulation of Photovoltaic Arrays," Power Electronics, IEEE Transactions on, vol. 24, pp. 1198-1208, 2009.
[6] M. Makhlouf, T. Kerbache, A. Bouzid R. Chenni, "A detailed modelling method for photovoltaic cells," Energy, vol. 32, no. 9, September 2007.