The Thirty-Third AAAI Conference on Artificial Intelligence (AAAI-19)
Incomplete Label Multi-Task Deep Learning
for Spatio-Temporal Event Subtype Forecasting
Yuyang Gao
George Mason UniversityLiang Zhao
George Mason UniversityLingfei Wu
IBM Research [email protected]Yanfang Ye
West Virginia University [email protected]Hui Xiong
Rutgers University [email protected]Chaowei Yang
George Mason UniversityAbstract
Due to the potentially significant benefits for society, fore-casting spatio-temporal societal events is currently attract-ing considerable attention from researchers. Beyond merely predicting the occurrence of future events, practitioners are now looking for information about specific subtypes of fu-ture events in order to allocate appropriate amounts and types of resources to manage such events and any associated so-cial risks. However, forecasting event subtypes is far more complex than merely extending binary prediction to cover multiple classes, as 1) different locations require different models to handle their characteristic event subtype patterns due to spatial heterogeneity; 2) historically, many locations have only experienced a incomplete set of event subtypes, thus limiting the local model’s ability to predict previously “unseen” subtypes; and 3) the subtle discrepancy among dif-ferent event subtypes requires more discriminative and pro-found representations of societal events. In order to address all these challenges concurrently, we propose a Spatial In-complete Multi-task Deep leArning (SIMDA) framework that is capable of effectively forecasting the subtypes of future events. The new framework formulates spatial locations into tasks to handle spatial heterogeneity in event subtypes, and learns a joint deep representation of subtypes across tasks. Furthermore, based on the “first law of geography”, spatially-closed tasks share similar event subtype patterns such that adjacent tasks can share knowledge with each other effec-tively. Optimizing the proposed model amounts to a new non-convex and strongly-coupled problem, we propose a new al-gorithm based on Alternating Direction Method of Multipli-ers (ADMM) that can decompose the complex problem into subproblems that can be solved efficiently. Extensive exper-iments on six real-world datasets demonstrate the effective-ness and efficiency of the proposed model.
Introduction
Spatio-temporal societal events such as disease outbreaks and organized crime have a significant impact on society. The ability to successfully forecast future spatial events of this nature would thus be extremely beneficial for decision makers seeking to avoid, control, or alleviate the associated social upheaval and risks. Spatial social event forecasting is
Copyright c2019, Association for the Advancement of Artificial
Intelligence (www.aaai.org). All rights reserved.
CO PM₁₀
NO₂ PM₂ ₅.
O₃ 8h SO₂
Guangning
Baoan Longhua
Nanshan Futian Luohu Yantian Longgang
Pingshan
Dapeng
Figure 1: Relative amounts of six air pollutant subtypes in 10 districts in Shenzhen, China, 2013 (Xia et al. 2016).
a fast-growing research area that typically forecasts the oc-currenceof future spatial events, namely whether or not a particular spatial event will happen. However, in many ap-plications simply forecasting theoccurrenceof an event is not enough. Knowledge regarding the subtypeorcategory of a future event is vital if decision makers are to achieve ac-curate and optimal resource allocation. For example, Figure 1 shows the percentage of six pollutant subtypes that feature in air pollution events based on the most frequently detected primary pollutants in Shenzhen, China in Summer 2013 (Xia et al. 2016). Local Environmental Monitoring Centers try to identify which pollutant source causing the most harm to public health and take appropriate action. For instance, when the pollutant subtype isP M2.5(atmospheric particu-late matter with a diameter less than 2.5 micrometers), the government can suggest that people who are sensitive to small particles wear gauze masks to protect themselves. On the other hand, when the subtype is O3 (trioxygen),
gov-ernment agencies need to alert people to avoid going out-side when theO3concentration is highest. Thus, successful
forecasting of the pollutant subtypes provides more specific information that enables practitioners to allocate resources that will address public health issues with the specific pri-mary pollutant source most effectively.
pro-vided in the supplementary material1. A few primitive stud-ies (Chen et al. 2013; Ning et al. 2016) have started to ex-plore this open problem, typically by applying simple multi-class multi-classification techniques. However, spatial event sub-type forecasting is far more complex than simply extending the binary classification problem into a multi-class setting, because of several crucial challenges are involved:1) Spa-tial heterogeneity and correlation of event-subtype pat-terns: Different locations have different characteristics, such as population, climate and administrative policies. In addi-tion, spatial locations are correlated in terms of their spatial topology. According to the well-known “first law of geog-raphy” (Cressie 2015), the event subtype pattern should be more similar in nearby locations than in those furtheraway.
2) Incomplete labels in spatial event subtypes: Due to the large number of potential subtypes and the limited avail-ability of historical data, there may be new subtypes that do not appear in a specific location in the training set. This means the predictive model for a specific location will be un-able to forecast these unseen subtypes in the future, which could lead to significant problems especially for rare but de-structive events, such as pandemics and terrorist attacks.3) Difficulties in representing event subtype patterns: The conceptual and semantic discrepancy between event sub-types could typically be too subtle to discriminate based solely on manually-defined features such as bag-of-words representations. This representation is both sparse and high-dimensional and hence suffers fromcurse of dimensionality (Bellman 2013) and low efficiency.
In this paper, we propose a novel Spatial Incomplete Multi-task Deep leArning (SIMDA) framework for spatial event subtype forecasting that addresses all the above chal-lenges. The main contributions of our study are as follows:
1. Developing a new deep-based framework for societal event subtype forecasting.We formulate event subtype forecasting for multiple locations as a spatial incomplete multi-task learning problem and propose a novel deep-based framework that learns profound representations of event subtypes across tasks. We enforce shared latent fea-ture representations for different locations while preserv-ing heterogeneity in their event subtype patterns.
2. Proposing a model that enforces spatial event sub-type patterns.Based on the first law of geography, we enforce similar event subtype patterns among spatially-closer tasks via a novel deep regularization term that is proved to be theoretically equivalent to the ratio of the probabilities of the event subtypes distribution patterns in nearby locations. In addition, the newly proposed deep regularization term enjoys better scalability with high-dimensional data and is thus more capable of handling complex real world problems effectively and efficiently.
3. Developing an efficient algorithm for solving new non-convex and strongly-coupled problems. To solve the proposed model’s objective function, which is non-convex and highly-coupled, we propose a new algorithm
1
http://mason.gmu.edu/∼lzhao9/materials/papers/
supp AAAI2019.pdf
based on the Alternating Direction Method of Multipliers (ADMM) that decomposes the original complex problems into subproblems that can be solved efficiently with ana-lytical solutions and conventional stochastic optimization.
4. Conducting comprehensive experiments to validate the effectiveness and efficiency of the proposed model.
Extensive experiments on six real-world datasets in two domains, civil unrest and air pollution event forecasting, demonstrate that the proposed models outperform other comparison methods in different application domains. In addition, sensitivity and qualitative analyses are provided to demonstrate the effectiveness of the proposed regular-ization term.
Problem Setup and Preliminary Setups
Problem Setup
Suppose there areS spatial locations (e.g., cities, states) in a country of interest and T denotes all the time intervals. The spatio-temporal social indicator data (e.g., social media, news, pollutant factors) for location s and time interval t
(e.g., one day) can be formulated asXs,t ∈ R1×D, which
denotes aD-dimension feature vector whosei-th element is a feature value (e.g., the term frequency or index value).
The event subtype at location s and time t is defined as an nominal response Ys,t ∈ {C1,C2, ...,CK}, where
C1,C2, ...,CK are class labels andK is the total number of event subtypes. Notice that here a “non-event” will also be defined as a default subtype when no event happens.
Given the input dataXs,tfor a specific locationsand a time intervalt, the goal is to predict the subtype of a future event, denoted byYs,τ, for the same locationsand a future time intervalτ, whereτ = t+pand p > 0 is the lead time. In this paper, the default time intervalstis per day and the lead timepis one day ahead unless otherwise specified. Formally, this problem is equivalent to learning a mapping from input data to a future event subtypeXs,t→Ys,τ.
Preliminaries
To address this issue, multi-class classification models (Wu et al. 2018) such as multinomial logistic regression (also known as softmax regression) and neural networks (Xu et al. 2018) are commonly used to solve the problem due to the nature of predicting multiple outputs with a single model.
The objective function of our problem with the softmax regression formulation is as follows:
L(θ) =− 1
ST
S
X
s T
X
t K
X
k=1
1{Ys,t=k}log
eXs,tθTk
PK
c=1eXs,tθ T c
!
(1) whereθ ∈ RK×Dis the parameter set of the model ,θ
k ∈
R1×Ddenotes the weight coefficients for classk, and1{·}is
the indicator function. For example, suppose the event sub-type for locationsat timetisk, then1{Ys,t=k}= 1while
1{Ys,t=j}= 0for anyj6=k.
Θ
{
Spatial Incomplete Multi-task Deep leArning
.
.
Task B misses Subtype 3during training Training set Predictions on Test set
Output layer
Task B Task A
Task B is able to predict Subtype3 by learning from adjacent task (e.g. Task C) Task C
Hidden representation ƒ(X)
Shared hidden layers
Enforce similar subtype patterns for adjacent tasks
ΘA ΘB ΘC
(SIMDA)
Enforce shared hidden representations across tasks
.
Input X
Φ
{
tasks
d
a
te
s
{
{
31
1 1
2
2 1
2
3 tasks
d
a
te
s
{
{
31
3 1
3
2 1
3
3
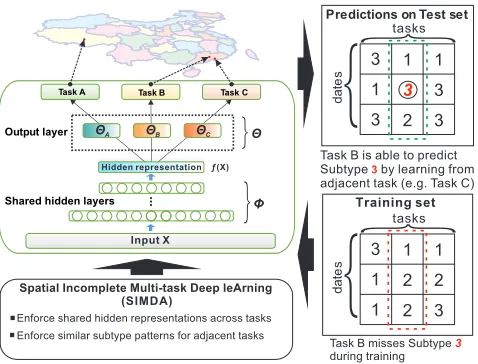
Figure 2: Flowchart of the proposed SIMDA framework
To address this challenge, we can extend Equation (1) to create a location-specific model, where each locationshas its own weight coefficient set, denoted as Θs ∈ RK×D.
Here,Θs,k ∈ RD×1denotes the weight coefficients for
lo-cations and for classk and the objective function of the location based softmax regression formulation is as follows:
L(Θ) =− 1
ST
S
X
s T
X
t K
X
k=1
1{Ys,t=k}log
eXs,tΘTs,k
PK
c=1e
Xs,tΘTs,c
!
(2) However, the above formulation is still insufficient as Equation (2) assumes all the locations are independent, even though some spatial correlations will exist among the vari-ous locations in terms of the event subtype pattern, as shown in Figure 1. Also, Equation (2) tries to learn an individual pa-rameter setΘsfor each locations, which can dramatically reduce the training sample size for a given location model. Furthermore, due to the large number of potential subtypes and the limited amount of local historical data, there may be unseen subtypes that have not appeared in a specific location within a time period. For example in Brazil, there were no education or medical related protests in city Belo Horizonte during the time period from July, 2013 to February, 2014. This means the specific model for the city Belo Horizonte will not be able to forecast these two subtypes in the future.
SIMDA Model
Incomplete Multi-class Spatial Regularization
In order to jointly handle the spatial heterogeneity issue in Equation (1) and spatial correlation issue in Equation (2), multi-task learning technique is leveraged which can jointly learn the shared characteristics among tasks while preserve the exclusive patterns for each task (Yuan, Zhou, and Yang 2018; Thrun and O’Sullivan 1998). (Zhao et al. 2015b) have demonstrated the utility of applying a Multi-Task Learning framework for forecasting spatiotemporal event occurrence. (More detailed literature survey is included in the supple-mental material.) However, when forecasting event subtype,
where multi-class classification problem is combined with multi-task learning, each task has only a limited number of samples and thus in practice not every task has a complete set of labels in the training set. For example, in Figure 2 the bottom right box contains an example of a set of train-ing data labels (event subtypes). Only task C has a com-plete set of labels, the other two tasks are both missing one class. Consequently, the weight coefficient associated with the missing event subtypekcannot be learned during train-ing and the model is not capable of predicttrain-ing the misstrain-ing event subtypes. Note that this issue becomes more severe as the number of class labels increases.
In order to address this problem, we propose allowing cor-related tasks to adaptively complement each other’s missing classes. This means that we first need to determine the cor-relation among tasks. Based on the first law of geography, namely “everything is related to everything else, but near things are more related than distant things”(Cressie 2015), nearby locations will tend to be more similar to each other.
For a time interval t, given two locations i and j that are close in geo-spatial distance, the probability of the event subtypeCaat locationidenoted asP(Yi,t =Ca|Xi,t), will be similar to that at locationj, leads to the following equa-tion:
P(Yi,t=Ca|Xi,t)≈P(Yj,t=Ca|Xj,t) (3) Likewise, the ratio of the probability of the event subtype at location ibeing equal to event subtype Ca compared to event subtypeCb, should also be similar to that at locationj. This can be expressed as:
P(Yi,t=Ca|Xi,t)
P(Yi,t=Cb|Xi,t)
≈P(Yj,t=Ca|Xj,t)
P(Yj,t=Cb|Xj,t)
(4)
The posterior probabilityP(Yi,t=Ca|Xi,t)can be equiv-alently represented by any multi-class based models. The similarity pattern based on the ratio of the probability above can thus be equivalently denoted by inputXand weight co-efficientΘbased on Equation (2), as shown in Lemma 1.
Lemma 1. Based on the model shown in Equation (2) , Equation(4)is theoretically equivalent to the following:
Xi(Θi,a−Θi,b)T ≈Xj(Θj,a−Θj,b)T (5)
where i and j are two tasks that are close in geo-spatial distance andaandbare any two different event subtypes.
Proof. Please see our supplemental material for details.
Therefore, we propose a new model to regularize the pa-rameter based on Equation (4), and equivalently on Equation (5) by introducing a new regularization term forΘbased on spatial adjacency of the tasks. Mathematically, we propose the following model objective as follows:
L(Θ) + β 2
XS
s
XCk2
i,jkXs(Θs,i−Θs,j)
T (6)
− 1
Ns
XS
c adj(s, c)Xc(Θc,i−Θc,j) Tk2
2
be defined based on either spatial correlations such as spa-tial contiguity or spaspa-tial distance. Nsis the normalization term for locationssuch thatNs=P
S
c adj(s, c). Here, the adjacent function is defined based on the physical distance and the well-known generalized RBF kernel (Haasdonk and Bahlmann 2004), as: adj(s, c) =e−γd(s,c)2 . The function
d(s, c)can be the physical distance between two spatial lo-cations andγis the scaling factor.
The proposed regularization term encourages adjacent tasks to have a similar ratio of the probability between any pair of event subtypes by ensuring the difference between the corresponding weight coefficients and inputXi(Θi,Ca− Θi,Cb)
T is similar for adjacent tasks. The regularization
hyper-parameter β controls the importance of this term, which can be tuned via cross-validation.
Generalization to Deep Spatial Regularization
Softmax regression model can be seen as a special case of a neural network with 0 hidden layers. In this section, we propose a generalized Spatial Incomplete Multi-task Deep leArning (SIMDA) framework based on the deep architec-ture with arbitrary number of hidden layers. Figure 2 shows a flowchart of the proposed SIMDA framework. The frame-work adopts the idea of a shared bottom architecture that can learn the shared hidden representations of event subtypes across tasks. In addition, a spatial adjacency based deep reg-ularization term is proposed to regularize the hidden rep-resentation learned by the shared hidden layers to enforce similar event subtype patterns for spatially adjacent tasks. For example, in Figure 2 Task B and Task C are closer than Task A, thus Task B and C can share knowledge of their sub-type patterns and influence each other more strongly while Task A, which is further away, will not influence them as much. Consequently, with the help of this knowledge shar-ing, Task B is able to learn unseen event subtypes through Task C, mitigating the problem of incomplete subtype avail-ability due to gaps in the local task training data.
More specifically, the generalized framework enjoys sev-eral advantages, including:1) Greater discriminative and predictive power. Based on the Universal Approximation Theorem (Hornik 1991), a simple neural network including only a single hidden layer can approximate any continuous function. More specifically, for event subtype forecasting, developing a better understanding of the subtle differences among event subtypes requires deep representations.2) Bet-ter generalizability with deep spatial regularization. Spa-tial regularization on the highly-concise feature representa-tions learned by deep architecture can help boost the model generalizability considerably and it is especially important for deep learning applications that involve large dataset.3) Better efficiency with respect to input dimensions.Deep models learn highly-condensed and discriminative represen-tations that typically have less dimensionality than row in-puts, which means that generalized SIMDA frameworks can be more efficient to optimize.
In generalized SIMDA framework, suppose the function
f(·) denotes the computation of the shared hidden layers andΦ denotes the parameter set of the network, the
acti-vation f(X)is thus the hidden representations learned by the shared hidden layers. f(X) is then passed as input to the task specific output layers with weight coefficientΘto compute the final result, as shown in Figure 2. The similarity pattern based on the ratio of the probability in Equation (4) can thus be equivalently denoted byf(X)andΘ, as shown in Theorem 1.
Theorem 1. In the SIMDA framework, for any deep learn-ing architectures that use the softmax function as their out-put layer, equation(4)is theoretically equivalent to the fol-lowing:
f(Xi)(Θi,a−Θi,b)T ≈f(Xj)(Θj,a−Θj,b)T (7)
whereΘi,bdenotes the task specific output layer weight co-efficient vector for taskiand classCb.
Proof. Please see our supplemental material for details.
Notice that Theorem 1 can be seen as a generalized form of Lemma 1 since Lemma 1 is a special case when function
f(·)is the identity functionf(X) =X. Moreover, since the regularization directly works on the output layer parameters setΘ and activationf(X), there is no further restrictions of the network structures regarding the shared hidden lay-ers. This means that the framework can be used with vari-ous deep learning architectures on the shared bottom layers (such as convolutional layers) and arbitrary activation func-tions (such as ReLU).
Mathematically, the Spatial Incomplete Multi-task Deep leArning (SIMDA) framework is as follows:
LD(Φ,Θ) +
β
2
XS
s
XCk2
i,jkf(Xs)(Θs,i−Θs,j) T (8)
− 1
Ns
XS
c adj(s, c)f(Xc)(Θc,i−Θc,j) T
k22
where we defineLD(Φ,Θ) as the general multi-task deep learning objective function;Φis the weight coefficient pa-rameter set for the shared hidden layers;Θis the task spe-cific output layer weights withΘs,idenoting the weights for tasksand for predicting classCi.
Theorem 1 and the above model objective indicate that instead of directly applying the regularization based on input dataX, SIMDA will learn the mapping from the input data from different tasks in a deep shared feature space and then apply the spatial regularization to the latent representation.
Algorithm
and Abbasi 2016) applied ADMM on deep convolutional neural networks with sparse regularization and observed im-provement on the optimization efficiency and overall perfor-mance; (Sun et al. 2016) proposed ADMM-NET for solving the general Compressive Sensing MRI problem. However, those algorithms are normally problem dependent and thus can not be directly used here. A new method is needed to solve our new problem which is highly challenging.
Algorithm 1:The Proposed Algorithm
Require:X, Y, ρ, β, λ
Ensure:solutionΦ,Θ
1: initializeΦ0,Θ0, V0, W0, Z0, y(1)0, y(2)0, y(3)0, i= 0 2: repeat
3: % Solve subproblem of variableΦ,Θby fixing the other variables 4: Φi,Θi⇐
argminΦ,ΘLD(Φ,Θ) + tr(y(1)(Z−f(X))T)+ρ2||Z−f(X)|| 2
2+
tr(y(2)(Θ−V)T)+ρ2||Θ−V||2
2+tr(y
(3)(Θ−W)T)+ρ
2||Θ−W||
2 2 5: fors⇐1toKdo
6: % Get the analytical solution by setting∇VsL(Φ,Θ,V,W,Z) = 0
7: Vi
s ⇐
β(ZT
sZs)⊗(M MT) +ρI
−1
vec
y(2)s +ρΘs+βM
1
Ns PS
cadj(s, c)ZcWcTM
T
Zs
8: end for
9: forc⇐1toKdo
10: % Get the analytical solution by setting∇WcL(Φ,Θ,V,W,Z) = 0
11: Wi
c⇐
βPSsadj(s,c)2
Ns2 (Z T
cZc)⊗(MMT)+ρI
−1
vec
y(3)c+ρΘc−βPSsM
1
Ns PS
i6=cadj(s,i)ZiWiTM−ZsVsTM
T
Zc
12: end for
13: fors⇐1toKdo
14: % Get the analytical solution by setting∇ZsL(Φ,Θ,V,W,Z) = 0
15: Zsi⇐−y(1)s +ρf(Xs)+β
1
Ns PS
cadj(s, c)ZcWcTM
MTVs
βVsTM MTVs+ρI
−1
16: end for
17: y(1)i⇐y(1)+ρ(Z−f(X)) % Update dual variabley(1)
18: y(2)i⇐y(2)+ρ(Θ−V) % Update dual variabley(2)
19: y(3)i⇐y(3)+ρ(Θ−W) % Update dual variabley(3)
20: i⇐i+ 1
21:untilconvergence
Thus, we propose a new algorithm based on ADMM that first decomposes the original problem into several simpler subproblems that can then be solved iteratively. Our algo-rithm ensures global optimal solutions with analytical so-lutions for all subproblems except the subproblem that in-cludes the original deep model loss, which will be solved with Stochastic Gradient Descent (SGD) to get local optima. More details of the algorithm are presented as follows.
Based on the ADMM formulation, the original objective function of SIMDA can now be re-written as follows:
LD(Φ,Θ) +
β
2
XS
s
XCk2
i,j kZs(Vs,i−Vs,j) T
− 1
Ns
XS
c adj(s, c)Zc(Wc,i−Wc,j) Tk2
2 (9)
s.t.Θ =V,Θ =W, Z=f(X)
Thus, by decoupling the output layer parameter setΘthat appears both in deep model loss and regularization term, the
original problem is transformed into a simpler one with aux-iliary variables V, W andZ. The augmented Lagrangian that uses additional quadratic penalty terms with penalty pa-rameterρis further computed as follows:
L(Φ,Θ,V,W,Z)=LD(Φ,Θ)+tr(y(1)(Z−f(X))T)+
ρ
2||Z−f(X)|| 2 2 +β 2 S X s C2 k X i,j
kZs(Vs,i−Vs,j)T−
1
Ns
S X
c
adj(s, c)Zc(Wc,i−Wc,j)Tk22+
tr(y(2)(Θ−V)T)+ρ 2||Θ−V||
2
2+tr(y(3)(Θ−W)T)+ ρ 2||Θ−W||
2 2
where thetr(·)operator denotes the trace of the matrix. The pseudo-code of the proposed algorithm is summarized in Algorithm 1. The parameter set
{Φ,Θ, V, W, Z, y(1), y(2), y(3)} is alternately solved
by the proposed algorithm until convergence is achieved. Lines 3-15 show the alternating optimization for each of the variables. M ∈ Rk×C
2
k is an auxiliary matrix to help
make the computation in matrix format, as elaborated in the supplementary material.
Experiments
Dataset and Experiment Setup
In this study, five datasets from civil unrest forecasting and one dataset from air pollution event forecasting are used for the experimental evaluations. All the experiments were con-ducted on a 64-bit machine with Intel(R) core(TM) quad-core processor (i7CPU 2.5GHz) and 16GB memory.
Civil Unrest Datasets: These datasets were obtained from 5 different countries in Latin America, namely Brazil, Colombia, Mexico, Paraguay, and Venezuela. Data sources from Twitter are adopted as the model inputs. In each case the data for the period from July 1, 2013 to February 9, 2014 is used for training and validation, where the valida-tion set consists of a randomly chosen 30% of the data, and the rest is used for training; the data from February 10, 2014 to December 31, 2014 is used for the performance evalu-ation. The event forecasting results are validated against a well-established labeled events set, the Gold Standard Re-port (GSR) (GSR Dataset ). GSR is a collection of civil un-rest news reports from the most influential newspaper outlets in Latin America (O’Connor et al. 2010). The event subtype for the civil unrest dataset is the event primary population type (i.e. ‘Business’, ‘Education’ etc.). An example of a la-beled GSR event is given by the tuple: (City=“Maracaibo”, State =“Zulia”, Country = “Venezuela”, Date = “2013-01-19”, Event subtype=“Education”).
p(1 day, 3 days, 5 days, and 7 days) are utilized in the experi-ment. The forecasting results for the most important primary pollutants are validated against the corresponding air qual-ity statistics reported by the corresponding cities’ local air quality monitoring stations, together with each city’s Envi-ronmental Monitoring Center. The EnviEnvi-ronmental Monitor-ing Centers publish daily summaries of the primary pollu-tants affecting their cities. The event subtype is the most im-portant primary pollutant (such asP M2.5,P M10,O3and
N one, with the latter indicating good air quality with no ma-jor pollutants present). An example of an air pollution daily report is: (City = “Beijing”, Station = “Temple of Heaven”, Date = “01-01-2017”, Primary Pollutant = “P M2.5”).
Parameter Setting: The hyper-parameters and network structure are chosen via a grid search based on model per-formance on the validation set. For all neural network based models, fully connected layers with sigmoid activation func-tion are used. More detailed parameter settings and sensitiv-ity analysis are presented in the supplemental material.
Performance Evaluation: To evaluate the model perfor-mance, macro-average precision, recall and F1-Score are used here to provide an overall measure of model perfor-mance across all event subtype classes. In addition, we also introduce the Receiver Operating Characteristic (ROC) curve to further evaluate the overall prediction power.
Baselines for comparison: The performance of the pro-posed model is compared with baselines as well as exist-ing state of the art methods, namely:SVC1V1(Support Vec-tor Classifier with OneVsOne) andSVC1VA(Support Vector Classifier with OneVsAll) (Hsu and Lin 2002),SR(Softmax Regression) (Nasrabadi 2007; Chen et al. 2013),MLP (Mul-tiLayer Perceptron)(Rumelhart, Hinton, and Williams 1985) andSBM (Shared-Bottom Model) (Caruana 1998; Caruna 1993). The detailed introduction and hyper-parameter set-tings are included in the supplemental material.
Performance
Tables 1 and 2 show the performance for all the methods on all the datasets over all the event subtypes based on macro-average precision, recall and F1-score. For neural network based models the numbers attached along with the model name are the number of hidden layers, notice that SIMDA-SR is SIMDA framework used with Softmax Regression (i.e. without hidden-layers) . In both tables, the best results for each dataset are highlighted in bold face and underlined; the second best are in bold face only.
Table 1 shows that SIMDA framework used along with deep architectures performs consistently well across all the different countries, being the best in Brazil, Mexico, Paraguay, and Venezuela and competitive in Colombia. It outperforms the baseline models by 10% - 25% among macro-average precision, recall and F1-score. The baseline SBM also achieves good scores, but is overall not as com-petitive as SIMDA. This is largely because SIMDA utilizes geo-information by including the proposed spatial correla-tion based constraint. Interestingly, SIMDA largely outper-forms the baselines on the Venezuela dataset, but achieves only competitive results on the Colombia dataset compared with SBM. Examining the dataset, 11 of the 14 cities have
0 0.2 0.4 0.6 0.8 1
True Positive Rate
0 0.2 0.4 0.6 0.8 1
False Positive Rate
Civil Unrest (Brazil) Dataset
SIMDA (AUC=0.81) MLP (AUC=0.77) SBM (AUC=0.77) SVC1VA (AUC=0.71) SVC1V1 (AUC=0.70) SR (AUC=0.53)
0 0.2 0.4 0.6 0.8 1
True Positive Rate
0 0.2 0.4 0.6 0.8 1
False Positive Rate
China Air Dataset
SIMDA (AUC=0.80) MLP (AUC=0.77) SBM (AUC=0.78) SVC1VA (AUC=0.78) SVC1V1 (AUC=0.76) SR (AUC=0.65)
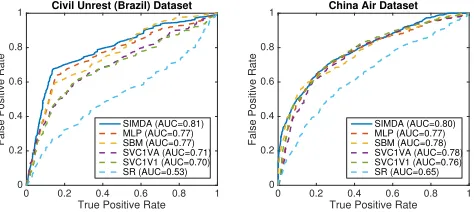
Figure 3: Macro-average ROC comparison
incomplete event subtype classes in the Venezuela dataset, nearly 80% of the total, while only 8 out of 13 cities have incomplete event subtype classes in the Colombia dataset, around 60%. This may suggest that the spatial regulariza-tion term in SIMDA improves the performance substantially when there is more serious incompleteness of classes.
Table 2 also demonstrate the effectiveness of the proposed methods in the domain of air pollution event forecasting with different prediction lead times. SIMDA used along with deep architectures outperforms the baseline models consis-tently by 5%-10% in terms of the F1-score and achieves the top performance for both precision and recall. The results presented in this table also highlight the increasing diffi-culty of predictions with longer lead times, as forecasting long-term future events introduces considerably more un-certainty. However, the proposed model behaves stably and suffers from less decline in terms of its overall performance compared with the other methods. For instance, the F1-score only decreases by about 10% for the SIMDA-3 model, while other baselines decrease by about 15%-30%. This may sug-gest that the proposed spatial regularization term in SIMDA improves the robustness of the deep model substantially, en-abling it to capture more long-term dependencies of the data and the corresponding event subtypes.
The experimental results in both Table 1 and 2 show that overall shallow models such as SR, SVM based models and SIMDA-SR perform worse than deep models with hidden layers such as MLP, SBM and SIMDA-3. This is largely be-cause shallow models cannot discriminate the subtle differ-ences between event subtype patterns very well. Notice that among the shallow models, SIMDA-SR still outperforms all other baselines most of the time, which further demonstrates the effectiveness of the proposed spatial regularization even on shallow models on various application domains.
Table 1: Performance comparison for the civil unrest datasets (macro Precision, Recall and F1).
Method Brazil Colombia Mexico Paraguay Venezuela
SVC1VA 0.2318,0.2479,0.2368 0.2374,0.2673,0.2447 0.1798,0.1991,0.1738 0.2009,0.2396,0.2055 0.2136,0.2348,0.2069
SVC1V1 0.2444,0.2582,0.2465 0.2062,0.2096,0.1995 0.1651,0.1600,0.1511 0.2058,0.2715,0.2152 0.2118,0.2481,0.2058
SR 0.2131,0.2525,0.2247 0.2496,0.2840,0.2545 0.1781,0.1888,0.1676 0.2212,0.2644,0.2287 0.2239,0.2507,0.2191
SIMDA-SR 0.2586,0.2699,0.2560 0.2568,0.2799,0.2645 0.2106,0.1897,0.1849 0.2378,0.2935,0.2402 0.2538,0.2661,0.2326
MLP-1 0.2423,0.2358,0.2359 0.2369,0.2354,0.2357 0.1800,0.1957,0.1715 0.2160,0.3145,0.2234 0.2174,0.2200,0.2155
MLP-2 0.2512,0.2575,0.2530 0.2594,0.2736,0.2634 0.1757,0.1534,0.1608 0.2300,0.2694,0.2307 0.2180,0.2311,0.2152
MLP-3 0.2699,0.2590,0.2643 0.2400,0.2628,0.2436 0.1842,0.1539,0.1675 0.2133,0.2049,0.2084 0.2174,0.2200,0.2155
SBM-1 0.2821,0.2634,0.2696 0.2956,0.2701,0.2762 0.2237,0.2051,0.2121 0.2447,0.3655,0.2543 0.2212,0.2115,0.2122
SBM-2 0.2560,0.2737,0.2597 0.2919,0.2637,0.2732 0.2104,0.1951,0.2009 0.2363,0.2971,0.2416 0.2455,0.2505,0.2286
SBM-3 0.2821,0.2637,0.2714 0.2759,0.3176,0.2863 0.2060,0.1793,0.1908 0.2392,0.2459,0.2369 0.2545,0.1910,0.2162
SIMDA-1 0.2848,0.2804,0.2788 0.3067,0.2761,0.2845 0.2187,0.2070,0.2123 0.2467,0.3749,0.2562 0.2684,0.2422,0.2477
SIMDA-2 0.3558,0.2887,0.2779 0.2648,0.3130,0.2670 0.2252,0.2110,0.2176 0.2543,0.3373,0.2638 0.2704,0.2421,0.2471
SIMDA-3 0.2828,0.2641,0.2712 0.2689,0.3152,0.2710 0.2081,0.2338,0.2000 0.2473,0.4482,0.2532 0.2178,0.2571,0.2174
Table 2: China air pollution event forecasting dataset with various prediction lead times (macro Precision, Recall and F1).
Method 1-day 3-days 5-days 7-days
SVC1VA 0.4966,0.5255,0.5009 0.4362,0.4768,0.4309 0.3940,0.3946,0.3872 0.4334,0.4553,0.4240 SVC1V1 0.5700,0.5716,0.5652 0.4532,0.4849,0.4565 0.4361,0.4545,0.4380 0.4351,0.4412,0.4302 SR 0.4254,0.4338,0.4287 0.4082,0.4229,0.4102 0.3949,0.4208,0.3974 0.4126,0.4277,0.4104 SIMDA-SR 0.5290,0.6436,0.5572 0.4256,0.6395,0.4293 0.4281,0.6350,0.4236 0.4541,0.6863,0.4412 MLP-1 0.5640,0.5625,0.5594 0.4679,0.4809,0.4614 0.4596,0.4761,0.4451 0.4646,0.4684,0.4592 MLP-2 0.6108,0.5567,0.5693 0.4687,0.4805,0.4638 0.4378,0.4359,0.4308 0.4605,0.4472,0.4504 MLP-3 0.5739,0.5873,0.5719 0.4989,0.4916,0.4902 0.4848,0.4683,0.4718 0.4597,0.4537,0.4364 SBM-1 0.5710,0.6162,0.5812 0.5718,0.5230,0.5162 0.5692,0.5075,0.5134 0.5763,0.5343,0.4896 SBM-2 0.5383,0.5981,0.5509 0.4630,0.6396,0.4880 0.4802,0.6211,0.4997 0.5070,0.6457,0.5256 SBM-3 0.5284,0.6085,0.5526 0.5154,0.5426,0.5035 0.5089,0.6331,0.5236 0.5271,0.5631,0.5184 SIMDA-1 0.5558,0.5668,0.5560 0.4761,0.5704,0.5046 0.4878,0.6562,0.5085 0.4738,0.6539,0.4698 SIMDA-2 0.5605,0.6556,0.5863 0.4932,0.6186,0.5290 0.4935,0.5289,0.4991 0.5627,0.6390,0.5868
SIMDA-3 0.5979,0.6364,0.6002 0.5633,0.5776,0.5431 0.5256,0.5851,0.5300 0.5138,0.6310,0.5425
None PM 2.5 PM 10 PM 2.5&PM 10
(a) Primary Pollutant Distribution Predicted by SBM Beijing
Shanghai
Guangzhou
Shenzhen Hangzhou
Harbin
Chengdu
Nanjing Xian
Lhasa
Beijing
Shanghai
Guangzhou
Shenzhen Hangzhou
Harbin
Chengdu
Nanjing Xian
Lhasa
Beijing
Shanghai
Guangzhou
Shenzhen Hangzhou
Harbin
Chengdu
Nanjing Xian
Lhasa
Beijing
Shanghai
Guangzhou
Shenzhen Hangzhou
Harbin
Chengdu
Nanjing Xian
Lhasa
None PM 2.5 PM 10 PM 2.5&PM 10
None PM 2.5 PM 10 PM 2.5&PM 10
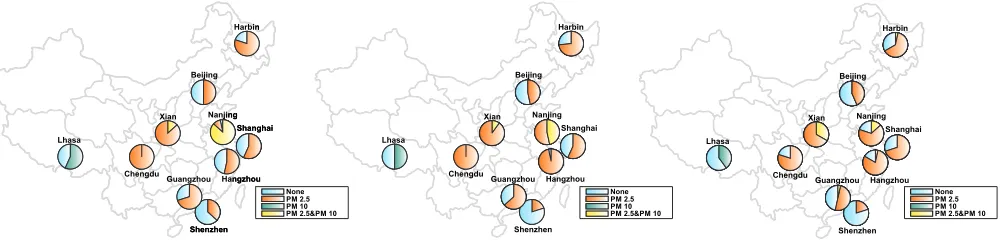
(b) Primary Pollutant Distribution Predicted by SIMDA (c)The Ground Truth Primary Pollutant Distribution
200 400 600 800 1000 1200
D (Input dimensions)
0 5 10 15 20 25 30
Runtime (sec)
Runtime comparison of SIMDA-SR and SIMDA-3
SIMDA-SR SIMDA-3
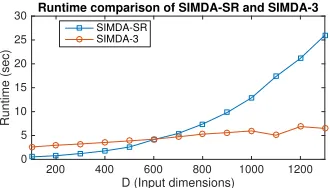
Figure 5: Runtime comparison of SIMDA-SR and SIMDA-3
Civil Unrest dataset on the left clearly show that the SIMDA model achieves the best ROC curve, with an AUC score of 0.81. This is also the case for the China air pollution dataset, where the SIMDA model again achieves the highest AUC score of 0.80. This further demonstrates the effectiveness and overall prediction power of the proposed SIMDA model.
Scalability
Figure 5 compares the run time of SIMDA-SR with soft-max regression and SIMDA-3 with three hidden layers in its neural network architecture on one step of the ADMM iteration. The run time for SIMDA-SR increases quadrat-ically with the number of input dimensions, starting from only 0.5 second with 100 dimensions and rising to around 26 seconds with 1300 dimensions. On the other hand, the run time for the 3 hidden layer SIMDA increases linearly start-ing from 2.6 seconds for 100 dimensions and then climbstart-ing to 6 seconds with 1300 input dimensions, when the number of neurons of the the hidden layers remain unchanged. This demonstrates that the generalized SIMDA framework enjoys better scalability in terms of time complexity when dealing with high dimensional complex real world data.
The Effect of Subtype Pattern Regularization
This section validates the effectiveness of the deep regu-larization term regarding the event subtype patterns in the SIMDA model. Looking at the China air pollution event forecasting dataset, Figure 4 compares the pollutant sub-type patterns in terms of the class distribution predicted by the baseline SBM (i.e., without regularization) and SIMDA (i.e. with regularization), with Figure 4 (a) and (b), respec-tively, showing the models’ predicted event subtype distri-butions for each task (city) in China. Figure 4(c) shows the ground truth distribution for the same period. Overall, Figure 4(b) shows a better fit for the subtype distribution among the different cities than Figure 4(a). This indicates that with the help of the spatial regularization term, SIMDA was able to learn a better class distribution even when the event subtypes are imbalanced and incomplete. For instance, for the city Nanjing, with no spatial regularization, SBM over-fits the training data severely and forecasts the future subtype as predominantly “PM2.5&PM10” which diverges significantly from the ground truth distribution. In contrast, SIMDA not only learns from task specific training data, but also regularizes the model by sharing adjacent tasks’ event subtype probability ratios. Consequently, the SIMDA model
over-fits less on subtype “PM2.5&PM10” and successfully forests “PM2.5” as the majority subtype during the test pe-riod, which is a closer fit to the ground truth distribution shown in Figure 4(c).
Conclusions
Beyond merely predicting the occurrence of future events, effective forecasting of event subtypes provides valuable in-formation to practitioners and enables them to allocate ap-propriate amounts and types of resources to manage and ameliorate social risks. To achieve this objective, this paper proposes a novel Spatial Incomplete Multi-task Deep leArn-ing (SIMDA) framework that characterizes spatial hetero-geneity, task label incompleteness, and event subtype pattern correlations. An efficient algorithm is proposed to handle this non-convex and strongly coupled model objective. Ex-tensive experiments on six real-world datasets demonstrate that the proposed model outperforms other baseline methods in multiple application domains.
References
Achrekar, H.; Gandhe, A.; Lazarus, R.; Yu, S.-H.; and Liu, B. 2011. Predicting flu trends using twitter data. In INFO-COM WKSHPS, 702–707. IEEE.
Ando, R. K., and Zhang, T. 2005. A framework for learning predictive structures from multiple tasks and unlabeled data. Journal of Machine Learning Research6(Nov):1817–1853. Bellman, R. 2013. Dynamic programming. Courier Corpo-ration.
Boyd, S.; Parikh, N.; Chu, E.; Peleato, B.; and Eckstein, J. 2011. Distributed optimization and statistical learning via the alternating direction method of multipliers.Foundations and TrendsR in Machine Learning3(1):1–122.
Caruana, R. 1998. Multitask learning. InLearning to learn. Springer. 95–133.
Caruna, R. 1993. Multitask learning: A knowledge-based source of inductive bias. InMachine Learning: Proceedings of the Tenth International Conference, 41–48.
Chen, Z.; Xie, Y.; Cheng, Y.; Zhang, K.; Agrawal, A.; Liao, W.-k.; Samatova, N. F.; and Choudhary, A. N. 2013. Forecast oriented classification of spatio-temporal extreme events. InIJCAI, 2952–2954.
Cressie, N. 2015. Statistics for spatial data. John Wiley & Sons.
Duong, L.; Cohn, T.; Bird, S.; and Cook, P. 2015. Low re-source dependency parsing: Cross-lingual parameter sharing in a neural network parser. InACL 2015 (Volume 2: Short Papers), volume 2, 845–850.
Evgeniou, T., and Pontil, M. 2004. Regularized multi–task learning. InKDD 2004, 109–117. ACM.
Haasdonk, B., and Bahlmann, C. 2004. Learning with dis-tance substitution kernels. InJoint Pattern Recognition Sym-posium, 220–227. Springer.
Hornik, K. 1991. Approximation capabilities of multilayer feedforward networks.Neural networks4(2):251–257.
Hsu, C.-W., and Lin, C.-J. 2002. A comparison of methods for multiclass support vector machines. IEEE transactions on Neural Networks13(2):415–425.
Khezerlou, A. V.; Zhou, X.; Li, L.; Shafiq, Z.; Liu, A. X.; and Zhang, F. 2017. A traffic flow approach to early detection of gathering events: Comprehensive results.ACM Transactions on Intelligent Systems and Technology (TIST)8(6):74.
Kiaee, F.; Gagn´e, C.; and Abbasi, M. 2016. Alternating di-rection method of multipliers for sparse convolutional neural networks. arXiv preprint arXiv:1611.01590.
Misra, I.; Shrivastava, A.; Gupta, A.; and Hebert, M. 2016. Cross-stitch networks for multi-task learning. In CVPR 2016, 3994–4003.
Nasrabadi, N. M. 2007. Pattern recognition and machine learning.Journal of electronic imaging16(4):049901.
Ning, Y.; Muthiah, S.; Rangwala, H.; and Ramakrishnan, N. 2016. Modeling precursors for event forecasting via nested multi-instance learning. InKDD 2016, 1095–1104. ACM.
O’Connor, B.; Balasubramanyan, R.; Routledge, B. R.; and Smith, N. A. 2010. From tweets to polls: Linking text senti-ment to public opinion time series.ICWSM11(122-129):1– 2.
Rumelhart, D. E.; Hinton, G. E.; and Williams, R. J. 1985. Learning internal representations by error propaga-tion. Technical report, California Univ San Diego La Jolla Inst for Cognitive Science.
Sun, J.; Li, H.; Xu, Z.; et al. 2016. Deep admm-net for com-pressive sensing mri. In Advances in Neural Information Processing Systems, 10–18.
Thrun, S., and O’Sullivan, J. 1998. Clustering learning tasks and the selective cross-task transfer of knowledge. In Learn-ing to learn. SprLearn-inger. 235–257.
Vahedian, A.; Zhou, X.; Tong, L.; Li, Y.; and Luo, J. 2017. Forecasting gathering events through continuous destination prediction on big trajectory data. InProceedings of the 25th ACM SIGSPATIAL International Conference on Advances in Geographic Information Systems, 34. ACM.
Wang, J.; Gao, Y.; Z¨ufle, A.; Yang, J.; and Zhao, L. 2018. Incomplete label uncertainty estimation for petition victory prediction with dynamic features. In2018 IEEE Interna-tional Conference on Data Mining (ICDM), 537–546. IEEE.
Wu, L.; Yen, I. E.-H.; Xu, F.; Ravikuma, P.; and Witbrock, M. 2018. D2ke: From distance to kernel and embedding. arXiv preprint arXiv:1802.04956.
Xia, X.; Qi, Q.; Liang, H.; Zhang, A.; Jiang, L.; Ye, Y.; Liu, C.; and Huang, Y. 2016. Pattern of spatial distribu-tion and temporal variadistribu-tion of atmospheric pollutants during 2013 in shenzhen, china. ISPRS International Journal of Geo-Information6(1):2.
Xu, K.; Wu, L.; Wang, Z.; and Sheinin, V. 2018. Graph2seq: Graph to sequence learning with attention-based neural net-works. arXiv preprint arXiv:1804.00823.
Yang, Y., and Hospedales, T. 2016. Deep multi-task rep-resentation learning: A tensor factorisation approach. arXiv preprint arXiv:1605.06391.
Yuan, Z.; Zhou, X.; and Yang, T. 2018. Hetero-convlstm: A deep learning approach to traffic accident prediction on heterogeneous spatio-temporal data. In KDD 2018, 984– 992. ACM.
Zhao, L.; Chen, F.; Lu, C.-T.; and Ramakrishnan, N. 2015a. Spatiotemporal event forecasting in social media. InSDM 2015, 963–971. SIAM.