The Thirty-Third AAAI Conference on Artificial Intelligence (AAAI-19)
Spatiotemporal Multi-Graph
Convolution Network for Ride-Hailing Demand Forecasting
Xu Geng,
∗1Yaguang Li,
∗2Leye Wang,
1,3Lingyu Zhang,
4Qiang Yang,
1Jieping Ye,
4Yan Liu
2,41Hong Kong University of Science and Technology,2University of Southern California,3Peking University,4Didi AI Labs, Didi Chuxing
[email protected], [email protected], [email protected], [email protected], [email protected], [email protected], [email protected]
Abstract
Region-level demand forecasting is an essential task in ride-hailing services. Accurate ride-ride-hailing demand forecasting can guide vehicle dispatching, improve vehicle utilization, re-duce the wait-time, and mitigate traffic congestion. This task is challenging due to the complicated spatiotemporal depen-dencies among regions. Existing approaches mainly focus on modeling the Euclidean correlations among spatially adjacent regions while we observe that non-Euclidean pair-wise cor-relations among possibly distant regions are also critical for accurate forecasting. In this paper, we propose the spatiotem-poral multi-graph convolution network(ST-MGCN), a novel deep learning model for ride-hailing demand forecasting. We first encode the non-Euclidean pair-wise correlations among regions into multiple graphs and then explicitly model these correlations using multi-graph convolution. To utilize the global contextual information in modeling the temporal cor-relation, we further proposecontextual gated recurrent neu-ral networkwhich augments recurrent neural network with a contextual-aware gating mechanism to re-weights different historical observations. We evaluate the proposed model on two real-world large scale ride-hailing demand datasets and observe consistent improvement of more than 10% over state-of-the-art baselines.
Introduction
Spatiotemporal forecasting is a crucial task in urban com-puting. It has a wide range of applications from autonomous vehicles operations, to energy and smart grid optimization, to logistics and supply chain management. In this paper, we study one important task: region-level ride-hailing demand forecasting, which is one of the essential components of the intelligent transportation systems. The goal of region-level rihailing demand forecasting is to predict the future de-mand of regions in a city given historical observations. Ac-curate ride-hailing demand forecasting can help organize ve-hicle fleet, improve veve-hicle utilization, reduce the wait-time, and mitigate traffic congestion (Yao et al. 2018b). This task is challenging mainly due to the complex spatial and tem-poral correlations. On the one hand, complicated dependen-cies are observed among different regions. For example, the
∗
Equal contribution. Work done primarily while authors were interns at Didi AI Labs, Didi Chuxing.
Copyright c2019, Association for the Advancement of Artificial Intelligence (www.aaai.org). All rights reserved.
demand of a region is usually affected by its spatially ad-jacent neighbors and at the same time correlated with dis-tant regions with the similar contextual environment. On the other hand, non-linear dependencies also exist among differ-ent temporal observations. The prediction of a certain time is usually correlated with various historical observations, e.g., an hour ago, a day ago or even a week ago.
Highway 2
School Hospital
Factory
Amusement Park School
Hospital
Amusement Park
1 2
4
3
6
R14
Highway 1
R46
Park
Park
5
Lake
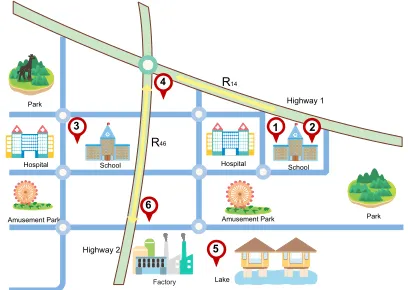
Figure 1: An example of different correlations among re-gions. To predict the demand in region1, spatially adjacent region 2, functionality similar region 3 and transportation connected region 4 are considered more important, while distant and irrelevant regions5are less relevant.
Recent advances in deep learning enable promising re-sults in modeling the complex spatiotemporal relationship in region-based spatiotemporal forecasting. With convolu-tional neural network and recurrent neural network, state-of-the-art results are achieved in (Shi et al. 2015; Yu et al. 2017; Shi et al. 2017; Zhang, Zheng, and Qi 2017; Zhang et al. 2018a; Ma et al. 2017; Yao et al. 2018b; 2018a). Despite promising results, we argue that two im-portant aspects are largely overlooked in modeling the spa-tiotemporal correlations. First, these methods mainly focus on modeling the Euclidean correlations among different re-gions, however, we observe that non-Euclidean pair-wise correlations are also critical for accurate forecasting. Fig-ure 1 shows an example. For region1, in addition to neigh-borhood region2, it may also correlate to a distant region
schools and hospitals. Besides, region1may also be affected by region 4, which is directly connected to region 1via a highway. Second, in these methods, when modeling tempo-ral correlation with RNN, each region is processed indepen-dently or only based on local information. However, we ar-gue that global and contextual information are also impor-tant. For example, a global increase/decrease in ride-hailing demand usually indicates the occurrence of some events that will affect future demand.
To address these challenges, we propose a novel deep learning model called spatiotemporal multi-graph convolu-tion network (ST-MGCN). In ST-MGCN, we propose to encode the non-Euclidean correlations among regions into multiple graphs. Different from (Yao et al. 2018b), which uses the graph embedding as extra constant features for each region, we leverage the graph convolution to explic-itly model the pair-wise relationship among regions. Graph convolution is able to aggregate neighborhood information when performing the prediction which is hard to achieve through traditional graph embedding. Furthermore, to in-corporate global contextual information when modeling the temporal correlation, we propose contextual gated recurrent neural network (CGRNN). It augments RNN by learning a gating mechanism, which is calculated based on the summa-rized global information, to re-weight observations in dif-ferent timestamps. When evaluated on two real-world large scale ride-hailing demand datasets, ST-MGCN consistently outperforms state-of-the-art baselines by a large margin. In summary, this paper makes the following contributions:
• We identify non-Euclidean correlations among regions in ride-hailing demand forecasting and propose to encode them using multiple graphs. Then we further leverage the proposed multi-graph convolution to explicitly model these correlations.
• We propose the Contextual Gated RNN (CGRNN) to in-corporate the global contextual information when model-ing the temporal dependencies.
• We conduct extensive experiments on two large-scale real-world datasets, and the proposed approach achieves more than 10% relative error reduction over state-of-the-art baseline methods for ride-hailing demand forecasting.
Related work
Spatiotemporal prediction in urban computing
Spatiotemporal prediction is a fundamental problem for data-driven urban management. There are rich amount of works on this topic, including predicting bike flows (Zhang, Zheng, and Qi 2017), the taxi demand (Ke et al. 2017b; Yao et al. 2018b), the arrival time (Li et al. 2018b), and the precipitation (Shi et al. 2015; 2017), where the prediction is aggregated in rectangular regions, and region-wise rela-tionship is modeled by geographical distance. More specif-ically, the spatial structure of urban data is formulated as a matrix whose entries represent rectangular regions. In pre-vious works, regions and their pair-wise relationships nat-urally formulate an Euclidean structure, and consequently convolution neural networks are leveraged for effective pre-diction.Non-Euclidean structured data also exists in urban com-puting. Usually, station or point based prediction tasks, like traffic prediction (Li et al. 2018c; Yu, Yin, and Zhu 2018; Yao et al. 2018a), point-based taxi demand prediction (Tong et al. 2017) and station-based bike flow prediction (Chai, Wang, and Yang 2018) are naturally non-Euclidean as the data format is no longer a matrix and convolution neural net-works becomes less helpful. Manual feature engineering or graph convolution networks are state-of-the-art techniques for handling non-Euclidean structure data. Different from previous works, ST-MGCN encodes pair-wise relationships among regions into semantic graphs. Though ST-MGCN is designed for region based prediction, the irregularity of region-wise relationship makes it a prediction problem for non-Euclidean data.
In (Yao et al. 2018b), the authors propose DMVST-Net which encodes the region-wise relationship as graph for taxi demand prediction. DMVST-Net mainly uses graph embed-ding as an external features for spatiotemporal prediction, and consequently fails to use the demand values from re-lated regions. In (Yao et al. 2018a), the authors further im-proves (Yao et al. 2018b) by modeling the periodically shift problem with the attention mechanism. However, none of these approaches explicitly models the non-Euclidean pair-wise relationships among regions. In this work, ST-MGCN uses the proposed multi-graph convolution to incorporate features from related regions, which is able to make pre-dictions from demand values of regions that are related in different perspective.
Recent research in neuroimage analysis for Parkinson’s disease (Zhang et al. 2018b) shows the effectiveness of graph convolution network in spatial feature extraction. It uses GCN to learn features from most similar regions and proposed a multi-view structure to fuse different MRI ac-quisitions. However, temporal dependency is not considered in above work. ST-GCN is used in spatiotemporal predic-tion for skeleton based acpredic-tion recognipredic-tion (Li et al. 2018a; Yan, Xiong, and Lin 2018).The transformation of ST-GCN is a combination of spatial dependency and local temporal recurrence. However, we argue in these models, the contex-tual information or the global information is largely over-looked in the temporal dependency modeling.
Graph convolution network
Graph convolution network (GCN) is defined over a graph
G = (V,A), where V is the set of all vertices and A ∈
R|V|×|V| is the adjacency matrix whose entries represent
the connections between vertices. GCN is able to extract lo-cal features with different reception fields from translation variant non-Euclidean structures (Hammond et al. 2011). LetL =I−D−1/2AD−1/2denotes the graph Laplacian matrix, whereDis the degree matrix, a graph convolution operation (Defferrard, Bresson, and Vandergheynst 2016) is defined as
Xl+1=σ(
K−1
X
k=0
αkLkXl)1 (1)
1
whereXl denotes the features in thel-th layer, αk is the
trainable coefficient, Lk is the k-th power of the graph
Laplacian matrix,σis the activation function.
Channel-wise attention
Channel-wise attention (Hu, Shen, and Sun 2018; Chen et al. 2017) is proposed in the computer vision literature. The intuition behind channel-wise attention is to learn a weight for each channel, in order to find the most important frames and emphasize them by giving higher weights. Let X ∈
RW×H×C denotes the input, where W andH are the
di-mensions of the input image, andCdenotes the number of channels, then the pipeline of channel-wise attention is de-fined as follows:
zc=Fpool(X:,:,c) =
1 W H
W
X
i=0 H
X
j=0
Xi,j,cforc= 1,2,· · ·C
s=σ(W2δ(W1z)) (2)
˜
X:,:,c=X:,:,c◦sc forc= 1,2,· · ·C
Fpoolis a global average pooling operation, which
summa-rizes each channel into a scalarzcwherecis the channel
in-dex. Then an attention operation is applied to generate adap-tive channel weightss by applying non-linear transforma-tions on the summarized vectorz, whereW1andW2is the
corresponding weights, δand σis the ReLU and sigmoid function respectively. After that, sis applied to the input via channel-wise dot product. Finally, the input channels are scaled based learned weights. In this work, we adopt the idea of channel-wise attention, and generalize it for temporal de-pendency modeling among a sequence of graphs.
Methodology
We formalize the learning problem of spatiotemporal ride-hailing demand forecasting and describe how to model the spatial and temporal dependencies using the proposed spa-tiotemporal multi-graph convolution network(ST-MGCN).
Region-level ride-hailing demand forecasting
We divide a city into equal-size grids, and each grid is de-fined as a regionv ∈ V, where V denotes the set of all disjoint regions in the city. Let X(t) represent the num-ber of orders in all regions at the t-th interval. Then the region-level ride-hailing demand forecastingproblem is for-mulated as a single step spatiotemporal prediction given in-put with a fixed temporal length, i.e., learning a functionf : R|V|×T →
R|V| that maps historical demands of all
regions to the demand in the next timestep.
[X(t−T+1),· · ·,X(t)]−−→f(·) X(t+1)
Framework overview The system architecture of the pro-posed model ST-MGCN is shown in Figure 2. We represent
operation for simplicity.
GCN GCN
GCN …
…
…
Contextual Gating
GCN
GCN
GCN Encode pair-wise
correlations between regions using multiple graphs
Aggregate different observations with Contextual Gated RNN
Capture spatial dependency with graph convolution on
multiple graphs
Generate prediction
Neighborhood
Func. similarity
Connectivity
RNN
RNN
RNN Contextual Gated RNN
Contextual Gating
Contextual Gating
Contextual Gated RNN
Contextual Gated RNN
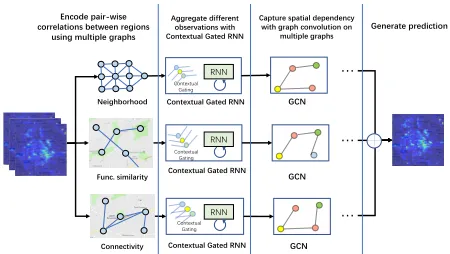
Figure 2: System architecture of the proposed spatiotempo-ral multi-graph convolution network (ST-MGCN). We en-code different aspects of relationships among regions, in-cluding neighborhood, functional similarity and transporta-tion connectivity, using multiple graphs. First, the proposed contextual gated recurrent neural network(CGRNN) is used to aggregate observations in different times considering the global contextual information. After that, multi-graph con-volution is used to model the non-Euclidean correlations among regions.
different aspects of correlations between regions as multi-ple graphs, whose vertices represent regions and edges en-code the pair-wise relationship among regions. First, we use the proposed Contextual Gated Recurrent Neural Network (CGRNN) to aggregate observations in different times con-sidering the global contextual information. After that, multi-graph convolution is applied to capture different types of correlations between regions. Finally, a fully connected neu-ral network is used to transform features into the prediction.
Spatial dependency modeling
In this section, we show how to encode different types of correlations among regions using multiple graphs and how to model these relationships using the proposed multi-graph convolution.
We model three types of correlations among regions with graphs, including (1) the neighborhood graph GN =
(V,AN), which encode the spatial proximity, (2) functional
similarity graphGF = (V,AF), which encodes the
similar-ity of surrounding Point of Interests (POIs) of regions, and (3) the transportation connectivity graph GT = (V,AT),
which encodes the connectivity between distant regions. Note that, our approach can be easily extended to model new types of correlations by constructing related graphs.
Neighborhood Neighborhood of a region is defined based on the spatial proximity. We construct the graph by connect-ing a region to its 8 adjacent regions in a3×3grid.
AN,ij=
1, viandvjare adjacent
0, otherwise (3)
this one in terms of functionality. Region functionality could be characterized using its surrounding POIs for each cate-gory, and the edge between two vertices (regions) is defined as the POI similarity:
AS,i,j=sim(Pvi, Pvj)∈[0,1] (4)
wherePvi, Pvj are the POI vectors of regionsviandvj re-spectively, whose dimension equals to the number of POI categories and each entry represents the number of a spe-cific POI category in the region.
Transportation connectivity The transportation system is also an important factor when performing spatiotemporal predictions. Intuitively, those geographically distant but con-veniently reachable regions can be correlated. These kinds of connectivity are induced by roads like motorway, high-way or public transportation like subhigh-way. Here, we define regions that are directly connected by these roads as “con-nected” and the corresponding edge is defined as:
AC,i,j=max(0,conn(vi, vj)−AN,i,j)∈ {0,1} (5)
where conn(u, v)is the indicator function of the connectiv-ity betweenviandvj. Note that, the neighborhood edges are
removed from connectivity graph to avoid redundant corre-lations and also results in a sparser graph.
Multi-graph convolution for spatial dependency model-ing With these graphs constructed, we propose the multi-graph convolution to model the spatial dependency as de-fined in Equation 6.
Xl+1=σ
G
A∈A
f(A;θi)XlWl
!
(6)
whereXl ∈ R|V|×Pl,X
l+1 ∈ R|V|×Pl+1 are the feature
vectors of|V|regions in layerlandl+ 1respectively.σ de-notes the activation function, andF
denotes the aggregation function, e.g., sum, max, average etc.Adenotes the set of
graphs, andf(A;θi)∈R|V|×|V|represents the aggregation
matrix of different samples based on graphA∈ A
param-eterized byθi, whileWl ∈ RPl×Pl+1 denotes the feature
transformation matrix, For example, iff(A;θi)is the
poly-nomial function of the Laplacian matrix L, then this will become ChebNet (Defferrard, Bresson, and Vandergheynst 2016) on multiple graphs. Iff(A;θi) =I, i.e., the identity
matrix, then this will fall back to the fully connected net-work.
In the implementation,f(A;θi)is chosen to be theK
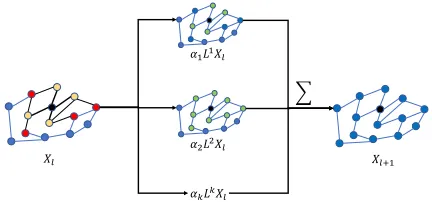
or-der polynomial function of the graph LaplacianL, and Fig-ure 3 shows an example of the value transformation for a centralized region through the graph convolution layer. Sup-pose all the entries in the adjacency matrix are 0 or 1, entry
Lk
ij 6= 0meansviis able to reachvjink-hop. In terms of
convolution operation,kdefines the size of reception field during spatial feature extraction. Using road connectivity graph GC = (V,AC)in Figure 1 to illustrate. In the
ad-jacency matrixAC, we have:
AC,1,4= 1;AC,1,6= 0;AC,4,6= 1,
𝛼"𝐿"𝑋%
𝑋%
𝛼&𝐿&𝑋%
𝛼'𝐿'𝑋%
(
𝑋%*"
Figure 3: An example of the ChebNet graph convolution centralized at the black vertex. Left: The centralized region is marked black. The one-hop neighbors are marked yellow, while the two-hop neighbors are marked red. Middle: with the increase of degree of the graph Laplacian, the reception field grows (marks green). Right: The output of this layer is a sum among graph transformations with degree value from 1 to K.
and the corresponding entries of the 1-degree graph Lapla-cian are:
L1C,1,46= 0;L1C,1,6= 0;L1C,4,66= 0
If the maximum degree of graph Laplacian K is set to 1, the transformed feature vector of region 1, i.e., Xl+1,1,:
will not contain the feature vector of region 6:Xl,6,:, since
L1
C,1,6= 0. When increasingKto 2, the corresponding
en-tryL2
C,1,6becomes non-zero, and consequentlyXl+1,1,:can
utilize information fromXl,6,:.
The multi-graph convolution based spatial dependency modeling is not restricted to these three types of region-wise relationships mentioned above, and it can be easily ex-tended to model other region-wise relationships as well as other spatiotemporal forecasting problems. It models spa-tial dependencies by feature extraction through region-wise relationship. With small reception field, the feature extrac-tion will focus on close regions, i.e., neighbors that can be reaches with small number of hops. Increasing the max de-gree of graph Laplacian or stacking multiple convolution layers will increase the reception field and consequently en-courage the model to capture more global dependencies.
Graph embedding is an alternative technique for mod-eling the region-wise correlation. In DMVST-Net (Yao et al. 2018b), the authors use graph embedding2 to represent
region-wise relationship, and then add these embeddings as extra features to each region. We argue that spatial de-pendency modeling approach in ST-MGCN is preferred for the following reasons: ST-MGCN encodes region-wise re-lationships into graphs and aggregate demand values from related regions by graph convolution. While in DMVST-Net, the region-wise relationship was embedded to a tem-poral invariant region-based feature as input to the model.
2
[𝑿𝒕, 𝑿(𝒕+𝟏), … ] ∈ ℝ𝑇× 𝑉 ×𝑃
Contextual Gating
T
RNN RNN . . . RNN
T
𝑠 ∈ ℝ𝑇
෩
𝑿𝒕, ෩𝑿𝒕+𝟏, … ∈ ℝ𝑇× 𝑉 ×𝑃
𝑧 ∈ ℝ𝑇×1×𝑃
Share-weight RNN
𝐹𝑝𝑜𝑜𝑙(𝐹𝐺𝐶𝐾
′
)
𝐹𝑝𝑜𝑜𝑙
𝑇reweighted observations are aggregated with RNN
𝑇observations
𝐹
𝑎𝑡𝑡
𝑛
𝑇reweighted observations
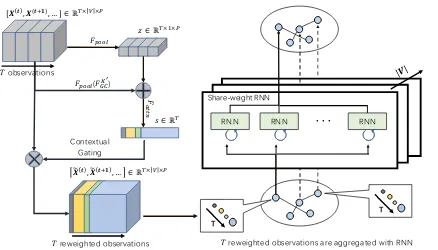
Figure 4: Temporal correlation modeling with contextual gated recurrent neural network (CGRNN). It first produces region descriptions using the global average pooling over the input and its graph convolution output for each observation. Then it transfer the summarized vectorzinto weights which are used to scale each observation. Finally, a shared RNN layer across all regions is applied to aggregate the gated in-put sequence of each region into a single vector.
Though DMVST-Net also captures the topological informa-tion, it is hard to aggregate demand values from related re-gions through the region-wise relationship. Also, invariant features have limited contribution to the model training.
Temporal correlation modeling
We propose the Contextual Gated Recurrent Neural Net-work(CGRNN) to model the correlations between observa-tions in different timestamps. CGRNN incorporates contex-tual information into the temporal modeling by augmenting RNN with a context aware gating mechanism whose archi-tecture is shown in Figure 4. Suppose, we haveT temporal observations andX(t) ∈
R|V|×P denotes thet-th
observa-tion, whereP is the feature dimensions,P will be 1 if the feature only contains the number of orders. Then the work-flow of contextual gating mechanism is as follows.
ˆ
X(t)= [X(t), FGK0(X(t))]fort= 1,2,· · ·T (7)
First, the contextual gating mechanism produces region de-scriptions by concatenating the historical data of a certain region with information from related regions. The tion from related regions is regarded as contextual informa-tion, and is extracted by a graph convolution operationFK0
G
with max degreeK0 (Equation 7) using the corresponding graph Laplacian matrix. The contextual gating mechanism is designed to involve information from related regions by performing graph convolution operation before the pooling step.
z(t)=Fpool( ˆX(t)) =
1
|V|
|V|
X
i=1
ˆ
Xi,:(t)fort= 1,2,· · ·T (8)
Secondly, we use the global average poolingFpoolover all
regions to produce the summary of each temporal observa-tion (Equaobserva-tion 8).
s=σ(W2δ(W1z)) (9)
Then an attention operation (Equation 9) is applied to the summarized vectorz, whereW1andW2is the
correspond-ing weights,δandσis the ReLU and sigmoid function re-spectively.
˜
X(t)=X(t)◦s(t) fort= 1,2,· · ·T (10)
Finally,sis applied to the scale each temporal observation (Equation 10).
Hi,:=RNN( ˜X
(1)
i,: ,· · ·,X˜
(T)
i,: ;W3)fori= 1,· · · ,|V|
(11) After the contextual gating, a shared RNN layer with weight
W3across all regions is applied to aggregate the gated input
sequence of a region into a single vectorHi,:(Equation 11).
The intuition of sharing RNN among regions is to find a universal aggregation rule for all regions, which encourages model generalization and reduces model complexity.
Experiments
In this section, we compare the proposed model ST-MGCN with other state-of-the-art baselines for region-level ride-hailing demand forecasting.
Dataset We conduct experiments on two real-world large scale ride-hailing datasets collected in cities: Beijingand
Shanghai. Both of these datasets are collected in the main city zone of ride-hailing orders within the time period from Mar 1st, 2017 to Dec 31st, 2017. For data split, we use the data from Mar 1st 2017 to Jul 31st 2017 for training, data from Aug 1st 2017 to Sep 30th 2017 as validation, and the data from Oct 1st 2017 to Dec 31st 2017 is used for testing. The POI data is collected in 2017, and contains 13 primary POI categories. Each region is associated with a POI vec-tor, whose entry is the number of instances of a certain POI category. The road network data used for transportation con-nectivity evaluation is provided by OpenStreetMap (Haklay and Weber 2008).
Experimental Settings
Recall that the learning task is formulated as learning a func-tionf :R|V|×T →
R|V|. In the experiment, we generate the
region set V by partitioning city map into grids with size equals to1km×1km3. There are totally 1296 regions in
Beijing, and 896 regions in Shanghai. Following the prac-tice in (Zhang, Zheng, and Qi 2017), the input of the net-work consists of 5 historical observations, including 3 lat-estclosenesscomponents, 1periodcomponent and 1 latest
trendcomponent. In building the transportation connectiv-ity graph, we consider the following high-speed roads, in-cluding motorway, highway and subway. Two regions are regarded as “connected” as long as there is a high-speed road directly connecting them.
In the experiment,f(A;θi)in Equation 6 is chosen to be
the Chebyshev polynomial functionl (Defferrard, Bresson, and Vandergheynst 2016) of the graph Laplacian with the degreeK equals to 2, andF
is chosen to be the sum ag-gregation function. The number of hidden layers is 3, with
3
Table 1: Performance comparison of different approaches for ride-hailing demand forecasting. ST-MGCN achieves the best performance with all metrics on both datasets.
Method Beijing Shanghai
RMSE MAPE(%) RMSE MAPE(%)
HA 16.14 23.9 17.15 34.8
LASSO 14.24±0.14 23.8±0.8 10.62±0.06 22.9±0.8 Ridge 14.24±0.11 23.8±0.9 10.61±0.04 23.1±0.8 VAR 13.32±0.17 22.4±1.6 10.54±0.18 23.7±1.4 STAR 13.16±0.22 22.2±1.9 10.52±0.21 23.2±1.4 GBM 13.66±0.16 23.1±1.5 10.25±0.11 23.4±1.2 STResNet 11.77±0.95 14.8±6.0 9.87±0.94 14.9±6.0
DMVST-Net 11.62±0.48 12.3±5.5 9.61±0.44 13.8±1.2
ST-GCN 11.62±0.36 10.1±5.1 9.29±0.31 11.2±1.3
ST-MGCN 10.78±0.25 8.8±3.5 8.30±0.16 9.3±0.9
64 hidden units each and an L2 regularization with a weight decay equal to 1e-4 is applied to each layer. Specially, the graph convolution degreeK0in CGRNN equals to 1.
We use ReLU as the activation in the graph convolution network. The learning rate of ST-MGCN is set to 2e-3, and early stopping on the validation dataset is used. All neural network based approaches are implemented using Tensor-flow (Abadi and others 2016), and trained using the Adam optimizer (Kingma and Ba 2015) for minimizing RMSE. The training of ST-MGCN takes 10GB RAM and 9GB GPU memory. The training process takes about 1.5 hour on a sin-gle Tesla P40.
Methods for evaluation We compare the proposed model (ST-MGCN) with the following methods for rihailing de-mand forecasting:
• Historical Average(HA): which models the ride-hailing demand as a seasonal process, and uses the average of previous seasons as the prediction. The period used is 1 week, and the prediction is based on aggregated data from the same time in previous weeks.
• LASSO, Ridge: which takes historical data from different timestamps as input for linear regression with L1 and L2 regularization respectively.
• Auto-regressive model(VAR,STAR): VAR is the multi-variate extension of auto-regressive model which is able to model the correlation between regions. STAR (Pace et al. 1998) is a an AR extension specifically for spatiotem-poral modeling problems. In the experiment, the number of lags used is 5.
• Gradient boosted machine (GBM): gradient boosting decision tree based regression implemented using Light-GBM (Ke et al. 2017a). The following setting is used in the experiment: the number of trees is 50, the maximum depth is 4 and the learning rate is 2e-3.
• ST-ResNet(Zhang, Zheng, and Qi 2017): ST-ResNet is a CNN-based framework for traffic flow prediction. The
model uses CNN with residual connections to capture the trend, the periodicity, and the closeness information.
• DMVST-Net(Yao et al. 2018b): DMVST-Net is a multi-view based deep learning approach for taxi demand pre-diction. It consists of three different views: the temporal view, the spatial view, and the semantic view modeled with LSTM, CNN and graph embedding respectively.
• DCRNN, ST-GCN: Both DCRNN (Li et al. 2018c) and ST-GCN (Yu, Yin, and Zhu 2018) are graph convolu-tion based models for traffic forecasting. Both models use road network for building non-euclidean region-wise relationship. DCRNN models the spatiotemporal depen-dency by integrating graph convolution into the gated re-current unit, while ST-GCN models the both the spatial and temporal dependencies with convolution structures and achieves better efficiency.
Performance comparison
For all approaches, we tune the model parameters using grid search based on the performance on the validation dataset, and report the performance on the testing dataset over multi-ple runs. We evaluate the performance of based on two popu-lar metrics, i.e., Root Mean Square Error (RMSE) and Mean Absolute Percentage Error (MAPE)4. Table 1 shows the test error comparison of different approaches for rihailing de-mand forecasting over of ten runs.
We observe the following phenomena in both datasets: (1) deep learning based methods, including ST-ResNet, DMVST-Net, ST-GCN and the proposed ST-MGCN, which are able to model the non-linear spatiotemporal dependen-cies, generally outperform other baselines; (2) ST-MGCN achieves the best performance regarding all the metrics on both datasets, outperforming the second best baseline by at least 10% in terms of relative error reduction, which suggests the effectiveness of proposed approaches for spa-tiotemporal correlations modeling; (3) compared with other deep learning models, ST-MGCN also shows lower vari-ance.
Effect of spatial dependency modeling
To investigate the effect of spatial and temporal dependency modeling, we evaluate the following variants of ST-MGCN by removing different components from the model, includ-ing: (1) the neighborhood graph, (2) the functional similarity graph, (3) the transportation connectivity graph. The result is shown in Table 2. Removing any graph component causes a significant error increase which justifies the importance of each type of relationship. These graphs encode the impor-tant prior knowledge, i.e., region-wise correlation, which is leveraged for more accurate forecasting.
To evaluate the effect of incorporating multiple region-wise relationships, we extend existing single graph-based models, including DCRNN (Li et al. 2018c) and ST-GCN (Yu, Yin, and Zhu 2018) with the multi-graph con-volution framework and the resulted models are DCRNN+
4
and GCN+. As shown in table 3, both DCRNN+ and ST-GCN+ achieve improved performance which shows the ef-fectiveness of incorporating multiple region-wise relation-ships.
Table 2: Effect of spatial correlation modeling on the Bei-jing dataset. Removing any component will result in a sta-tistically significant error increase.
Removed component RMSE
Neighborhood 11.47
Functional 11.42
Transportation 11.69
ST-MGCN 10.78
Table 3: Effect of adding multi-graph design to existing methodologies on the Beijing dataset. Adding extra graph to original model will result in a statistically significant error decrease.
Model RMSE
ST-GCN 11.62
ST-GCN+ 11.20
DCRNN 12.02
DCRNN+ 11.55
ST-MGCN 10.78
Effect of temporal dependency modeling
To further investigate the effect of temporal dependency modeling, we evaluate the following variants of ST-MGCN using different methods for temporal modeling, including (1) Average pooling: which aggregates different temporal observations using the average pooling, (2) RNN: which aggregates temporal observations using the recurrent neu-ral network (RNN) (3)CG: which uses contextual gating to re-weight different temporal observations but without RNN (4)GRNN: CGRNN without the graph convolution (Equa-tion 7). The results are shown in Table 4. We observe the following phenomena:
• Average pooling which blindly averages different obser-vations has the worst performance, while RNN which is able to do content dependent non-linear temporal aggre-gation achieves clearly improved results.
• CGRNN which augments RNN with contextual gating mechanism achieves further improved result than RNN. Besides, removing either the RNN (CG) or the graph con-volution operation (GRNN) results in clear worse perfor-mance which justify the effectiveness of each component.
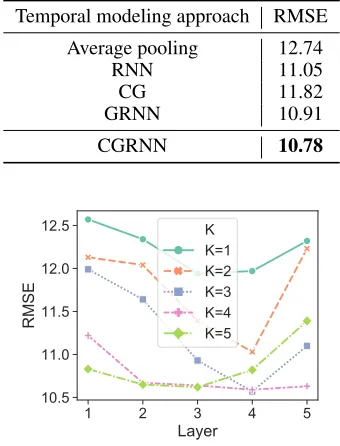
Effect of model parameters
To study the effects of different hyperparameters of the pro-posed model, we evaluate models on the Beijing by varying two of the most important hyperparameters, i.e., the degree
Table 4: Effect of temporal correlation modeling on the Bei-jing dataset
Temporal modeling approach RMSE
Average pooling 12.74
RNN 11.05
CG 11.82
GRNN 10.91
CGRNN 10.78
/D\HU
506(
. . . . . .
Figure 5: Effect of number of layers and the polynomial or-derKof the graph convolution on the Beijing dataset.
Kand number of layers in the graph convolution. Figure 5 shows the performance on test set. We observe that with the increase of number of layers, the error first decreases and then increases. While the error first decreases and then plateaus with the increase ofK. LargerKor the number of layers will enable the model capture more global correlation at the cost of increased model complexity and more prune to overfitting.
Conclusion and Future work
In this paper, we investigated the region-level ride-hailing demand forecasting problem and identified its unique spa-tiotemporal correlations. We proposed a novel deep learning based model which encoded the non-Euclidean correlations among regions using multiple graphs and explicitly captured them using multi-graph convolution. We further augmented the recurrent neural network with contextual gating mech-anism to incorporate global contextual information in the temporal modeling procedure. When evaluated on two large scale real-world ride-hailing demand datasets, the proposed approach achieved significantly better results than state-of-the-art baselines. For future work, we plan to investigate the following aspects (1) evaluate the proposed model on other spatiotemporal forecasting tasks; (2) extend the proposed approach for multiple step sequence forecasting.
Acknowledgement
Hong Kong CERG grants 16209715, 16244616. The re-search is supported by Didi Chuxing. Any opinions, find-ings, and conclusions or recommendations expressed in this material are those of the authors and do not necessarily re-flect the views of any of the sponsors such as NSF.
References
Abadi, M., et al. 2016. Tensorflow: Large-scale machine learning on heterogeneous distributed systems. In 12th USENIX Symposium on Operating Systems Design and Im-plementation (OSDI ’16).
Chai, D.; Wang, L.; and Yang, Q. 2018. Bike flow prediction with multi-graph convolutional networks.SIGSPATIAL. Chen, L.; Zhang, H.; Xiao, J.; Nie, L.; Shao, J.; Liu, W.; and Chua, T.-S. 2017. SCA-CNN: Spatial and channel-wise attention in convolutional networks for image caption-ing. InComputer Vision and Pattern Recognition (CVPR), 2017 IEEE Conference on, 6298–6306. IEEE.
Defferrard, M.; Bresson, X.; and Vandergheynst, P. 2016. Convolutional neural networks on graphs with fast localized spectral filtering. InAdvances in Neural Information Pro-cessing Systems, 3844–3852.
Haklay, M., and Weber, P. 2008. Openstreetmap: User-generated street maps. IEEE Pervasive Computing7(4):12– 18.
Hammond, D. K.; Vandergheynst, P.; Gribonval, R.; Ham-mond, D. K.; Vandergheynst, P.; and Gribonval, R. 2011. Wavelets on graphs via spectral graph theory. 30(2):129– 150.
Hu, J.; Shen, L.; and Sun, G. 2018. Squeeze-and-excitation networks. In Computer Vision and Pattern Recognition (CVPR), 2018 IEEE Conference on. IEEE.
Ke, G.; Meng, Q.; Finley, T.; Wang, T.; Chen, W.; Ma, W.; Ye, Q.; and Liu, T.-Y. 2017a. Lightgbm: A highly efficient gradient boosting decision tree. InAdvances in Neural In-formation Processing Systems, 3149–3157.
Ke, J.; Zheng, H.; Yang, H.; and Chen, X. M. 2017b. Short-term forecasting of passenger demand under on-demand ride services: A spatio-temporal deep learning approach. Trans-portation Research Part C: Emerging Technologies85:591– 608.
Kingma, D. P., and Ba, J. 2015. Adam: A method for stochastic optimization. In International Conference on Learning Representations (ICLR ’14).
Li, C.; Cui, Z.; Zheng, W.; Xu, C.; and Yang, J. 2018a. Spatio-temporal graph convolution for skeleton based action recognition. In2018 AAAI Conference on Artificial Intelli-gence (AAAI’18).
Li, Y.; Fu, K.; Wang, Z.; Shahabi, C.; Ye, J.; and Liu, Y. 2018b. Multi-task representation learning for travel time es-timation. In International Conference on Knowledge Dis-covery and Data Mining (KDD ’18).
Li, Y.; Yu, R.; Shahabi, C.; and Liu, Y. 2018c. Diffusion convolutional recurrent neural network: Data-driven traffic forecasting. InInternational Conference on Learning Rep-resentations (ICLR ’18).
Ma, X.; Dai, Z.; He, Z.; Ma, J.; Wang, Y.; and Wang, Y. 2017. Learning traffic as images: a deep convolutional neu-ral network for large-scale transportation network speed pre-diction. Sensors17(4):818.
Pace, R. K.; Barry, R.; Clapp, J. M.; and Rodriquez, M. 1998. Spatiotemporal autoregressive models of neighbor-hood effects. The Journal of Real Estate Finance and Eco-nomics17(1):15–33.
Shi, X.; Chen, Z.; Wang, H.; Yeung, D.-Y.; Wong, W.-K.; and Woo, W.-c. 2015. Convolutional lstm network: A ma-chine learning approach for precipitation nowcasting. In Ad-vances in neural information processing systems, 802–810. Shi, X.; Gao, Z.; Lausen, L.; Wang, H.; Yeung, D.-Y.; Wong, W.-k.; and Woo, W.-c. 2017. Deep learning for precipitation nowcasting: A benchmark and a new model. InAdvances in Neural Information Processing Systems, 5617–5627. Tong, Y.; Chen, Y.; Zhou, Z.; Chen, L.; Wang, J.; Yang, Q.; Ye, J.; and Lv, W. 2017. The simpler the better: a unified approach to predicting original taxi demands based on large-scale online platforms. In Proceedings of the 23rd ACM SIGKDD International Conference on Knowledge Discov-ery and Data Mining, 1653–1662. ACM.
Yan, S.; Xiong, Y.; and Lin, D. 2018. Spatial temporal graph convolutional networks for skeleton-based action recogni-tion. In 2018 AAAI Conference on Artificial Intelligence (AAAI’18).
Yao, H.; Tang, X.; Wei, H.; Zheng, G.; Yu, Y.; and Li, Z. 2018a. Modeling spatial-temporal dynamics for traffic pre-diction. arXiv preprint arXiv:1803.01254.
Yao, H.; Wu, F.; Ke, J.; Tang, X.; Jia, Y.; Lu, S.; Gong, P.; Ye, J.; and Li, Z. 2018b. Deep multi-view spatial-temporal network for taxi demand prediction. In2018 AAAI Confer-ence on Artificial IntelligConfer-ence (AAAI’18).
Yu, R.; Li, Y.; Shahabi, C.; Demiryurek, U.; and Liu, Y. 2017. Deep learning: A generic approach for extreme con-dition traffic forecasting. InSIAM International Conference on Data Mining (SDM).
Yu, B.; Yin, H.; and Zhu, Z. 2018. Spatio-temporal graph convolutional networks: A deep learning framework for traf-fic forecasting. InIJCAI’18).
Zhang, J.; Zheng, Y.; Qi, D.; Li, R.; Yi, X.; and Li, T. 2018a. Predicting citywide crowd flows using deep spatio-temporal residual networks. Artificial Intelligence259:147–166. Zhang, X.; He, L.; Chen, K.; Luo, Y.; Zhou, J.; and Wang, F. 2018b. Multi-view graph convolutional network and its applications on neuroimage analysis for parkinson’s disease. arXiv preprint arXiv:1805.08801.