doi: 10.11648/j.ijefm.20140206.18
ISSN: 2326-9553 (Print); ISSN: 2326-9561 (Online)
Testing the foreign exchange parity relations: A case
analysis of UK Sterling, Japanese yen and Us Dollar
Ibrahim Zubairu
Department of Accountancy Studies, School of Business, Accra Polytechnic, Accra, Ghana
Email address:
To cite this article:
Ibrahim Zubairu. Testing the Foreign Exchange Parity Relations: A Case Analysis of UK Sterling, Japanese Yen and Us Dollar. International Journal of Economics, Finance and Management Sciences. Vol. 2, No. 6, 2014, pp. 356-361. doi: 10.11648/j.ijefm.20140206.18
Abstract:
Since the financial globalization has expanded and developed increasingly fast in recent years, the international parity relationships have been extensively studied due to their importance in international trade and investment. This paper investigates purchasing power parity (PPP), interest rate parity (IRP) and unbiased expectation hypothesis by analyzing three main currencies; UK sterling, Japanese Yen and US dollar during 2008 to 2010. Further, forward premium or discount is calculated and interpret in the study with time series data and ordinary least square (OLS) regression methodologies. It was found that, the unbiased expectation hypothesis and international interest parity holds for Japan-US case but does not hold for Japan-UK case. Finally, the purchasing Power Parity (PPP) holds for both two cases, which is varies with most previous literature.Keywords:
Purchasing Power Parity (PPP), Interest Rate Parity (IRP), USD, GBP, JYP, Forward Premium or Discount, Unbiased Expectation Hypothesis1. Introduction
As the development of international trade and investment, the relationships among interest rate, exchange rate and inflation rate in various countries have drawn great attention from researchers. More specifically, relative purchasing power parity (PPP), covered interest rate parity (CIP), and unbiased expectation relation are main basic international relationships which are widely investigated by authors. According to relation PPP, the exchange rate between two countries adjusts to offset differences in inflation rates, which requires the exchange rate be proportional to the ratio of two price indices. As international Fisher relation states, the interest rate differential between two countries should equal to the expected inflation differential. Therefore, the expected currency depreciation should be offset by interest rate differential between two nations, which is called CIP. In addition, foreign exchange unbiased expectation hypothesis demonstrates that the forward rate is an unbiased predictor of the expected future spot rate. Some of the previous literatures support the foreign exchange parity relationships whereas some violations have been detected, Lothian and Wu (2005). However, it is also argued that short term puzzles are common while the parity relations hold in the long run.
As in major economies all over the world, whether the international parity relations hold in currencies such as the UK sterling, Japanese Yen and US dollar is analysed in this study. In recent time, United Kingdom has experienced a stable growth in economics as inflation rates and unemployment have been in relative low levels. As the official currency, pound sterling is one of the most traded currencies in the market of foreign exchange and the most held reserve currencies in global reserves. The economy of Japan has been in the long run stagnation since the bubble in 1990s. The stock and housing market collapsed and the unemployment rate increased since large quantities of corporations broke down. The Japanese Yen is the official currency of Japan, which is one of the extensively used reserve currencies in the world. Since the global financial downturn in 2008, Japanese Yen has been increasing in value relative to other major currencies. As the largest economy in the world, the United States plays an important role in international trade which is second largest exporter and largest importer. The US dollar is the most widely used in transactions across borders and official currencies for several countries. The United States dollar is also the dominant reserve currency in the world.
parity and unbiased expectation hypothesis. The forward premium or discount is also derived and analysed in the paper. The data set consists of quarterly data of three main currencies during the three-year period from 2008 to 2010. The OLS regressions are employed to investigate the hypothesised questions as described in the methodology. The remainder of the paper is organized as follows: section two introduces the methodologies employed in this paper, which specifies the regressions and states the hypothesis. Section three provides a detailed description of data set with the summary of statistics and time-series plot. Results are analysed in this section with some comparisons to previous literatures. The final section is the conclusion of the paper with limitations and implications for further studies.
2. Methodologies
This section gives a detailed exposition of methods of testing international parity conditions employed in the paper. OLS regressions are employed to investigate the rational expectation theory of forward market, interest rate parity relations and PPP. First of all, an OLS regression was constructed to test whether the forward rate is an unbiased estimator of the spot rate, which is shown in Equation (1).
( ) − ( ) = + ( ( ) − ( )) + (1)
where and denote the spot rate and forward rate in time t respectively in direct quotes; is the intercept; ( ) −
( ) measures the forward premium or discount; is the coefficient; is the error term. The null hypothesis is
= 0 and =1 which suggests that the expected change in spot rate in left hand side equals the forward premium or discount in left hand side. In other words, the forward rate in time t is an unbiased estimator of the expected future spot rate in time t+1. As stated by Lothian and Wu (2005), the realized future spot rate is used to measure the expected spot rate
E ( ) for convenience and feasibility. This method has been extensively used by previous studies such as Fama (1984) and Froot and Frankel (1989). By contrast, error correction model has been employed by Joseph (1995) to investigate the unbiased expectation hypothesis in forward market.
A collective of OLS regressions has been constructed to test interest rate parity conditions. (See, Equation (2) – (3))
( ) − ( ) = + ∗ − + (2)
( ) − ( ) = + ∗ − + (3)
Where; , and denote interest rate of Japan, United States and United Kingdom respectively. If covered interest rate parity holds, = 0 and =1; = 0 and =1. Therefore two sides are in equality which implies that the forward premium or discount is not significantly different from the interest rate differential between two nations. The use of OLS regressions is consistent with most previous studies such as Cosander and Laing (1981) and Thornton (1989). Nevertheless, some other methodologies such as EGARCH and VAR have also been employed to test whether
the interest rate parity holds. (See, for example, Raymond (2001); Baig and Goldfajn (2002))
In order to investigate whether the purchasing power parity (PPP) holds, another series of OLS regressions has been constructed as Equation (4)-(5) show.
( , ) − ( ) = + ∗ − + (4)
( , ) − ( ) = + ∗ − + (5)
Where; , , denote the inflation rates of Japan, UK and US respectively. The left hand side represents the expected change in spot rate and − , − on the right hand side represents the expected inflation differential between two countries. If the hypothesis = 0 and =1 holds for each regression, PPP holds which suggests the relative expected change in spot rate will adjust to offset differential in inflation rates between nations.
3. Data Descriptions
Figure 1. Interest rates of Japan, UK and US
Quarterly data of the spot exchange rate, forward rate, interest rate and inflation rate of three main currencies namely Japanese Yen, British sterling and US dollar is included in the data set of this paper. Each time series ranges over the three year period from the first quarter of 2008 to the last quarter of 2010. The time series data is sourced from the DataStream. First of all, Tokyo interbank offered rate (TIBOR), London interbank offered rate (LIBOR) and New York interbank offered rate (NYBOR) are chosen to represent interest rates for Japan, UK and US respectively. The interbank offered rate refers to the average interest rate at which major banks in the capital city lending to each other, which is a widely used financial benchmark all over the world. The prevailing conditions in the unsecured call market could be largely reflected by the interbank offered rates. Second, the percentage of expected change in spot rate has been calculated as ( ) − ( ) which is the difference in the logarithm of successive spot rates; the forward premium has been derived as ( ) − ( ) which is the difference between forward rate and spot rate in the form of logarithm. Further, after taking the logarithm of the data, the series is stationary in most cases. Additionally, adopting natural log form of variable series could to some extent reduce the existence of heteroskedasticity. Third, quarterly data which is
.00 .01 .02 .03 .04 .05 .06 .07
1 2 3 4 5 6 7 8 9 10 11 12
not often used in previous studies was employed. Other authors often use the frequency of monthly or annually. (See, for example, Joseph (1995); Lothian and Wu (2005); MacDonald (1988))
The time series plots of quarterly interest rates in three countries are presented in Figure 1, including LIBOR, TIBOR and NYBOR.
It has been found that both the interbank offered rates in UK and US are fluctuated largely, whereas the Japanese interest rate is stable over the three year period. The overall trends of three interest rates are consistent downward because three countries suffer from the global financial downturn during 2008 to 2010. The Tokyo interbank offered rate is extremely low between zero and 1%. This is because the fact that Japanese government proposed the policy of low interest in order to stimulate the domestic economy. By contrast, the interest rate of UK experiences a much larger fluctuation over the three year sample period. It reaches its peak around 6% in the 4th quarter in 2008 and decreases dramatically to the lowest level around 1.5% in one year time. The British government stimulates the economic growth launches a policy of sustained decreasing interest rate in order to resist the contraction. More recently, it appears a recovery from the financial crisis for United Kingdom. Similarly, the quarterly New York interbank offered
rate (NYBOR) also experiences a decreasing trend during 2008 to 2010. NYBOR fluctuates heavily during the first sample year while it remains stable and extremely low afterward. The interest rate of US is near zero during the last two quarters of 2009 and first two quarters of 2010.
Statistics of the quarterly interest rates and inflation rates during 2008 to 2010 are presented in Table 1. Considering the data access and availability of all inputs, each series spans over the time interval between the first quarter of 2008 and the last quarter of 2010. It covers the global financial recession since 2008. The sample mean of interest rates for Japan, UK and US are 0.78%, 3.41% and 0.86% respectively; the sample mean of inflation rates for Japan, UK and US are 0.19%, 2.51% and 3.28% respectively. Moreover, the standard deviation of Japanese interest rate TIBOR is much smaller than the interest rate series for the other two nations which implies that the interest rate of Japan is much less fluctuated over the sample period. Further, the inflation rates for United States and for United Kingdom are skewed to right and the other data series are skewed to left according to the statistics of skewness. Additionally, according to the Kurtosis, none of the data series is normally distributed. More specifically, the interest rate of US is leptokurtic whereas others are platykurtic.
Table 1. Descriptive statistics of interest rates and inflation rates of three countries
RS RK RJ IS IJ IK
Sample period 2008-2010 2008-2010 2008-2010 2008-2010 2008-2010 2008-2010
Frequency Quarterly Quarterly Quarterly Quarterly Quarterly Quarterly
Sample size 12 12 12 12 12 12
Mean 0.0086 0.0341 0.0078 0.0328 0.0019 0.0251
Std. Dev. 0.0112 0.0217 0.0053 0.0135 0.0056 0.0063
Skewness 1.2831 0.2810 0.0017 -0.5266 0.3137 -0.1060
Kurtosis 3.4591 1.2032 -0.1527 1.7324 2.2595 1.5882
4. Analysis of Empirical Results
4.1. Unbiased Expectation Hypothesis and Forward Premium
According to the unbiased expectation hypothesis in forward market, the forward rate tends to be an unbiased prediction of the future spot rate. In order to investigate whether there is a forward premium or discount, a series of two OLS regression specifications of forward premium has been applied to the sample pairs of Japan-UK and Japan-US. The results of the regressions are summarized and presented in Table 2 and Table 3.
Table 2. Forward-Premium Regression of Japan and UK
Parameters Estimates Standard error t-statistics P-value
α -0.1120 0.0395 -2.8372*** 0.0176
β 0.3357 0.1645 2.0406** 0.0686
Observations: 12 R-squared: 29.3977% Adjusted R-squared: 22.3375%
Asterisks (**) indicates a rejection of the null hypothesis at the 5% level; (***) indicates a rejection of the null hypothesis at the 1% level.
Table 3. Forward-Premium Regression of Japan and US
Parameters Estimates Standard error t-statistics P-value
α -0.0013 0.0017 -0.7557 0.4673
β 0.9697 0.0355 27.3428*** 0.0000
Observations: 12 R-squared: 98.6801% Adjusted R-squared: 98.5481%
Asterisks (***) indicates a rejection of the null hypothesis at the 1% level.
The result of times series regression of Japan and UK could be specified as Equation (6) shows.
( ) − ( ) = −0.1120 + 0.3357 ( ( ) − ( )) (6)
(0.0395) (0.1645)
hypothesis =1 is calculated as Equation (7) shows.
%& = *+(''()()= ,.--./),. 01. = −4.0383 (7)
Where 4 is the calculated estimate for 1 for the case of Japan and UK; (4 ) is the standard error of the coefficient.
%& Here is −4.0383 which implies that there is strong evidence to reject the null hypothesis. Third, the R-squared and adjusted R-squared are 29.3977% and 22.3375% respectively indicating poor performance of the regression. Therefore the results reject the unbiased expectation hypothesis in forward market.
The result for the case of Japan and US is presented as Equation (8) shows and the calculation of t-statistics of testing
=1 is shown in Equation (9).
( ) − ( ) = −0.0013 + 0.9697 ( ( ) − ( )) (8)
(0.0017) (0.0355)
%& = *+(''7)7)= ,.808/),.,1.. = −0.6659 (9)
The t-statistics of is 0.0017 which smaller than critical values at conventional statistical levels indicating that there is no strong evidence to reject the null hypothesis = 0. Furthermore, the t-statistics of null hypothesis =1 is -0.6659 which implies that is not necessarily significantly different from 1. That is to say, the forward rate is an unbiased estimator for future spot rate. Moreover, the R-squared and adjusted R-squared show strong explanatory power of the model specification, which are both more than 98%.
There are enormous findings of prediction power of forward rate from previous researches investigating different pairs and sample periods. According to Fama (1984), the exchange change in spot rate is not same as the forward premium or discount, which is consistent with the findings of our Japan-US case. Further, the forward bias puzzle Fama (1984) found states that the relationship between the expected change in spot rate and forward premium is negative, which is inconsistent with this paper’s findings in both currency pairs of Japanese yen-UK sterling and Japanese yen-US dollar. Chinn & Meredith (2004) argues that the intercept is not significantly different from zero, which supports the results of regression testing Japanese yen and US dollar. Further, consistently with the findings of Japan-UK case, MacDonald (1988) also argues that the unbiased expectation hypothesis in forward market does not hold. Large quantities of previous studies provide the explanations of the weak prediction power of forward rate. Lothian and Wu (2005) claim that forward bias puzzle presents in shorter sample periods and smaller interest differentials. By contrast, McCallum (1994) argues that the market inefficiency and government intervention might be the drivers of the puzzle.
4.2. Interest Rate Parity (IRP)
This section describes and discusses findings of covered interest rate parity for the currency pairs of Japanese yen-UK sterling and Japanese yen-US dollar. Further, some
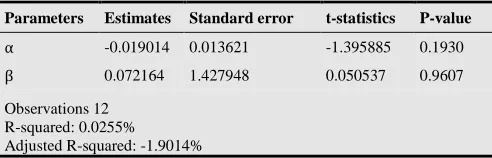
comparison and contrast with previous findings are included in this part. Table 4 and Table 5 summarize the regression results as follows.
Table 4. CIP Regression of Japan and UK
Parameters Estimates Standard error t-statistics P-value
α 4.649619 0.062684 4.971608*** 0.0006
β 0.311640 1.928538 2.410956*** 0.0366
Observations 12 R-squared: 36.760% Adjusted R-squared: 30.436%
Asterisks (***) indicates a rejection of the null hypothesis at the 1% level.
Table 5. CIP Regression of Japan and US
Parameters Estimates Standard error t-statistics P-value
α -0.019014 0.013621 -1.395885 0.1930
β 0.072164 1.427948 0.050537 0.9607
Observations 12 R-squared: 0.0255% Adjusted R-squared: -1.9014%
Reminding the null hypothesis of CIP = 0 and =1 suggesting forward premium or discount is not significantly differential from the interest rate differential. If CIP does not hold, the arbitrage opportunity tend to exist which might be exploited from international trade. First of all, the model performs well in the case of Japan and UK while poor in the case of Japan and US. Second, the intercept is significantly different from zero criticizing the CIP between Japan and UK while the intercept is close to zero between Japan and US. Third, the t-statistics of null hypothesis =1 are presented in Table 6. Both results for two currency pairs Japan-UK and Japan-US show that there is no strong evidence to reject CIP. Therefore, CIP holds for the case of Japan-US whereas it does not hold for the case of Japan-UK. By contrast, Roley (1987) also investigates CIP on Japanese yen and US dollar which concludes that the interest rate parity is rejected. Similarly, Husted and Kitchen (1985) confirms the rejection of CIP stating that planned capital controls in Japan might explain the puzzle of CIP. However, Lothian and Wu (2005) argue that CIP does not perform well. Fourth, the slope estimates for both cases are positive, which is in disagreement with most previous studies. (See, for example, Fama (1984))
Table 6. the t-statistics of =1
;<= ?@(=)=)>
Japan-UK -0.3569
Japan-US 0.6498
4.3. Purchasing Power Parity (PPP)
Table 7. PPP Regression of Japan and UK
Parameters Estimates Standard error t-statistics P-value
α -0.022812 0.033703 -0.676874 0.5138
β -0.099246 1.005115 -0.098741 0.9233
This section describes and discusses findings of purchasing power parity (PPP) for the currency pairs of Japanese yen-UK sterling and Japanese yen-US dollar. Remind the null hypothesis of PPP = 0 and =1 suggesting forward premium or discount equals the inflation rate differential. The results are summarized as follows with some literature review. Table 7 and Table 8 present the regression results and Table 9 presents the t-statistics for testing =1.
Table 8. PPP Regression of Japan and US
Parameters Estimates Standard error t-statistics P-value
α -0.161852 0.116632 -1.387713 0.1954
β -4.899405 4.893070 -1.001295 0.3403
Observations 12 R-squared: 9.1123%
Adjusted R-squared: -0.1619%
Table 9. The t-statistics of =1
;<= ?@(=)=)>
Japan-UK -1.0938
Japan-US 1.2056
The R-squared and adjusted R-squared show the poor explanatory power of both two model specifications. For instance, according to the R-squared of the PPP regression for Japan-UK, only 9.1123% of the variation in exogenous variables could be explained by the regression. Further, the t-statistics of α = 0 and =1 are -0.676874 and -1.0938 respectively for Japan-UK case; the t-statistics of α = 0 and =1 are -1.3877 and 1.2056 respectively for Japan-US case. It implies that there is no strong evidence to reject the hypothesis of PPP. This is in accordance with O’Connell (1998) which supports the purchasing power parity. On contrast, Rogoff (1996) argues that the forward premium or discount is not consistent with the inflation rate differential between nations.
5. Conclusions
This paper has investigated the purchasing power parity, interest rate parity and unbiased expectation hypothesis with the evidence from three main currencies namely Japanese yen, UK pound sterling and US dollar. In addition, it has also calculated and analysed the forward premium or discount. The main findings are summarized as follows. Firstly, the unbiased expectation hypothesis in forward market holds for the currency pair yen-dollar whereas it does not hold for the pair yen-sterling. That is to say, the forward rate is an efficient prediction for future spot rate of Japanese yen and US dollar, while it is a biased prediction for Japanese yen and UK pounds. Secondly, the covered interest rate parity condition is rejected for the case Japan-UK while it is supported for the case Japan-US. In other words, CIP holds for the currency pair yen-dollar suggesting the forward premium is consistent with the interest rate differential between Japan and US; CIP does not hold for the currency pair yen-sterling suggesting the forward premium is inconsistent with the interest rate differential between Japan and UK. Thirdly, purchasing
power parity relationship is applicable for both Japan-UK and Japan-US cases, which is not accordance with most previous literatures.
This paper has some limitations which could be revised in further studies. First of all, the results may not be reliable because the sample period of data is limited. The purchasing power parity and interest rate parity usually hold in the long run according to previous studies because the long run interest rate is more persistent than short-term rates and it materializes the adjustment of changes on currency movements. However, this paper only tests the relations with three year sample data. Second, the sample span only covers the financial crisis so that the findings could not be generalized. Further, the time interval between 2008 and 2010 is to some extent out-dated which could not capture the current financial and economic features. Third, further studies may employ data with high frequency such as monthly data which is more reliable according to Stivaktakis (2006). Fourth, the error terms may contain some incomplete information, thus the models might not be efficient. Fifth, since the data is time series data, it is of necessity to test whether the series are stationary first. Where the series has a unit root, then erroneous inferential problems tend to appear in the OLS estimates. However, notwithstanding these limitations this paper contributes to the debate of testing whether foreign exchange rate conditions holds for the three major currencies of the world.
References
[1] Baig, T. and Golfajn, I. (2002), ‘Monetary Policy in the Aftermath of Currency Crises: The Case of Asia’, Review of International Economics, vol. 10(1), pp.92-112.
[2] Chinn, M. D., & Meredith, G. (2004), ‘Monetary policy and long-horizon uncovered interest parity’, International Monetary Fund Staff Papers, vol.51, pp.409-430.
[3] Cosander, P. A., & Laing, B. R. (1981), ‘Interest Rate Parity Tests: Switzerland and Some Major Western Countries’, Journal of Banking and Finance, vol.5, pp.187-200.
[4] Lothian, J.R., & Wu L. (2005), ‘Uncovered Interest-Rate Parity over the Past Two Centuries’, Frank J. Petrilli Center for Research in International Finance CRIF Working Paper series.
[5] MacDonald, R. (1988), Floating exchange rates: Theories and evidence, Psychology Press.
[6] McCallum, B. T. (1994), ‘A reconsideration of the uncovered interest rate parity conditions’, Journal of Monetary Economics, vol.33, pp.105-132.
[7] Fama, E. F. (1984), ‘Forward and spot exchange rates’, Journal of Monetary Economics, vol.14, pp.319-338.
[8] Froot, K. A., & Frankel, J. A. (1989), ‘Forward Discount Bias: Is it an Exchange Risk Premium?’ , The Quarterly Journal of Economics, Vol.104, No. 1, pp.139-161.
[10] O’Connell, P. G. J. (1998), ‘The Overvaluation of Purchasing Power Parity’, Journal of International Economics.
[11] Raymond, W. S. (2001), ‘Price and Volatility Spillovers between Interest Rate and Exchange Value of the US Dollar’, Global Finance Journal, vol.12, pp.95-107.
[12] Rogoff, K. (1996), ‘The Purchasing Power Parity Puzzle’, Journal of Economic Literature.