AUT J. Civil Eng., 1(1) (2017) 45-54 DOI: 10.22060/ceej.2017.12347.5177
An Experimental and Numerical Study on the Effect of Loading Type and Specimen
Geometry on Mode-I Fracture Toughness of Rock
A. Fahimifar*, R. Heidari Moghadam
Department of Civil and Environmental Engineering, Amirkabir University of Technology, Tehran, Iran
ABSTRACT:As fracture toughness (KIC) is one of the most practical parameters in fracture mechanics
of rock, this article aims to investigate this parameter both experimentally and numerically. In the current
research, mode-I fracture toughness of a kind of limestone was investigated by performing Brazilian
disc, cylinder direct tension and under bending cubs. Through performing some tests on straight notched
Brazilian disc specimen (SNBD), the effect of specimen diameter and crack length on the rock mode-I fracture toughness was investigated. Moreover, in order to determine the effect of the loading type on
the mode I fracture toughness; two other tests were conducted on the cylinder direct tension specimens
and cubic specimens (DT and SENB). Then, the effect of the crack length and the specimen diameter on the rocks mode-I fracture toughness was investigated through conducting the statistical analysis of
variance (ANOVA) on the results obtained in DT and SNBD tests. In order to determine the required
parameters of DT and SNBD specimens for fracture toughness, finite-element software was used. The results showed that by increasing the diameter from 75 mm to 95 mm, for Brazilian disc specimens the average fracture toughness increases by 30%. Also it seems that factors such as the test and loading type
as well as the crack geometry can affect the fracture roughness parameter.
Review History:
Received: 4 January 2017 Revised: 13 May 2017
Accepted: 13 May 2017
Available Online: 15 May 2017
Keywords:
Mode-I fracture toughness SNBD, DT and SENB specimens Loading type
Statistical analysis of variance (ANOVA) Three-dimensional numerical modeling
1- Introduction
Fracture mechanics is a branch of solid mechanics that investigates the behavior of cracked objects when they are imposed to stress and strain fields. It is essential to pay attention to fracture mechanic science in most of the industries. Because of some reasons, cracks are propagated in most pieces available in a complex and the growth of these cracks can lead to the final fatigue of the piece. Therefore, the application domain of fracture mechanics is very extensive. Fracture toughness (K)1 is one of the most practical parameters
investigated in fracture mechanics of rock. Using fracture toughness of rock parameter in the rock tunnels stability issue is one of the most important applications of this parameter. Having this parameter in the hand, one can evaluate more properly the crack growth in rock masses around the tunnel. Moreover, the fracture toughness of rock is widely used in hydraulic fracturing of oil reservoirs discussion [1]. To express stress around the crack tip, the stress intensity factors are used due to the infinite amount of stress. The critical amount of stress intensity factor in mode I loading is called mode I fracture toughness which is a mechanical property of a material (KIC). By increasing applied loads to the cracked object, if the amount of stress intensity factor becomes larger than a critical amount of ‘KC’, it is supposed that the fracture has been begun. In this case, the crack growth continues provided that K ≥KC. The critical stress intensity factor (KC) is called fracture toughness and under specific conditions,
1 Fracture toughness
it can be considered as the matter property and it can be a correct measurement of material fracture toughness [2, 3]. Determination of fracture toughness of rocks has been performed with a wide range of different specimens and a variety of testing methods. However, it was observed that the obtained fracture toughness using these methods was unequal for the same rock. Factors such as the specimen size, non- isotropic rock, the size of fracture process area near the crack tip (the size of crack tip plasticity area), the rock micro and macro structure, rock storage conditions (e.g. humidity), etc., contribute to this difference [2-4].
For mode I fracture toughness testing, the single edge cracked round bar bend (SECRBB)2 was first used by Ouchterlony
(1981) [5]. Also, Khan et al. (2000) investigated the effect of testing method and specimen geometry such as diameter, thickness, crack length and the type on measured fracture toughness. For this purpose, straight edge cracked round bar bend (SECRBB), Semicircular disc specimens under three-point bending (SCB) and Brazilian disc specimens under diametrical compression were used [6]. Iqbal et al. (2006) selected three brittle rock types for their study and conducted more than 200 tests to measure the values of fracture toughness. In this investigation, the chevron bend (CB) test and cracked chevron notch Brazilian disc (CCNBD) test were used [2]. Moreover, Tutluoglu et al. (2011) conducted fracture toughness tests for different notch lengths, span lengths, thicknesses and diameters of the cylindrical rock specimens. They computed stress intensity factor by three-dimensional finite element modeling and the results were compared with those of well-known mode I fracture toughness testing
2 Single edge cracked round bar bend
method such as (SCB), (CCNBD) and straight notched disc bending (SNDB) [4].
Considering the proposed ambiguities, in the current research, firstly some tests were conducted on the straight notched bending disc (SNBD)1 specimen with different diameters
and crack lengths. Then, in order to compare the effects of loading type, some tests were conducted on (SENB) 2and
direct tension (DT)3 rock specimen, and the obtained results
from these three tests were compared. Following this, by conducting ultrasonic and uniaxial compressive strength tests, the given rock elastic parameters were calculated. Moreover, using finite element software Abaqus, SNBD and DT specimens were modeled in a three-dimensional way and the required parameters to determine the fracture toughness of SNBD and DT specimens were numerically calculated. Furthermore, in order to obtain the relation for DT model fracture toughness, some models were modeled in a dimensionless way in the software. Then, by conducting the analysis of variance (ANOVA) on the obtained results from SNBD tests, the effect of crack length and the specimen diameter on mode I fracture toughness were investigated, thus the most desirable geometry of the SNBD specimens can be predicted to determine mode I fracture toughness of rock. Finally, the obtained values of fracture toughness from SENB, DT and SNBD tests were compared to each other and consistency of fracture toughness values obtained from the above tests was investigated for different values of the crack length and the specimen diameter.
2- Governing Relations
Introducing the concept of stress intensity factor (K), Irwin presented the amount of stress at the crack tip for any desired type of problem (geometry, loading, and desired crack) as in equation (1): [7]
22 lim 2 12
0, 0
23 KI
KII r r
KIII σ π σ θ σ = → = (1) Where:
σij: The stresses near the tip of a crack (MPa) r: Radius (m)
KI, KII, KIII: Stress intensity factors corresponding to three movement modes of the crack surfaces (MPa.m0.5)
As shown in Figure 1, three basic loading modes for a crack include mode I in which crack surfaces slide against (separated from) each other in the direction perpendicular to the plane (opening mode), mode II, in which the crack surfaces slide on each other in the crack plane and along the crack (sliding mode), and mode III, in which the crack surfaces move relative to each other in the direction of normal vector of the crack plane (Tearing mode) [2, 7, 8].
The general form of the stress intensity factor relation is presented in equation (2) [7, 8]:
( )
K = f gσ πa (2)
Where:
F(g): A parameter which depends on the geometry of crack, specimen and loading conditions
1 Straight Notched Bending Disc 2 Single Edge Notched Beam 3 Direct Tension
a: The crack length for edge cracks or the half of the crack length for internal cracks (m)
σ: The applied stress to the specimen (MPa) 3- Experimental Study
In order to analyze fracture toughness values, a number of SNBD, DT, and SENB tests were conducted. To this end, the limestone was used. The texture of rock is almost identical and to determine elastic parameters, the standard uniaxial compressive strength and ultrasonic tests were performed. Table 1 presents rock mechanical properties.
3- 1- SNBD specimen
SNBD specimen was proposed by Chong and Kuruppu (1984) to determine mode I, mode II and the combined mode fracture toughness. In order to determine mode I fracture toughness, equation (3) was proposed by Atkinson et al., (1982) [6]:
.
I P a I
K N
RB π
= (3)
Where:
KI: Stress intensity factor in mode I (MPa.m0.5) R: Brazilian Disc radius (mm)
B: The specimen thickness (mm)
P: Compressive load at time of fracture (N)
NI: Dimensionless factor which depends on a/R a: Half the crack length (m)
In order to determine NI,, equation (4) was extracted by Shetty and Rosenfield (1985) through modifying numerical results obtained by Atkinson et al., (1982) [6].
2
3
0.99 0.141( / ) 0.863( / ) 0.886( / )
I
N a R a R
a R
= + + +
(4) Where:
a/R: Half the crack length to specimen radius ratio
As shown in Figure 2, in the current research, totally 40 SNBD specimens with diameters of 35, 55, 75, 95, 145 mm and crack length/specimen radius ratio (a/R) of 0.2, 0.3, 0.4 and 0.5 were prepared to investigate the effect of the specimen diameter and crack length on mode I fracture toughness. SNBD tests were conducted on the same specimens for two times and the average values were determined as the final results. Dimensions of SNBD specimens are presented in Table 2.
The previous studies show that the specimen thickness has no significant effect on the fracture toughness values [3, 4]. Therefore, a constant ratio of thickness to diameter was
Table 1. Rock mechanical properties Fig. 1. Basic fracture modes [2]
Rock Type σ (MPa) E (GPa) ρ (Ton/m3) v
(UCS)
used for all specimens. Moreover, a strain rate of 0.002 mm/s was used to test all specimens and the cracks with 1.1 mm thickness were created in SNBD specimens that were measured by caliper.
Measuring the fracture load, experimental results of the fracture toughness values for SNBD specimens are presented in “Table 3”:
3- 2- SENB specimen
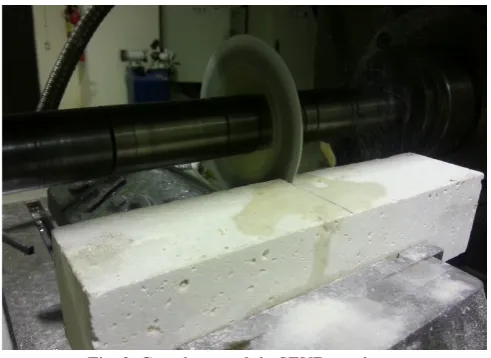
In SENB tests cubic specimens with standard dimensions were used according to Table 4. In these tests, four specimens with (a/W) ratio of 0.5 were prepared. As shown in Figure 3, a circular cutter with 0.8 mm thickness was used to create edge crack in SENB specimens.
In these tests, each specimen was placed on the simple supports and exposed to three-point bending load as shown in Figure 4. The crack position in these specimens can be
asymmetrical in relation to load application point. That is why a combined loading condition occurs during three point load application. Therefore, mode I and II can be created by changing the crack position. Loading begins after adjusting the distance of two supports opening and aligning the vertical direction of the above jaw with the crack direction. By adjusting the device loading rate on 0.002 mm/s , loading began and the output related to the load amount and movable jaw displacement were recorded each second by the data logger, and the maximum load which leads to the specimen fracture was considered as the fracture load. The crack growth in SENB specimen is shown in Figure 5. As is shown the crack has growth is aligned with the initial pre-crack.The fracture toughness in SENB test is calculated using equation (5): [9]
1 1.5
.
( )
. Q Q
P S a
K f
W BW
= (5)
Where:
P: Maximum load (N)
S: Loading opening (m)
B: Depth of the specimen (m)
W: Height of the specimen (m)
In equation (5), f (a/w) is the dimensionless parameter which can be calculated from equation (6): [9]
Fig. 2. specimens of Brazilian disc (SNBD)
Sample Number D (mm) t (mm) (a/R)
SNBD 8 35 13 0.2,0.3,0.4,0.5
SNBD 8 55 20 0.2,0.3,0.4,0.5
SNBD 8 75 28 0.2,0.3,0.4,0.5
SNBD 8 95 35 0.2,0.3,0.4,0.5
SNBD 8 145 53 0.2,0.3,0.4,0.5
Table 2. Dimensions of SNBD specimens
Diameter (mm) 0.2 0.3 (a/D) 0.4 0.5
35 0.6252 0.7805 0.7805 0.6662
55 0.4612 0.5336 0.5002 0.5899
75 0.4424 0.5937 0.4996 0.6083
95 0.6984 0.8355 0.6495 0.7959
145 0.7311 0.8976 0.8758 0.9251 Table 3. Average fracture toughness values for SNBD
specimens- K1c (MPa.m0.5)
Sample B (mm) L (mm) W (mm) S (mm)
SENB 50 225 50 200
Table 4. Average fracture toughness values for SNBD specimens- K1c (MPa.m0.5)
Fig. 3. Creation crack in SENB specimen
2
3/2
( ) 3 [1.99 (( / )
(1 ( / ))(2.15 3.95( / ) 2.7( / ) ))]
2(1 2( / ))(1 ( / ))
a a
f a W
W W
a W a W a W
a W a W
= −
− − +
+ −
(6)
Where:
(a/W): The ratio of crack length to the specimen height Experimental results of fracture toughness values for SENB specimens are presented in “Table 5”:
3- 3- Cylinder direct tension specimen DT
In order to perform direct tension tests on cylinder specimen, four jaws with diameters of 75, 55, 35, and 95 mm were designed and manufactured. Also, dimensions of DT specimens are presented in Table 6. Totally eight specimens were prepared with the crack length to specimen diameter ratio (a/D) of 0.5. After adjusting the loading machine for tension state, the manufactured jaws were installed on the device and specimens were glued to the jaws. By adjusting the device on loading rate of 0.002 mm/s, loading began and the output relevant to the load amount and jaw displacement for each second were recorded by the data logger, and the maximum load which leads to the specimen fracture was considered as the fracture load. As shown in Figure 6, the plane in which the crack grows is perpendicular to the loading direction.
4- Numerical modeling
4- 1- SNBD specimen modeling
In this section, in order to compare the experimental results
with those of finite element method, the Brazilian disc specimen was modeled in finite element software. Therefore, to determine the required elastic parameters of the program, the standard uniaxial compressive strength and ultrasonic tests were carried out. The results are presented in Table 1. 20 models with (a/R) ratio of 0.2, 0.3, 0.4, and 0.5 with diameters of 35, 55, 75, 95, and 145 mm similar to the geometry of tested specimens were prepared. In order to construct the three-dimensional model of SNBD specimens, instead of creating a gap with 1mm width, an internal crack with specified length of 2a and a zero degree angle to the vertical axis (pure mode I loading) was created. In all models, the circular mesh area around the crack tip was defined as the contour integral area. As shown in Figure 7, the mesh was created in Abaqus software as concentric circles with eight nodes cubic elements called C3D8R.
In light of the above-mentioned material, mode I stress intensity factors obtained by Brazilian disc test under fracture load were calculated for all 20 SNBD models using the J-integral method in Abaqus software and presented in Fig. 5. Loading and crack growth in SENB specimen
Sample Name Force (KN) (a/W) K(MPa.m0.5)
SENB1 1.2 0.5 0.993
SENB2 1.12 0.5 0.905
SENB3 1.11 0.5 0.904
SENB4 0.87 0.5 0.699
Table 5. Average fracture toughness values for SENB specimens
Sample Number D (mm) (a/R)
DT 2 35 0.5
DT 2 55 0.5
DT 2 75 0.5
DT 2 95 0.5
Table 6. Dimensions of DT specimens
Fig. 6. Fracture and crack growth in DT specimen
Table 7. (KI) values obtained by the software are less than 1 % different from those obtained by numerical relations for Brazilian discs referred in section (3.1).
4- 2- DT specimen modeling
Another modeling performed in this research is related to cylinder direct tension specimens. 27 models with a/R ratio of 0.4, 0.5 and 0.6 with diameters of 55, 75, and 95 mm and with
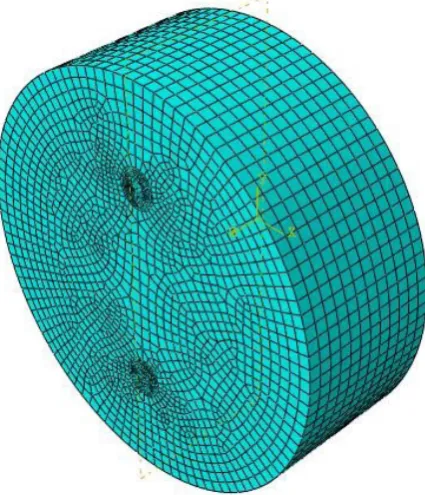
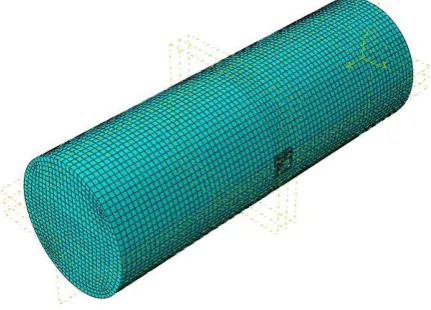
L/D ratio of 2.5, 3 and 3.5 similar to the geometry of tested specimens were prepared. In order to construct the three-dimensional model of DT specimens, instead of creating a gap with 1mm width by using seam method available in Abaqus software, an edge crack with specified length of (a) and zero degree angle to the vertical axis (pure mode I loading) was created. “Figure 8” shows the general pattern of created mesh for DT specimens modeling. In all models, the square mesh area around the crack tip was defined as the contour integral area. As shown in Figure 8, the mesh was created in Abaqus software [10] as concentric squares with eight nodes cubic elements called C3D8R.
Mode I stress intensity factors were calculated for all 27 DT models under the constant fracture loading of 2 N using J-integral method in Abaqus software and the results are presented in Table 8. Accordingly, mode I fracture toughness values for DT cylinder specimen do not depend on the specimen length or different ratios of L/D. This indicates that the crack growth area and the corresponding expansion of stresses are limited around the crack.
By considering the fracture toughness values obtained for DT specimens and using equation (2), the values of dimensionless shape factor (f (g)) were obtained. Then, as shown in Figure 9, regression analysis was performed using statistical analysis
software (SPSS).
Finally, the equation of dimensionless shape factor (f (g)) for cylinder direct tension specimens with the edge crack was converted to equation (7):
2
( ) 7.099 28.929( / ) 43.783( / )
f g = − a D + a D (7)
Where:
(a/D): The ratio of the crack length to the specimen diameter
4- 3- Crack growth simulation by XFEM1 method
In order to simulate the beginning and propagate the crack growth, XFEM method together with VCCT2 fracture
criteria in a two-dimensional state was used. The result for simulation of SNBD55-0.2 specimen was presented as the load curve vs. load-point-displacement in Figure 10. Using the numerical method, the fracture load of 5.2 KN obtained which in comparison to the fracture load of 5.72 KN obtained by testing; a difference of 10% is observed between two values. This difference may be due to the simplifying assumptions in modeling or the rock incomplete isotropic. It can be concluded that the elastic assumption for the tested
1 Extended Finite Element Method 2 Virtual Crack Closure Technique Diameter (mm) 0.2 0.3 (a/D) 0.4
0.5
35 0.623 0.787 0.786 0.701
55 0.472 0.533 0.512 0.512
75 0.435 0.596 0.503 0.613
95 0.7 0.834 0.659 0.784
145 0.737 0.914 0.882 0.931
Table 7. Fracture toughness values for SNBD specimens- K1c (MPa.m0.5)
Fig. 8. Elements of DT specimen
Sample
Name Force (N) (a/D) Diameter (mm) K (MPa.m0.5)
DT1 2 0.4 55 0.939
DT2 2 0.5 55 1.478
DT3 2 0.6 55 2.505
DT10 2 0.4 75 1.099
DT11 2 0.5 75 1.725
DT12 2 0.6 75 3.225
DT19 2 0.4 95 1.236
DT20 2 0.5 95 1.94
DT21 2 0.6 95 3.288
Table 8. Fracture toughness values for DT specimens
Fig. 9. Different functions obtained by fitting curves using
rock is acceptable. It is worth mentioning that, considering the loading conditions and the geometry of SNBD specimens, the assumption of plain strain is valid. This assumption has been used to manufacture the two-dimensional models.
5- Analyzing Experimental and numerical results
In this section of the research, the fracture toughness values were analyzed. For this purpose, mode I fracture toughness changes were compared to factors such as the test or loading type, dimensions or the crack length of the specimens. It should be noted that in order to cancel the effect of loading rate factor, all loadings were applied with the same loading rate. As the primary results, some of the load-displacement graphs for SNBD, DT and SENB specimens are presented in Figure 11.
5- 1- The effect of crack length on mode I fracture toughness
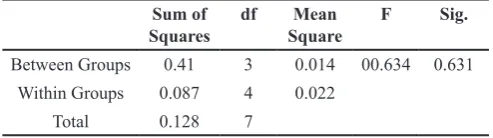
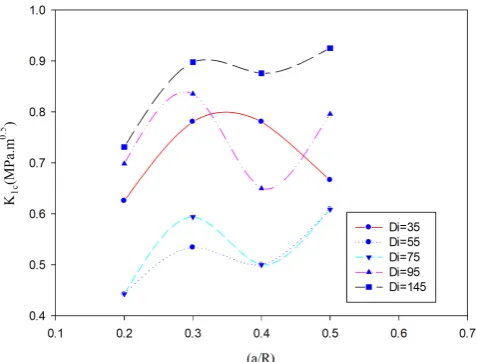
As can be seen in Figure 12, by increasing the crack length, the values of fracture toughness obtained using SNBD method do not follow any specific trend and in some (a/R) ratios the (KI) values are increased and then decreased. These fluctuations could occur due to the nature of the rock. Therefore, using one-way analysis of variance (ANOVA), the results were analyzed with statistical analysis software (SPSS). Moreover, the results of one-way analysis of variance (ANOVA) for SNBD specimens with a diameter of 55 mm are presented in Table 9, and according to Table 9 the significant value of variance analysis equals to 0.631 which is higher than the significance level value of 0.05. Therefore, (H0) assumption was not rejected and the difference between the averages of four surfaces from the crack length factor is not significant. Thus, it can be concluded that the crack length in SNBD specimens has no effect on the fracture toughness values of this rock type at a diameter of 55 mm.
5- 2- Determining the effect of the specimen diameter on mode I fracture toughness
In order to determine the effect of the specimen diameter on mode I fracture toughness, the average values of fracture Fig. 10. Comparison of the results obtained from test with a
two-dimensional simulation (a)
(b)
(c)
Fig. 11. Load-Displacement graph: (a) SENB, (b) SNBD, (c) DT Sum of
Squares df SquareMean F Sig. Between Groups 0.41 3 0.014 00.634 0.631
Within Groups 0.087 4 0.022
Total 0.128 7
Table 9. The results of variance analysis at different surfaces of
toughness for SNBD specimens are shown in Figure 13. As can be seen, by increasing the diameter, the fracture toughness values increase. According to Figure 13, the results obtained from a diameter of 35 mm is in contrast with the trend of other diameters. This is due to the effects of non-isotropic specimens and emerging in small dimensions. But, in diameters larger than 55 mm, the results show a little difference. Therefore, it is better to ignore the results obtained by this diameter and it is suggested using diameters larger than 50 mm for SNBD method. Moreover, fracture toughness values obtained by cylinder direct tension specimens are shown in Figure 14 with regard to the specimen’s diameter changes. Values of fracture toughness for DT specimens are provided due to the fracture load and by using equations (2) and (7). According to the curve trend, it can be concluded that in this type of test, like SNBD specimens, the diameter affects mode I fracture toughness and by increasing the diameter, the fracture toughness increases.
5- 3- The effect of loading type on mode I fracture toughness
In Figure 15 in order to show effects of loading and geometry, fracture toughness values of SNBD, DT, and SENB tests are compared which have an approximately equal area in crack section. Also, in “Figure 16” fracture toughness values using SNBD, DT and SENB tests are shown. As can be seen, the
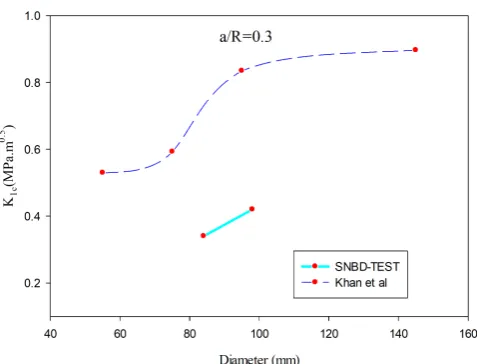
average fracture toughness values obtained by DT and SNBD methods are approximately the same, but in general, the results obtained by SENB method in the modes tested are larger than those obtained through the other two methods. The difference between the obtained fracture toughness values can be assigned to the inaccuracy of the presented relations for one of these two methods which occurred already for CCNBD1
method [2]. However, the results obtained from SNBD and DT methods have relatively close values. It was also observed in SNBD samples that by increasing the diameter from 75 to 95 mm, the average value of fracture toughness increases by 30%. In the study conducted by Khan et al. [6], by increasing the diameter from 84 to 98 mm, the fracture toughness value increased by 23% as in Figure 17.
e as to) they are first mentioned in the text. They must be referred in the text as Fig. 1. Photographs must be original and are treated similar to figures. Leave one space between the Table/Figure and the text following it.
1 Cracked Chevron Notched Brazilian Disc Fig. 12. The fracture toughness changes in terms of the crack
length for SNBD specimens with diameter of 55 mm
Fig. 13. The average of fracture toughness values in terms of diameter for SNBD specimens
Fig. 14. Fracture toughness changes based on the diameter change in DT specimens
6- Conclusion
Considering the results obtained from SENB, DT and SNBD tests and the statistical analysis performed on the results, as well as the conducted numerical study it can be concluded that:
1. The experimental results showed that experimental data scattering for SNBD method is relatively high in small diameters. This is due to the effects of non-isotropic specimens emerging in small dimensions. But, in diameters larger than 55 mm, the results show a little difference.
2. In terms of the crack length, different behaviors were observed between the average values of the fracture toughness obtained by SNBD specimens. By increasing the crack length, the average value in specimens with diameters of 55, 75 and 95 mm first increases and then reduces and again increases, and in diameters of 145 mm, it first increases and then remains constant. It seems that, generally, the crack length has no significant effect on the fracture toughness values.
3. Considering the results associated with the diameter of 35 mm and with regard to the trend followed by other diameters and the inconsistency with other results, the
obtained fracture toughness values of this diameter should be ignored and it is suggested to use a diameter of at least 50 mm in SNBD test.
4. In SNBD samples by increasing the diameter from 75 to 95 mm, the average value of fracture toughness increases by 30%. In the study conducted by Khan et al. by increasing the diameter from 84 to 98 mm the fracture toughness value increases by 23%.
5. A relative difference was observed between the fracture toughness values obtained by SNDB and DT methods and those obtained by SENB method which may be due to different reasons. One of the possible reasons can be due to the inaccuracy of the presented relation for SENB method especially the relation presented for the dimensionless factor for the shape which had occurred already for CCNBD method.
6. The results obtained from the new DT tests show a relatively good compliance with the results of SNBD tests. Therefore, this test is proposed as a proper method to obtain the fracture toughness.
7. Considering the results obtained by numerical modeling of SNBD55-0.2 specimens, it can be concluded that XFEM method together with the VCCT fracture criterion enjoys a relative efficiency for the crack growth beginning simulation and propagation in two dimensional states. As observed, there is a difference about 10 % between these two values.
References
[1] A. Fahimifar, M. Malekpour, Experimental and numerical analysis of indirect and direct tensile strength using fracture mechanics concepts, Bulletin of Engineering Geology and the Environment, 71(2) (2012) 269-283. [2] M. Iqbal, B. Mohanty, Experimental calibration of stress
intensity factors of the ISRM suggested cracked chevron-notched Brazilian disc specimen used for determination of mode-I fracture toughness, International Journal of Rock Mechanics and Mining Sciences, 43(8) (2006) 1270-1276.
[3] M. Aliha, M. Sistaninia, D. Smith, M. Pavier, M. Ayatollahi, Geometry effects and statistical analysis of mode I fracture in guiting limestone, International Journal of Rock Mechanics and Mining Sciences, 51 (2012) 128-135.
[4] L. Tutluoglu, C. Keles, Mode I fracture toughness determination with straight notched disk bending method, International Journal of Rock Mechanics and Mining Sciences, 48(8) (2011) 1248-1261.
[5] F. Ouchterlony, Extension of the compliance and stress intensity formulas for the single edge crack round bar in bending, in: Fracture Mechanics for Ceramics, Rocks, and Concrete, AStM International, 1981.
[6] K. Khan, N. Al-Shayea, Effect of specimen geometry and testing method on mixed mode I-II fracture toughness of a limestone rock from Saudi Arabia, Rock mechanics and rock engineering, 33(3) (2000) 179-206.
[7] E.J. Hansen, V.E. Saouma, Numerical simulation of reinforced concrete deterioration: Part 2-Steel corrosion and concrete cracking, ACI Materials Journal, 96 (1999) 331-338.
[8] S. Mohammadi, Extended finite element method: for
Fig. 16. Comparison of the average fracture toughness values obtained using DT, SENB and SNBD specimens
fracture analysis of structures, John Wiley & Sons, 2008. [9] A.L. Amarasiri, J.K. Kodikara, Determination of cohesive
properties for mode I fracture from beams of soft rock,
International Journal of Rock Mechanics and Mining
Sciences, 48(2) (2011) 336-340.
[10] V. Birtel, P. Mark, Parameterised finite element modelling of RC beam shear failure, in: ABAQUS Users’ Conference, 2006, pp. 95-108.
Pleasecitethisarticleusing:
A. Fahimifar and R. Heidari Moghadam, “An Experimental and Numerical Study on the Effect of Loading Type and Specimen Geometry on Mode-I Fracture Toughness of Rock”, AUT J. Civil Eng., 1(1) (2017) 45-54.
![Fig. 1. Basic fracture modes [2]](https://thumb-us.123doks.com/thumbv2/123dok_us/12844.2001186/2.595.318.557.76.148/fig-basic-fracture-modes.webp)