Nitrogen dynamics in runoff from two small heathland
catchments representing opposite extremes with respect to climate
and N deposition in Norway
Øyvind Kaste
1and Brit Lisa Skjelkvåle
21Norwegian Institute for Water Research, Southern Branch, Televeien 3, N-4879 Grimstad, Norway
2Norwegian Institute for Water Research, P.O. Box 173 Kjelsås, N-0411 Oslo, Norway
Email for corresponding author: [email protected]
Abstract
Effects of contrasting climatic conditions and nitrogen (N) deposition levels on streamwater N dynamics are assessed at two small heathland catchments; Dalelva in northern Norway (69oN) and Øygard in southwestern Norway (58oN). The study comprises 11 years of data on
climate, hydrology and N inputs/outputs from Dalelva and 8 years of corresponding data from Øygard. Both sites are comparable in catchment size, geology and land cover characteristics, but have large differences in climate and N deposition. Dalelva is characterised by a cold, arctic climate and low N deposition (2-3 kg N ha–1 yr–1), whereas the Øygard site has a more mild, humid climate with much larger N deposition
(13–19 kg N ha–1 yr–1). Streamwater nitrate (NO
3-) concentrations at Dalelva generally were negligible during the growing season, but showed
a steady increase during the dormant season until a maximum of 40-100 µg N L–1 was reached just before snowmelt. At onset of the snowmelt
flood, NO3– concentrations decreased momentarily to very low levels, suggesting that N eluted from the seasonal snowpack to a great extent
was infiltrated and immobilised in the soils. At Øygard, flood peaks occurred frequently during all seasons, and usually there was no distinct spring flood. A lack of clear dilution effects from floods on streamwater NO3- concentrations may indicate a relatively high NO
3- leaching
potential in this catchment. On average, the annual NO3– export was negligible at Dalelva (<0.1 kg N ha–1 yr–1), while at Øygard it amounted
to 3.0±0.3 (±1 s.d.) kg ha–1 yr–1, or nearly 20% of the annual N deposition. In addition to this relatively high annual N loss, elevated NO 3
-concentrations during the growing season further indicate that the N supply at Øygard is in excess of the combined plant and microbial demand.
Key words: catchments, surface water, nitrogen deposition, nitrate leaching, climate, hydrology, snowmelt, Dalelva brook, Øygard brook
Introduction
Nitrogen (N) levels and dynamics in streamwater are regulated by interactions between several abiotic and biotic factors operating in the terrestrial catchment and in the aquatic environment (Vitousek et al., 1997). Among the abiotic factors, both climate (air temperature, precipitation, snow accumulation) and N deposition level have a great impact on N pools and transformation processes that subsequently determine concentrations and fluxes of N in surface waters. Several studies have demonstrated a close relationship between N deposition level, soil N status and NO3– leaching (Stoddard, 1994; Dise and Wright, 1995;
Tietema et al., 1998). In addition, increased air- and soil
temperatures caused by a possible climate change in the future may further accelerate NO3– leaching by increasing
the mineralisation of organic matter (Wright, 1998). Norway spans a large north-to-south gradient with respect to both climate and N deposition. The two small, calibrated heathland catchments Dalelva (69oN) and Øygard (58oN)
similar catchment characteristics, these two sites appear to be quite suitable for assessing the effects of different climate and N deposition on such ecosystems.
To date, the monitoring and research activities at Dalelva have mainly focused on acidification problems caused by sulphur (S) deposition from Russian industry located near the Norwegian border. In this context, Wright and Traaen (1992) have reconstructed the acidification history at site and made predictions of future acidification applying the MAGIC model together with soil monitoring data aggregated by Reuss (1990). During 1992–1995, Øygard was one of several calibrated catchments included in the multidisciplinary research project “Nitrogen from mountains to fjords” (Henriksen and Hessen, 1997). Among the activities connected to the Øygard site during this period were N input/output studies of N (Kaste et al., 1997), assessment of N contribution to acidification (Henriksen et al., 1997) and short-term, experimental P additions to streamwater (Hessen et al., 1997). Since 1999, several sub-catchments within Øygard have been intensively studied as part of the research project “N retention and acidification in mountains and heathlands” (Wright et al., 2001).
Both Dalelva and Øygard (as part of the larger Bjerkreim river system) have recently been included in a joint European project intending to adapt the process-oriented INCA model (Integrated Nitrogen model for CAtchments) (Wade and
Whitehead, 2002) to key ecosystem types throughout 8 countries. By linking hydrology with the microbial processes controlling N behaviour in soils and river reaches, the model simulates the contribution of multiple sources to catchment N pools and river nitrate (NO3–) and ammonium (NH
4+)
concentrations.
The main objective here is to assess the effects of contrasting climatic conditions and N deposition on streamwater N dynamics at two sites that are comparable in catchment size, geology and land cover characteristics. Several elements from this assessment will be highly relevant for forthcoming parameterisation, calibration and application of the INCA model, a major theme of this special issue of Hydrology and Earth System Sciences.
Material and methods
STUDY SITES
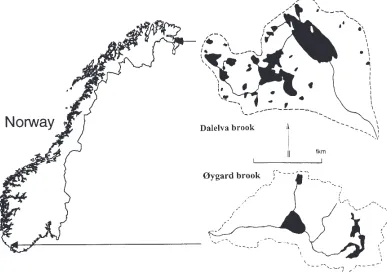
The study sites are located in diametrically opposite parts of Norway, Dalelva at 69o45’N and Øygard at 58o35’N (Fig.
1). Nevertheless, their catchment characteristics are comparable in many respects (Table 1). Both Dalelva and Øygard have relatively small (3.2 and. 2.6 km2, respectively)
[image:2.595.111.498.431.703.2]and undisturbed catchments dominated by heathland and mountains. Dalelva is a small mountain to fjord catchment,
whereas Øygard is located about 20 km from the estuary of the Bjerkreim river system (685 km2). The bedrock geology
in the Dalelva catchment consists of mica schist and micaceous gneiss covered by glacial sediments of similar lithology (Wright and Traaen, 1992). Soils are podsolic, thin and patchy in the upper parts of the catchment. Vegetation comprises birch forest up to about 150 metre elevation with heathlands and moorlands above. About 15% of the Dalelva catchment is covered with lakes. At Øygard, the bedrock geology consists of Precambrian migmatites, banded gneisses and anorthosite covered by glacial sediments (Maijer and Padget, 1987). Soils are thin and patchy, especially in the upper parts of the catchment. The catchment consists largely of heathland with grasses, moors and minor areas of bare rocks or birch forest (Hessen et al., 1997). Approximately 7% of the total catchment area at Øygard is made up of several small lakes (Fig. 1). Even though the fraction of peatland is relatively uniform at the study sites (4% at Dalelva and 6% at Øygard), the average total organic carbon (TOC) concentration in surface water at Dalelva is nearly three times the level at Øygard (Table 1).
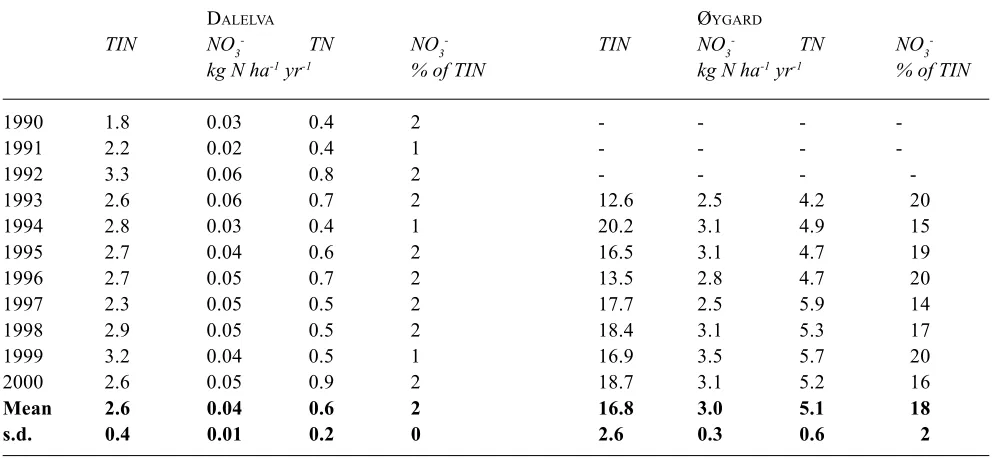
Both catchments have atmospheric deposition as the only external N source (besides N fixation). With an average wet plus dry N deposition of 2.6±0.4 kg N ha–1 yr–1 during 1990–
2000, Dalelva characterises an area that is near natural background levels (Table 2). In contrast, Øygard is located
in the part of Norway receiving the highest amount of long-range transported air pollution (Tørseth and Semb, 1997). Average N deposition at this site during 1993–2000 (16.8±2.6 kg ha–1 yr–1) was approximately six times higher
than at Dalelva. The mean ratios of oxidised N to reduced N in atmospheric deposition at Dalelva and Øygard were 0.93 and 1.31, respectively. In general, the contribution of dry N deposition to total N deposition was much higher at Dalelva (54% during 1990-2000) than at Øygard (16% during 1993–2000). This great difference in deposition mechanisms may be explained largely by the low precipitation amounts in the northern catchment (SFT, 2001). Even though N deposition is quite low at Dalelva, the levels of S deposition are quite high (6–9 kg S ha–1 yr–1) due to
large emissions from Russian industry located near the Norwegian border (SFT, 2001). Despite this, the annual mean hydrogen ion (H+) concentration at Dalelva is
relatively low compared to the more chronic acidified Øygard brook (Table 1).
In addition to very different N deposition levels, the sites are also characterised by highly different climates in terms of air temperature, precipitation amounts and snow accumulation (Table 1). During the periods of study, the mean air temperatures were close to 0oC in the Dalelva area
and nearly 7oC in the Øygard area. Further, the mean
precipitation amounts around Dalelva (0.629 m yr–1) were
less than one-third the levels around Øygard (2.146 m yr–1).
[image:3.595.56.291.130.373.2]Both the mean air temperatures and the corresponding precipitation amounts were close to or slightly higher than Table 1.Site characteristics. Climatic data are mean values
(±1 s.d.) during 1990-2000 at Dalelva and 1993-2000 at Øygard. Streamwater concentrations of total organic carbon (TOC) and hydrogen ions (H+) are flow-weighted.
Parameter Unit Dalelva Øygard
Catchment area (Ac) km2 3.2 2.55
Altitude m.a.s.l. 0-241 185-544
Mean slope o 5 8
Land cover:
- Forest % of Ac 20 4
- Heath/mountains “ 61 83
- Peat “ 4 6
- Lakes “ 15 7
Climate
- Air temperature oC 0.2±0.8 6.7±0.6
- Snow season days yr–1 214±13 58±17
- Snow depth m 0.50±0.09 0.11±0.04
- Precipitation m yr–1 0.629±0.073 2.146±0.357
Water chemistry:
- TOC mg L–1 3.8±0.3 1.4±0.2
- H+ µeq L–1 1.7±0.4 9.1±2.0
Table 2.Annual mean concentrations of NO3- and TN in the
streams (flow-weighted).
Dalelva Øygard
NO3- TN NO
3- TN
µg N L-1 µg N L-1
1990 9 141 -
-1991 6 144 -
-1992 13 161 -
-1993 16 187 168 282
1994 9 125 161 257
1995 11 134 168 252
1996 10 151 189 320
1997 14 135 125 295
1998 12 133 135 228
1999 11 133 159 264
2000 9 154 123 209
Mean 11 145 154 263
[image:3.595.312.551.503.730.2]the 1961–1990 normal (DNMI, 2001). Air temperatures above 0oC are rare during winter at Dalelva, and the
catchment is usually covered with snow for 6–7 months of the year, ranging from the middle of October to late May. On average, nearly 45% of the annual precipitation at Lanabukt, near Dalelva, accumulated as snow during 1990– 2000. The extensive snow accumulation has a heavy impact on the seasonal runoff pattern, which is characterised by very low flow during winter and a distinct snowmelt flood in May–June. At the Øygard catchment, the winters are usually mild and snow accumulation is often a transient phenomenon (Fig. 2). At Helleland, near Øygard, only 9% of the annual precipitation accumulated as snow during 1993–2000. The mild winters, in combination with large precipitation amounts, generate a highly variable runoff pattern with frequent flood episodes that may occur at all seasons. In contrast to Dalelva, there is usually no distinct spring flood following snowmelt at Øygard.
METHODS AND DATA SOURCES Streamwater chemistry
Water chemistry and stream flow have been monitored at Dalelva and Øygard since 1988 and 1992, respectively. Most data are collected within the framework of the Norwegian monitoring programme on long-range transported air pollutants (LRTAP) (Johannessen, 1995). At Øygard, however, the first four years of data come from the research project “Nitrogen from mountains to fjords” (Henriksen and Hessen, 1997). Since 1990 at Dalelva and 1993 at Øygard, chemical samples have been collected weekly and fortnightly, respectively. The samples have been analysed unfiltered at NIVA for several parameters, of which nitrate (NO3–), ammonium (NH
4+), total nitrogen (TN), pH, and
total organic carbon (TOC) are presented in this paper. NO3–
and NH4+ were analysed by automated colorimetry, NO 3–
after reduction with cadmium amalgam, NH4+ after reaction
[image:4.595.94.499.350.715.2]with hypochlorite and phenol, and TN after oxidation with
Fig. 2. Monthly mean air temperatures, snow depths and precipitation volumes -20
-15 -10 -5 0 5 10 15 20
90 91 92 93 94 95 96 97 98 99 00
Monthly mean air temperature, oC
Dalelva Øygard
Air temperature
0 20 40 60 80 100 120
90 91 92 93 94 95 96 97 98 99 00
Monthly mean snow depth, cm
Dalelva Øygard
Snow depth
0 100 200 300 400 500 600
90 91 92 93 94 95 96 97 98 99 00
Monthly mean precipitation, mm
Dalelva Øygard
peroxodisulphate; TOC was analysed by spectophotometry after UV oxidation (Wright, 1998). NO3– was actually
analysed as the sum of NO3– and NO
2–, but the latter species
is quickly oxidised to NO3- and is usually taken as
insig-nificant in natural surface waters. Detection limits for the NO3–, NH
4
+, TN and TOC analyses are 1, 5, 10 µg N L–1 and
0.2 mg C L–1, respectively. Among the N species, NH 4+ was
only analysed in 1988, 2000 and during the first half of 2001. Altogether, NH4+ concentrations were determined in
a total of 35 and 22 samples at Dalelva and Øygard, respectively. Due to the limited NH4+ data, total organic N
(TON) was estimated from TN minus NO3- and the mean of
observed NH4+concentrations. This probably introduces a
relative small error to the annual mean TON estimates, in that NH4+ concentrations generally were low and showed
little variation throughout the year (95 percentile ≤ 13 µg N L–1 at both sites). Fluxes of NO
3– and TN were calculated
for each day using observed or estimated water discharges at the stream outlets and the corresponding chemical data interpolated from weekly or fortnightly samples.
Atmospheric N deposition
The atmospheric N deposition data are obtained from the nearest monitoring stations included in the LRTAP programme (Johannessen, 1995). The data comprise wet and dry deposition of total inorganic N (TIN), which is the sum of NO3– and NH
4+. Wet deposition is determined by the
chemical composition and amount of precipitation, whereas dry deposition is estimated from ambient air concentrations and dry deposition velocities for individual components (Tørseth and Semb, 1998).
At Dalelva, wet deposition estimates are from the stations Karpdalen (1991–1997) and Karpbukt (1999-2000), which are located 3.5 and 2 km south of the Dalelva outlet, respectively. Missing data in 1990 and 1998 are substituted with corresponding data from the monitoring station Svanvik, which is located 28 km south of Dalelva. Parallel monitoring during 1991–1997 demonstrated that mean TIN deposition amounts at Svanvik deviated less than 10% from those at Karpdalen. In the absence of dry deposition estimates at Karpdalen/Karpbukt, corresponding data from Svanvik are employed for the whole period.
At Øygard, the wet deposition data are obtained from the monitoring station Ualand (15 km southeast of the catchment), whereas dry deposition estimates were obtained from Skreådalen (50 km to the northeast). Due to the relatively long distance between the study site and the monitoring stations, the N deposition estimates at Øygard probably are more uncertain than at Dalelva. Through application of an interpolation routine, Tørseth and Semb
(1997) estimated a precipitation amount and TIN deposition field for the Bjerkreim river catchment. The fields were based on runoff data from 44 sub-catchments (NVE, 1994), precipitation amounts from eight local monitoring sites, and precipitation chemistry from Ualand, Skreådalen, and two temporary monitoring sites located within the main catchment. According to their estimate, annual precipitation at Øygard during 1993–95 was 8–24% (mean 18%) higher than at Ualand, and the annual TIN deposition was 12–23% (mean 19%) higher than at Ualand (including dry deposition equivalent to Skreådalen). The examination demonstrated that the spatial variation in chemical composition was much less than the spatial variation in precipitation amounts. Hence, to obtain more realistic TIN deposition estimates for Øygard during the whole period 1993–2000, wet deposition data from Ualand are scaled up 18%, according to the relative difference in precipitation amounts during 1993-95.
Meteorological and hydrological data
Data on daily air temperatures, precipitation and snow cover are obtained from the nearest monitoring stations operated by the Norwegian Meteorological Institute (DNMI, 2001). At Dalelva, air temperatures are from the station Kirkenes (18 km west of the catchment), whereas precipitation and snow depth data are obtained from the station Lanabukt (7 km to the northeast). At the Øygard site, air temperature data are collected from the monitoring stations Ualand (1993–1997; 15 km southeast of catchment) and Eik-Hove (1998–2000; 24 km to the southeast). Precipitation and snow depths are obtained from the monitoring station Helleland, which is located 10 km south of the Øygard catchment. According to estimates made by Tørseth and Semb (1997), the annual precipitation at the Øygard catchment during 1993–95 was 9% higher than at the monitoring station Helleland.
Both Dalelva and Øygard have weirs at the outlet, where water discharge is monitored continuously by pressure transducers and loggers operated by NIVA. For quality assurance, the runoff data are compared to corresponding data from two adjacent gauging stations operated by the Norwegian Water Resources and Energy Directorate (NVE, 2001). These are Karpelva (124 km2), located 3 km south
of the Dalelva outlet, and Hetland (69.7 km2), which has its
headwaters about 5 km west of the Øygard outlet. In cases where data are missing or the runoff values seem erroneous, scaled data from the NVE stations are inserted. The scaling was accomplished according to catchment size and the 30-year normal runoff (m yr–1) at the respective gauging stations
differences between precipitation and runoff have been in the range 0.129–0.336 m yr–1 (mean 0.226) at Dalelva and
0.216–0.484 m yr–1 (mean 0.361) at Bjerkreim. Despite the
uncertainties both in the precipitation and runoff estimates, the numbers seem reasonable when compared with regional evapotranspiration estimates previously reported for Norway (Otnes and Ræstad, 1978).
Results
N SPECIES COMPOSITION
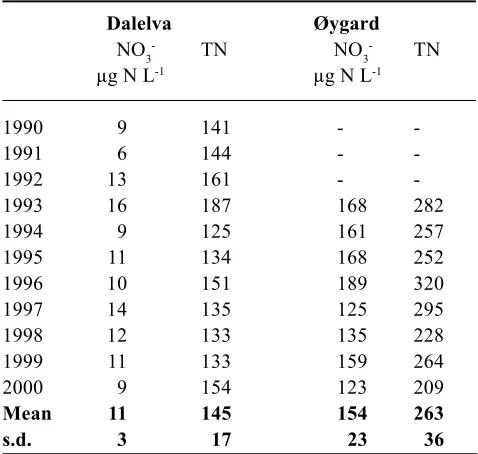
The study sites differed widely with respect to streamwater TN and NO3– concentrations (Table 3). On an annual basis,
the mean flow-weighted NO3- concentrations at Dalelva
were extremely low, 11±3 µg N L–1, whereas TN
concentrations were more than ten times higher. Compared to Dalelva, the mean streamwater NO3– concentrations at
Øygard were considerable (154±23 µg N L–1), and on
average NO3– at this site constituted nearly 60% of TN. In
general, there were relatively small inter-annual variations in mean concentrations of both NO3– and TN at the study
sites.
Like in most other pristine sites in Norway, the mean (not flow-weighted) NH4+ concentrations at Dalelva and Øygard
were very low, 6±3 (n=35) and 6±9 (n=22) µg N L–1,
respectively. The relatively high standard deviation value at Øygard was strongly affected by one single value (44 µg N L–1). Apart from this, variation in NH
4
+ concentrations
has been small at both sites during the study period and it seems reasonable to assume that the mean concentrations above are quite representative for the two catchments. As such, the annual mean TON concentrations at Dalelva and Øygard probably have been close to 130 and 105 µg L–1,
respectively. When considering that TOC concentrations at Dalelva are nearly three times higher than at Øygard, the corresponding mean TOC:TON molar C:N ratio was much higher at Dalelva (~35) compared to Øygard (~15).
INPUT/OUTPUT OF N
Yearly outputs of NO3– in runoff were negligible at Dalelva
(mean <0.1 kg N ha–1 yr–1), corresponding to only 2% of the
average atmospheric TIN deposition (Table 3). Relative to this, the streamwater TN export was considerably higher, 0.6 kg ha–1 yr–1. At Øygard, which receives much higher
TIN deposition, NO3- leaching was considerably higher than
at Dalelva. On average 3.0±0.3 kg N ha–1 yr–1 was lost from
the catchment as NO3– during 1993-2000. This corresponded
to nearly 20% of the TIN deposition from atmospheric sources during the same period. When including TON and NH4+, the mean TN export at Øygard amounted to 5.1±0.6
kg ha–1 yr–1. Hence, the TN export at Øygard was nearly ten
times larger than at Dalelva, whereas the corresponding NH4+
+ TON export was nearly four times higher.
[image:6.595.44.541.504.734.2]A complete input/output budget for N would imply inputs from atmospheric deposition (both TIN and TON) and N fixation v. loss via streamwater runoff and N2O emissions from denitrification and nitrification. Deposition of TON is
Table 3.Annual output fluxes of NO3- and TN relative to TIN inputs from atmospheric sources
DALELVA ØYGARD
TIN NO3- TN NO
3- TIN NO3- TN NO3
-kg N ha-1 yr-1 % of TIN kg N ha-1 yr-1 % of TIN
1990 1.8 0.03 0.4 2 - - -
-1991 2.2 0.02 0.4 1 - - -
-1992 3.3 0.06 0.8 2 - - -
-1993 2.6 0.06 0.7 2 12.6 2.5 4.2 20
1994 2.8 0.03 0.4 1 20.2 3.1 4.9 15
1995 2.7 0.04 0.6 2 16.5 3.1 4.7 19
1996 2.7 0.05 0.7 2 13.5 2.8 4.7 20
1997 2.3 0.05 0.5 2 17.7 2.5 5.9 14
1998 2.9 0.05 0.5 2 18.4 3.1 5.3 17
1999 3.2 0.04 0.5 1 16.9 3.5 5.7 20
2000 2.6 0.05 0.9 2 18.7 3.1 5.2 16
Mean 2.6 0.04 0.6 2 16.8 3.0 5.1 18
not measured within the LRTAP programme, but data from monitoring sites in southern Norway indicate that this fraction constitutes an insignificant fraction of TN deposition (Oredalen and Aas, 2000). In other words, TIN deposition data from this area may to a great extent be equivalent to the TN deposition. Both N fixation and N2O emissions are difficult to estimate on a catchment scale due to large spatial and temporal variations. According to the manual for mapping critical loads of acidifying deposition (UBA, 1996), however, both fluxes are usually low (0–3 kg ha–1 yr–1) and
roughly balance in boreal ecosystems.
SEASONAL VARIATION IN N OUTPUTS
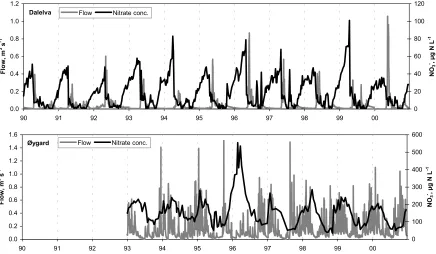
Both sites show distinct seasonal variations in NO3–
concentrations, with a late-summer minimum and increasing levels during the dormant season (Fig. 3). At Dalelva, NO3–
concentrations usually decreased below the detection limits during the growing season, but sometimes also small NO3–
peaks were recorded during and after especially dry periods. However, these peaks did not contribute significantly to NO3– export from the catchment due to very low streamwater
flow. At the end of the growing season, when snow usually starts to accumulate, NO3– concentrations gradually built
up and culminated at levels around 40–100 µg N L–1 just
before the onset of the spring flood. Also, during this period, the water discharges were quite low, such that the N fluxes
from the catchment remained small. The large difference between summer and winter NO3– concentrations under low
flow conditions probably reflects differences in soil water NO3– content in the growing season (when plant demand
for NO3– is high) v. the dormant season. Each year at the
onset of the spring flood, there was an immediate decrease in the NO3– concentrations, suggesting an extensive dilution
effect from the high water discharges following snowmelt. Also at Øygard, there was a steady increase in NO3–
concentrations from late autumn (usually October– November), until maximum levels (200–550 µg N L–1) were
reached during winter (usually March–April). The culmination of the winter NO3– peak at Øygard did not seem
related to a particular hydrological event (e.g. snowmelt), but rather to be associated with initial stages of the growing season. The annual NO3– minimum (40–100 µg N L–1)
usually was reached during late summer or early autumn. It is worth noting that concentrations rarely decreased below 50 µg N L–1 during any time of the growing season. In most
years there were relatively short periods with low flow conditions during summer. Beyond that, summer NO3–
export could reach considerable levels (30–40 g N ha–1
day–1) during floods following heavy rain events. In contrast
to Dalelva there was no significant decrease in NO3–
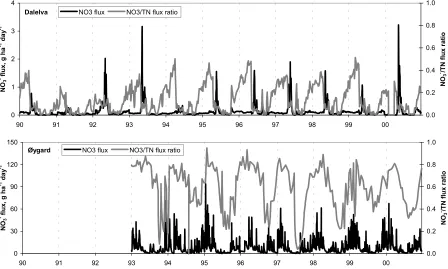
concentrations during floods at any time of the year. There were also large differences among the sites with respect to NO3–v. TN export (Fig. 4). Despite decreasing
0.0 0.2 0.4 0.6 0.8 1.0 1.2
90 91 92 93 94 95 96 97 98 99 00
Flow, m
3 s
-1
0 20 40 60 80 100 120
NO
3
-, µg N L
-1
Flow Nitrate conc.
Dalelva
0.0 0.2 0.4 0.6 0.8 1.0 1.2 1.4 1.6
90 91 92 93 94 95 96 97 98 99 00
Flow, m
3 s
-1
0 100 200 300 400 500 600
NO
3
-, µg N L
-1
Flow Nitrate conc.
[image:7.595.87.523.456.710.2]Øygard
concentrations, the NO3– export at Dalelva usually increased
during the snowmelt flood due to the high water discharges. During 1990–2000, approximately 55% of the annual runoff and 51% of the annual NO3– export at Dalelva occurred
during May–June, when the spring flood regularly occurred. Even at this time of year the maximum NO3– export,
however, was much lower than at Øygard. The relative contribution of NO3– to the TN export at Dalelva usually
increased during winter and culminated at levels around 30– 50% just before the onset of the spring flood (Fig. 4). During summer and early autumn, however, N export from Dalelva was almost completely dominated by TON. At Øygard, approximately 44% of the annual runoff and 55% of the annual NO3– export during 1993–2000 took place during
the winter months December- April. At this time of year, NO3– was the dominant N species, often consisting of >80%
of the TN export. Dominance of TON export (NO3–/TN ratio
<0.5) was only seen in short periods during late summer and early autumn. In general, the long-term data revealed no distinct seasonal pattern in TON concentrations or fluxes from the two catchments (data not shown).
Discussion
Streamwater NO3– concentrations at Dalelva and Øygard
represent the lower v. the higher end of the range characterising Norwegian monitored catchments and lakes.
According to the 1995 Norwegian lake survey including 1006 statistically selected lakes covering the whole country (Henriksen et al., 1998), 35% and 90% of the lakes had lower NO3- output concentrations than Dalelva (11 µg N
L–1) and Øygard (154 µg N L–1), respectively. On a broader
European scale, the Øygard catchment represents a more intermediate level with respect to output NO3–
concentrations. In a database of 204 European and North American catchments and lakes included in the ICP Waters programme (Skjelkvåle et al., 2001), about 8% and 45% of the sites had NO3– concentrations lower than 10 and 150 µg
N L–1, respectively.
RELATIONS BETWEEN CLIMATIC CONDITIONS AND SEASONAL VARIATIONS IN STREAMWATER NO3–
In addition to representing opposite ends of the climatic gradient in Norway, the sites are also affected by a considerable climatic variability ranging from short-time episodes, seasonal and between-year variations, to long-term trends and cyclic changes that are beyond the time-scale of this study. By affecting terrestrial and aquatic N transformation processes, climatic conditions and their variation indirectly also have a large influence on concentrations and fluxes of N in streamwater. Due to lake percentages of 15 and 7% at Dalelva and Øygard,
0 1 2 3 4
90 91 92 93 94 95 96 97 98 99 00
NO
3
- flux, g ha -1 day
-1
0.0 0.2 0.4 0.6 0.8 1.0
NO
3
-/TN flux ratio
NO3 flux NO3/TN flux ratio
Dalelva
0 30 60 90 120 150
90 91 92 93 94 95 96 97 98 99 00
NO
3
- flux, g ha -1 day
-1
0.0 0.2 0.4 0.6 0.8 1.0
NO
3
-/TN flux ratio
NO3 flux NO3/TN flux ratio
[image:8.595.63.511.70.339.2]Øygard
Fig. 4. Fluxes of NO3– and the corresponding NO
respectively, water residence time in the lakes may to some extent have a damping effect on the seasonal pattern of streamwater NO3– concentrations. According to studies of
12 Norwegian lake and stream sites with lake percentages in the range 0–26%, however, the damping effects on seasonal NO3– concentrations were not clear until the lake
percentage exceeded 15% (Ø. Kaste, unpubl. data). During the long and cold winters at Dalelva, when in practice all precipitation is accumulated as snow, the stream flow is very low and dominated by baseflow. The steady increase in NO3– concentration observed every winter at this
site probably is a result of minimal dilution effects from percolating water and little or no N uptake by plants after establishment of a permanent snow cover. Additionally, net N mineralisation and subsequent nitrification below the snowpack may have contributed to the observed NO3–
pattern (Williams et al., 1996). Low streamwater NH4+
concentrations during winter indicate that mineralised N is rapidly immobilised or transformed to NO3– within the
catchment (Dillon and Molot, 1990) or in the stream (Peterson et al., 2001). Due to the low flow conditions prevailing during winter, the elevated NO3– concentrations
do not contribute significantly to the annual streamwater NO3– export.
Immediately at onset of the snowmelt flood, streamwater NO3– concentrations decrease rapidly to very low levels.
This rapid decrease obviously was caused by dilution from snowmelt and maybe also assimilation by biota. Analogous patterns in NO3– concentrations during snowmelt are
observed in other alpine and sub-alpine catchments (e.g. Williams et al., 1996). Tracer studies have demonstrated that NO3– in snowmelt runoff mainly comes from pre-melt
soil water rather than the melting snow itself (Kendall et al., 1995; Williams et al., 1996). In other words, NO3– and
NH4+ eluted from the seasonal snowpack appear to be
infiltrated and immobilised in the soils. If flushed directly to the stream during snowmelt, this amount of N would have caused a considerable export of NO3– and maybe also NH
4+.
Despite the rapid decrease observed in streamwater NO3–
concentrations during snowmelt, the NO3– export during the
spring flood still constituted a considerable fraction of the annual NO3- output from the catchment (Fig. 4).
After snowmelt, the Dalelva catchment experiences a short and intensive growing season that lasts approximately four months. During summer, air temperatures can be as high as at Øygard (Fig. 2), and due to relatively low precipitation amounts, streamwater flow usually is very low at that time. In general, NO3– concentrations are near the detection limits
during summer due to a high plant and microbial demand for N (Fig. 3). However, small NO3– peaks are sometimes
observed after warm and dry periods e.g. during
mid-summer in 1996 and 1997. In these cases, drought and re-wetting of soils might have caused elevated mineralisation and nitrification with subsequent increases of soil water NO3–
concentrations (Reynolds et al., 1992; Murdoch et al., 1998). In contrast to Dalelva, the Øygard site is characterised by mild winters that often are accompanied by high stream flow. Due to the lack of a permanent snow cover and often absence of soil frost, the N transformation processes at Øygard may proceed throughout large parts of the winter. With air temperatures largely fluctuating around 0oC during winter,
the upper soil horizons will undergo frequent freezing/ thawing that may affect plant roots and soil organic matter and increase the substratum available for mineralisation (Monteith et al., 2000). In turn, this may lead to increased nitrification, reduced plant uptake and occasionally also increased denitrification (Ryan et al., 2000). The net effect, however, is often increased N leaching to surface waters (Mitchell et al., 1996; Monteith et al., 2000).
Also at Øygard the NO3– concentrations increased steadily
throughout the dormant season, even though the stream flow was highly variable. Especially high NO3– concentrations
were observed during the winter of 1995–96 (Fig. 3). This winter was atypical in terms of climate, with a relatively long period characterised by low temperatures and unusual low stream flow (Figs. 2 and 3). Apart from the concentration levels, the NO3– pattern this winter had many
similarities with an average winter situation at Dalelva. The elevated NO3– concentrations at Øygard this winter probably
reflect strongly reduced dilution of soil water due to small amounts of percolating water. Due to the unusual low stream flow, the streamwater NO3– export remained low during this
period (Fig. 4).
The massive NO3– concentration peak observed at Øygard
during winter in 1995/1996 appeared simultaneously in lakes and streams in the UK (Monteith et al., 2000). Hence, streamwater NO3- dynamics at that time could be controlled
by a large-scale climatic event. In this context, Monteith et al. (2000) found that variations in NO3– concentrations at
the UK sites showed a strong negative correlation with winter values for the North Atlantic Oscillation (NAO) index and mean winter temperature. High winter values for the NAO index are associated with relatively warm and wet winter conditions in northwestern Europe, whereas low values coincide with colder and drier conditions (Hurrell, 1995).
Except for the extraordinary conditions prevailing during the winter of 1995-96, there was usually no clear relationship between stream flow and the corresponding NO3–
concentration at Øygard (Fig. 5). Thus, there were no obvious dilution effects on NO3– concentrations even during
where there was a strong inverse relationship between stream flow and the corresponding NO3– concentration. Hence, the
lack of clear dilution effects at Øygard may indicate that the NO3– leaching potential from soils in this catchment is
relatively high. One possible mechanism contributing to such a pattern might be that during heavy flood episodes, some fraction of NO3– in event water is flushed directly to the
stream instead of percolating through the soil profile: parts of the catchment are dominated by bare rocks and patchy soils with low infiltration capacity. Such mechanisms are, however, difficult to identify without continuous sampling (Moldan and Wright, 1998) or by applying isotope techniques (e.g. Durka et al., 1994; Kendall, 1998).
DO THE SITES REPRESENT STAGES IN A PROBABLE TIME COURSE OF CATCHMENT RESPONSE TO CHRONIC N ADDITIONS?
Due to similar catchment characteristics (size, geology, land
cover), water chemistry at Dalelva and Øygard probably was quite uniform prior to the anthropogenic influences that altered N deposition at Øygard and S deposition at both sites. On this basis, it might be reasonable to regard Dalelva as a sort of “reference” to Øygard with respect to trends in catchment N status and N leaching. Thus, the differences between the Dalelva and the Øygard catchments today may be viewed as a response to long-term N deposition.
After decades with elevated N deposition at Øygard, the catchment today appears quite enriched with N compared to Dalelva. In addition to the differences in streamwater NO3–
concentrations, this also seems to be reflected in C:N ratios of the soil organic layers. At Dalelva, average C:N ratios in four plots covered with birch trees were in the range 29–39 (SFT, 1989; A.O. Stuanes, upubl. data), whereas corresponding C:N values in four wetland- and heather plots at Øygard were in the range 22–29 (Wright et al., 1999). In this context, it must be noted that slower and less effective decomposition of organic matter in the cold climate characterising the northern site may to some extent maintain a high C:N ratio. The net effect of this is difficult to quantify. It is, however, documented from several forested sites in Europe that elevated atmospheric N inputs have led to decreased soil C:N ratios, and empirical data demonstrate a negative correlation between NO3– leaching and C:N ratios
in the forest floor (Gundersen et al., 1998). A similar, but less significant negative relationship is also found between NO3– concentration and the DOC:DON ratio in runoff water
(Harriman et al., 1998). In this context, C:N ratios in dissolved organic matter runoff were much higher at Dalelva (~35) than at Øygard (~15) during the study period.
Both the damped seasonal variations in NO3–
concentrations and the present NO3– leaching illustrate that
the N supply at Øygard is in excess of the combined plant and microbial demand. According to the N saturation stage classification developed by Stoddard (1994) and Stoddard and Traaen (1995), the site falls in-between stage 1 and 2, which denotes N saturated systems with moderate to high annual NO3– losses. In comparison, the Dalelva catchment
falls into stage 0, which characterises a non-saturated system. At Øygard, NO3– leaching takes place despite the fact that
the growing season, and hence the plant demand for N, is much more extensive than at Dalelva. The absence of dilution effects on NO3– concentrations during floods at
Øygard may further underline that there is a large N pool in the soils available for leaching in this catchment. This stands in sharp contrast to the Dalelva catchment, where the N pool obviously is much smaller and flood events effectively dilute streamwater NO3– concentrations. Even in this pristine
catchment receiving small amounts of N deposition, however, it seems inevitable that some of the NO3
-0 20 40 60 80 100 120
0.0 0.2 0.4 0.6 0.8 1.0 1.2
Flow, m3 s-1
NO
3
-, µg N L
-1
Dalelva
0 100 200 300 400 500 600
0.0 0.2 0.4 0.6 0.8 1.0 1.2 1.4 1.6 Flow, m3 s-1
NO
3
-, µg N L
-1
[image:10.595.56.259.340.702.2]Øygard
accumulated in the soils during winter is lost via runoff before onset of the growing season.
If Dalelva and Øygard represent a probable time course of catchment response to chronic N additions, there has been a considerable increase in NO3– leaching at Øygard during
the last century. This is demonstrated spatially in several European forest sites, where very little NO3– leaching occurs
at N deposition below 9–10 kg N ha–1 yr–1, leaching can
occur at intermediate deposition between 9 and 25 kg N ha–1 yr–1, and significant leaching occurs at almost all sites
receiving deposition greater than 25 kg N ha–1 yr–1 (Dise
and Wright, 1995). One crucial question is whether the present NO3– leaching at Øygard represents steady-state
conditions with respect to the ambient N deposition level, or if further increased NO3– leaching may be expected in
the future as a result of decreasing C:N ratios (Gundersen et al., 1998) and possibly also climate change (Murdoch et al., 1998; Wright, 1998). In contrast to forest ecosystems, the knowledge of N retention capacity in heathland and mountainous areas is relatively scarce. Thus, a better understanding of N transformation processes in these areas is essential for assessing the possible consequences of a maintained (or slightly reduced) N deposition level in the future.
Acknowledgements
This work has been supported by the European Commission (INCA Project EVK1-1999-00011), the Research Council of Norway (NFR) (through the research project “N retention and acidification in mountains and heathlands”), and the Norwegian Institute for Water Research (NIVA). Chemical data has been collected as part of the Norwegian monitoring programme for long-range transported air pollutants (funded by the Norwegian Pollution Control Authority [SFT]) and the research project “Nitrogen from mountains to fjords” (funded by NFR and NIVA). We thank Richard F. Wright, NIVA, for valuable comments on the manuscript.
References
Dillon, P.J. and Molot, L.A., 1990. The role of ammonium and nitrate retention in the acidification of lakes and forested catchments. Biogeochemistry, 11, 23–43.
Dise, N.B. and Wright, R.F., 1995. Nitrogen leaching from European forests in relation to nitrogen deposition. Forest Ecol.
Manage., 71, 153–161.
DNMI, 2001. Daily precipitation volumes and snow depths at the monitoring stations Lanabukt and Helleland; Daily mean temperatures at the monitoring stations Kirkenes, Ualand, and
Eik-Hove. The Norwegian Meteorologial Institute (DNMI),
Oslo, Norway.
Durka, W., Schulze, E-D., Gebauer, G. and Voerkelius, S., 1994. Effects of forest decline on uptake and leaching of deposited nitrate determined from 15N and 18O measurements. Nature, 372,
765–767.
Gundersen, P., Callesen, I. and de Vries, W., 1998. Nitrate leaching in forest ecosystems is related to forest floor C/N-ratios. Environ.
Pollut., 102, 403–407.
Harriman, R., Curtis, C. and Edwards, A.C., 1998. An empirical approach for assessing the relationship between nitrogen deposition and nitrate leaching from upland catchments in the United Kingdom using runoff chemistry. Water Air Soil Pollut.,
105, 193–203.
Henriksen, A. and Hessen, D.O., 1997. Whole catchment studies on nitrogen cycling: Nitrogen from mountains to fjords. Ambio,
26, 254–257.
Henriksen, A., Hindar, A., Hessen, D.O. and Kaste, Ø., 1997. Nitrogen contribution to acidity in the Bjerkreim river, southwestern Norway. Ambio,26, 304–311.
Henriksen, A., Skjelkvåle, B.L., Mannio, J., Wilander, A., Harriman, R., Curtis, C., Jensen, J.P., Fjeld, E. and Moiseenko, T., 1998. Northern European lake survey, 1995. Finland, Norway, Sweden, Denmark, Russian Kola, Russian Karelia, Scotland and Wales. Ambio,27, 80–91.
Hessen, D.O., Henriksen, A. and Smelhus, A.M., 1997. Seasonal fluctuations and diurnal oscillations in nitrate of a heathland brook. Water Res., 31, 1813–1817.
Hurrell, J.W., 1995. Decadal trends in the North-Atlantic Oscillation – regional temperatures and precipitation. Science,
269, 676–679.
Johannessen, T., 1995. Acidification in Norway; The Norwegian monitoring programme for long-range transported air pollutants.
Water Air Soil Pollut., 85, 617–621.
Kaste, Ø., Henriksen, A. and Hindar, A., 1997. Retention of atmospherically-derived nitrogen in subcatchments of the Bjerkreim River in Southwestern Norway. Ambio, 26, 296–303. Kendall, C., 1998. Tracing nitrogen sources and cycling in catchments. In: Isotope tracers in catchment hydrology, C. Kendall and J.J. McDonnell (Eds.). Elsevier Science B.V, 519– 576.
Kendall, C., Campbell, D.H., Burns, D.A., Shanley, J.B., Silva, S.R. and Chang, C.C.Y., 1995. Tracing sources of nitrate in snowmelt runoff using the oxygen and nitrogen isotopic compositions of nitrate. In: Biogeochemistry of seasonally
snow-covered catchments, K.A. Tonnesen, M.A. Williams and M.
Tranter (Eds.). Intern. Assoc. Hydrol. Sci., Proceedings, July 3-14, Boulder CO, USA, 339–347.
Maijer, C. and Padget, P. (Eds.), 1987. The geology of southernmost
Norway: an excursion guide. Special Publication no. 1,
Geological Survey of Norway, Trondheim, Norway, 109 pp. Mitchell, M.J., Driscoll, C.T., Kahl, J.S., Likens, G.E., Murdoch,
P.S. and Pardo, L.H., 1996. Climatic control of nitrate loss from forested watersheds in the northeast United States. Environ. Sci.
Technol., 30, 2609–2612.
Moldan, F. and Wright, R.F., 1998. Episodic behaviour of nitrate in runoff during six years of nitrogen addition to the NITREX catchment at Gårdsjön, Sweden. Environ. Pollut., 102, 439– 444.
Monteith, D.T., Evans, C.D. and Reynolds, B., 2000. Are temporal variations in the nitrate content of UK upland freshwaters linked to the North Atlantic Oscillation? Hydrol. Process., 14, 1745– 1749.
NVE, 1987. Runoff map of Norway. Period of reference 1930-1960. The Norwegian Water Resources and Energy Directorate (NVE), Oslo, Norway.
NVE, 1994. Hydrological map for the Bjerkreim watershed. The Norwegian Water Resources and Energy Directorate (NVE), Oslo, Norway.
NVE, 2001. Daily mean water flow at the gauging stations
Karpelva and Hetland. The Norwegian Water Resources and
Energy Directorate (NVE), Oslo, Norway.
Oredalen, T.J. and Aas, K., 2000. Evaluation of atmospheric
phosphorus deposition in the south-east of Norway [English
summary], Report 4310, Norwegian Institute for Water Research, Oslo, Norway, 33 pp.
Otnes, J. and Ræstad, E., 1978. Hydrology in practice [in Norwegian]. Engineering Publishers (Ingeniørforlaget), Oslo, Norway, 314 pp.
Peterson, B.J., Wollheim, W.M., Mulholland, P.J., Webster, J.R., Meyer, J.L., Tank, J.L., Martí, E., Bowden, W.B., Valett, H.M., Hersey, A.E., McDowell, W.H., Dodds, W.K., Hamilton, S.K., Gregory, S. and Morall, D.D., 2001. Control of nitrogen export from watersheds by headwater streams. Science, 292, 86–90. Reuss, J.O., 1990. Critical loads for soils in Norway. Analyses of
soils data from eight Norwegian catchments. Report 2484,
Norwegian Institute for Water Research, Oslo, Norway, 78 pp. Reynolds, B., Emmett, B.A. and Woods, C., 1992. Variations in streamwater nitrate concentrations and nitrogen budgets over 10 years in a headwater catchment in mid-Wales. J. Hydrol.,
136, 155–175.
Ryan, M.C., Kachanoski, R.G. and Gillham, R.W., 2000. Overwinter soil nitrogen dynamics in seasonally frozen soils.
Can. J. Soil Sci., 80, 541–550.
SFT, 1989. Norwegian monitoring programme for long-range
transported air pollutants. Annual report 1988 [English
summary]. Report 375/89, The Norwegian Pollution Control Authority (SFT), Oslo, Norway, 274 pp.
SFT, 2001. Norwegian monitoring programme for long-range
transported air pollutants. Annual report – Atmospheric
deposition 2000 [in Norwegian]. Report 828/2001, The
Norwegian Pollution Control Authority (SFT), Oslo, Norway, 160 pp.
Skjelkvåle, B.L., Oledrzynski, K., Stoddard, J.L., Tarrason, L., Traaen, T.S., Tørseth, K., Windjusveen, S. and Wright, R.F., 2001. Assessment of trends and leaching of nitrogen at ICP
Waters sites (Europe and North America). ICP Waters report
54/2001, Norwegian Institute for Water Research, Oslo, Norway, 45 pp.
Stoddard, J.L., 1994. Long term changes in watershed retention of nitrogen. Its causes and aquatic consequences. In:
Environmental chemistry of lakes and reservoirs, L.A. Baker
(Ed.). Advances in Chemistry Series no. 237, American Chemical Society, Washington DC, 223–284.
Stoddard, J.L. and Traaen, T., 1995. The stages of nitrogen saturation: Classification of catchments included in ”ICP on Waters”. In: Mapping and Modelling of Critical Loads for
Nitrogen, M. Hornung, M.A. Sutton and R.B. Wilson (Eds.).
Proceedings of the Grange-over-Sands Workshop 24-26 October 1994, Institute of Terrestrial Ecology, Penicuik, UK, 69–76. Tietema, A., Boxman, A.W., Bredemeier, M., Emmett, B.A.,
Moldan, F., Gundersen, P., Schleppi, P. and Wright, R.F., 1998. Nitrogen saturation experiments (NITREX) in coniferous forest ecosystems in Europe: a summary of results. Environ. Pollut.,
102, 403–407.
Tørseth, K. and Semb, A., 1997. Atmospheric deposition of nitrogen, sulfur and chloride in two watersheds located in southern Norway. Ambio, 26, 258–265.
Tørseth, K. and Semb, A., 1998. Deposition of nitrogen and other major inorganic compounds in Norway, 1992-1996. Environ.
Pollut., 102, 299–304.
UBA, 1996. Manual on Methodologies and Criteria for Mapping Critical Levels/Loads and geographical areas where they are
exceeded. UN/ECE Convention on Long-range Transboundary
Air Pollution, Federal Environmental Agency (Umweltbundesamt), Texte 71/96, Berlin, 144 pp.
Vitousek, P.M., Aber, J.D., Howarth, R.W., Likens, G.E., Matson, P.A., Schindler, D.W., Schlesinger, W.H. and Tilman, D.G., 1997. Human alteration of the global nitrogen cycle: Sources and consequences. Ecol. Appl., 7, 737–750.
Wade, A.J. and Whitehead, P.G., 2002. The prediction and management of aquatic nitrogen pollution across Europe: Comments on current issues and an introduction to a new initiative. Hydrol. Earth Syst. Sci., 299–313.
Williams, M.W., Brooks, P.D., Mosier, A. and Tonnesen, K.A., 1996. Mineral nitrogen transformations in and under seasonal snow in a high elevation catchment in the Rocky Mountains, United States. Water Resour. Res., 32, 3161–3171.
Wright, R.F., 1998. Effect of increased carbon dioxide and temperature on runoff chemistry at a forested catchment in southern Norway (CLIMEX Project). Ecosystems, 1, 216–-225.
Wright, R.F. and Traaen, T.S., 1992. Dalelva, Finnmark,
northernmost Norway: prediction of future acidification using
the MAGIC model. Report 2728, Norwegian Institute for Water
Research, Oslo, Norway, 17 pp.
Wright, R.F., Mulder, J. and Esser, J.M., 1999. Soils in mountain and upland regions of southwestern Norway: nitrogen leaching
and critical loads. Report 4130, Norwegian Institute for Water
Research, Oslo, Norway, 45 pp.
Wright, R.F., Kaste, Ø., Kjønaas, O.J., Mulder, J. and Stuanes, A., 2001. N retention and acidification in mountains and
heathlands. Progress report 2000-2001, Norwegian Institute for