Hydrol. Earth Syst. Sci., 14, 1365–1374, 2010 www.hydrol-earth-syst-sci.net/14/1365/2010/ doi:10.5194/hess-14-1365-2010
© Author(s) 2010. CC Attribution 3.0 License.
Hydrology and
Earth System
Sciences
Laboratory evidence for enhanced infiltration of ion load during
snowmelt
G. Lilbæk1,2and J. W. Pomeroy1
1Centre for Hydrology, University of Saskatchewan, Saskatoon, Saskatchewan, Canada 2Department of Renewable Resources, University of Alberta, Edmonton, Alberta, Canada
Received: 25 January 2010 – Published in Hydrol. Earth Syst. Sci. Discuss.: 24 February 2010 Revised: 22 June 2010 – Accepted: 11 July 2010 – Published: 29 July 2010
Abstract. Meltwater ion concentration and infiltration rate into frozen soil both decline rapidly as snowmelt progresses. Their temporal association is highly non-linear and a covari-ance term must be added in order to use time-averaged val-ues of snowmelt ion concentration and infiltration rate to cal-culate chemical infiltration. The covariance is labelled en-hanced ion infiltration and represents the additional ion load that infiltrates due to the timing of high meltwater concentra-tion and infiltraconcentra-tion rate. Previous assessment of the impact of enhanced ion infiltration has been theoretical; thus, experi-ments were carried out to examine whether enhanced infiltra-tion can be recognized in controlled laboratory settings and to what extent its magnitude varies with soil moisture. Three experiments were carried out: dry soil conditions, unsatu-rated soil conditions, and satuunsatu-rated soil conditions. Chloride solutions were added to the surface of frozen soil columns; the concentration decreased exponentially over time to sim-ulate snow meltwater. Infiltration excess water was collected and its chloride concentration and volume determined. Ion load infiltrating the frozen soil was specified by mass con-servation. Results showed that infiltrating ion load increased with decreasing soil moisture as expected; however, the im-pact of enhanced ion infiltration increased considerably with increasing soil moisture. Enhanced infiltration caused 2.5 times more ion load to infiltrate during saturated conditions than that estimated using time-averaged ion concentrations and infiltration rates alone. For unsaturated conditions, en-hanced ion infiltration was reduced to 1.45 and for dry soils
Correspondence to: G. Lilbæk ([email protected])
to 1.3. Reduction in infiltration excess ion load due to en-hanced infiltration increased slightly (2–5%) over time, being greatest for the dry soil (45%) and least for the saturated soil (6%). The importance of timing between high ion concentra-tions and high infiltration rates was best illustrated in the un-saturated experiment, which showed large inter-column vari-ation in enhanced ion infiltrvari-ation due to varivari-ation in this tem-poral covariance.
1 Introduction
Underneath a melting snowpack, the infiltrability of the stra-tum, whether it is frozen or unfrozen, determines the parti-tioning of meltwater into ponding water, overland flow, infil-tration to the organic layer and/or infilinfil-tration to the mineral soil (e.g., Hillel, 1998; Zhao and Gray, 1999). Infiltration excess water (i.e. overland flow and organic interflow) pri-marily ends up as rapid runoff, even where a well-developed organic layer exists (Carey and Woo, 2001; Quinton and Pomeroy, 2006). Water infiltrating the mineral layer often remains stored in the soil for a long period, eventually con-tributing to evaporation, percolating to groundwater, or end-ing up as slow interflow contributend-ing to stream flow.
through a stratum (Beven and Germann, 1982) resulting in an enhancement of the effect of enhanced infiltration of the ion load (Lilbæk and Pomeroy, 2007). They may origi-nate from e.g. biological activity (e.g., decayed plant roots, worm holes, animals), geological activity (e.g. fractures, dif-ferences in media), freeze-thaw cycles, or farm management practice (e.g., Hillel, 1998). The fractional volume of macro-pores may be quite small, however, the effects that they may have on flow phenomena such as infiltration, drainage, and the transport of solutes in saturated or near-saturated condi-tions are significant. A sufficient heat flow into the soil due to frozen conditions underneath the melting snowpack (i.e. in cold regions) may cause ponding water to refreeze, forming a basal ice layer (Woo and Heron, 1981). This will result in an alteration of both ion pathway and concentration. When basal ice is present, all water runs off and further ion con-centration enrichment occurs (Lilbæk and Pomeroy, 2008). Conversely, when partitioning occurs, enhanced infiltration of meltwater ion load can result in relatively dilute runoff water (Lilbæk and Pomeroy, 2007). Consequently, the rate and volume of snowmelt runoff depends not only on the melt intensity and amount of water in the snowpack, but also on the physical and thermodynamic properties of the underlying stratum.
The biggest difference between infiltration to unfrozen and frozen stratum is the presence of ice as a solid phase (e.g., Kane and Stein, 1983). Infiltration to frozen soil has been found to be governed by the structural, hydrological, and thermophysical characteristics of the soil (i.e. the initial moisture content (ice and water) and its distribution), mete-orological conditions, the heat flux of the infiltrating water, the soil-ice-water system’s temperature profile, and the in-duced freezing point depression due to solute concentrations (e.g., Kuznik and Bezmenov, 1963; Komarov and Makarova, 1973; Romanov et al., 1974). Changes in any of these pa-rameters may lead to changes in the infiltration rate. Tao and Gray (1994) have shown that the infiltration process into sea-sonal frozen soils is least sensitive to frozen soil temperature. Redistribution of soil moisture is important when quanti-fying the moisture content in frozen soil, as the changes in soil moisture over the course of winter directly affect the infiltration that can take place and thereby the soil water recharge from the snowpack (Kane and Stein, 1983; Granger et al., 1984). As the soil water freezes, formation of ice results in the water being confined in progressively smaller spaces. This causes a decrease in Gibb’s free energy of wa-ter, which causes migration of water to the freezing zone (Williams and Smith, 1989). The magnitude of the migra-tion is directly related to the moisture content; being greatest for lighter textured (i.e. sandy loam or loamy textured), wet soils (Gray et al., 1985). In soils that are dry at the time of freeze-up the migration of water is considered negligible. This migration can impact the enhanced infiltration of ion load in two ways. If the redistribution is towards the soil sur-face this will limit the infiltrability of the soil and thereby
the infiltration of ion load. Moisture migration downwards, away from the soil surface, increases the surface infiltrability, enhancing the effect of enhanced infiltration on the ion load. A factor that affects the freezing of infiltrating water is the lowering (depression) of the freezing temperature of the wa-ter (solution) compared to the pure solvent due to the pres-ence of solute (e.g., Masterton and Hurley, 1997). When wa-ter infiltrates a frozen stratum, some refreezing occurs upon contact with the stratum’s particles. As ice is formed, ion exclusion takes place, relocating some of the ions to a quasi-liquid layer on the surface of the ice (Davies et al., 1987). Subsequently, this leads to a further depression of the freez-ing point, as the concentration in this brine is greater than in the initially infiltrating solution.
Over the course of winter, seasonal snowpacks accumu-late ions as wet and dry deposition. Ion fractionation within snowpacks results in a two- to seven-fold enrichment of ma-jor ions in the initial meltwater (Johannessen and Henriksen, 1978). As melt progresses, ion concentrations decrease ex-ponentially causing up to 80% of the snowpack’s solute to be released during the initial one-third of snowmelt (Tran-ter, 1991), making early melt a major chemical event in ter-restrial and aquatic ecosystems (Jones, 1999). During in-filtration of snowmelt water to the organic and mineral soil layer, interflow waters can become highly concentrated caus-ing dramatic change to surface water chemistry (Peters and Driscoll, 1987). Changes in soil chemistry and microbiology (Abrahams et al., 1989) and episodic acidification of lakes and streams (Davies et al., 1987; Ikuta et al., 1999; Schindler, 1999) have been related to this rapid release of ions during spring freshet. Observed changes in ion retention and re-lease in snowmelt runoff over frozen soil have been corre-lated with the frozen moisture content of soil and their in-filtrability (Jones and Pomeroy, 2001). Thus, knowledge of the flow pathway of the snowmelt chemical load is important for determining the aquatic or terrestrial sink for these ions and the timing of ion delivery to water bodies (Lilbæk and Pomeroy, 2007).
Using Zhao and Gray’s (1999) parametric relationship for the cumulative mass of water that infiltrates a frozen mineral soil, F [kg m−2], and Stein et al.’s (1986) ex-pression for meltwater ion concentration as a function of time,Ci(t )[meq m−3], Lilbæk and Pomeroy (2007) showed
that the temporal association between infiltration rate,f (t ) [kg s−1m−2], and meltwater ion concentration, Ci(t ), is
highly non-linear, even though both decline rapidly with time. The study showed that the cumulative infiltration of snowmelt ions is enhanced by initially higher ion concentra-tion in meltwater and infiltraconcentra-tion rate. However, time aver-aged ion concentration, Ci, and infiltration, f /ρ, whereρ
[kg m−3] is the solution’s density, are far easier and more reliable to estimate than are concentrations and infiltration rates at any one time. Thus, in order to reliably calculate the cumulative ion load infiltrating a frozen soil,Fi [meq m−2],
G. Lilbæk and J. W. Pomeroy: Laboratory evidence for enhanced infiltration of ion load 1367
f (t )has to be added to the mean terms (Eq. 1). The covari-ance was found to be positive as both meltwater ion concen-tration and infilconcen-tration rate decrease with time.
Fi= t Z
0
Ci(t )·
f (t ) ρ dt=
Ci·f·t
ρ +cov[Ci(t ),f (t )]
=Ci·F
ρ +cov[Ci(t ),f (t )] (1)
The model by Lilbæk and Pomeroy (2007) assumes a lim-ited infiltration regime as defined by Granger et al. (1984) in which there are neither substantial macropores nor impeding basal ice layers as well as that the meltwater solute is con-servative and fully mixed at all times. The use of Zhao and Gray’s equation to estimate infiltration to mineral soils under an organic layer was assumed appropriate when the organic layer rapidly transfers water to the mineral soil surface (Lil-bæk and Pomeroy, 2007). A reasonable assumption where the organic layer is thin and porosity is high or organic layer macropores are abundant.
The covariance term was labelled enhanced infiltration by Lilbæk and Pomeroy (2007) and represents the additional ion load that infiltrates during snowmelt due to the combination of initially rapid infiltration rate and higher ion concentration in meltwater. Its magnitude was found to be governed by ini-tial snow water equivalent, SWE [kg m−2], average melt rate, M[kg s−1m−2], and the meltwater ion concentration factor, CF [(meq m−3)(meq m−3)−1]. However, a more specific la-bel is enhanced ion infiltration as it is the ion load that is enhanced, not the water mass. Consequently, the latter term will be used from here forward.
The here presented research focuses on enhanced ion in-filtration to frozen mineral soil. However, it is believed that enhanced ion infiltration takes place whenever partitioning of water occurs at the soil surface (Lilbæk and Pomeroy, 2007). Thus, it can take place in both frozen and unfrozen soils as well as in the organic and mineral soil layer. However, it is not the scope of this research to examine the impact of en-hanced ion infiltration for unfrozen soils or the organic layer. The objective of this paper is to examine whether en-hanced ion infiltration can be identified in a controlled lab-oratory experiment. It is hypothesized that average initial soil saturation will not influence enhanced ion infiltration in a limited infiltration regime but the distribution of initial soil moisture may. Thus, soil columns with different initial soil moisture contents were used. It was assumed that solutions released to the soil surface were conservative, fully mixed within each time step, and that mass and energy were con-served.
2 Methodology
Experiments were carried out in a temperature-controlled cryospheric environmental laboratory (CEL) containing a
dual refrigerating system (Heatcraft, BZ series) with a stable cooling capacity from +7.5 to −30◦C (±2◦C). The room
was sealed to prevent contamination of samples from dust and atmospheric particulates.
The experimental setup consisted of a 0.46 m long frozen soil column with a surface area of 0.004 m2(Fig. 1a). Each column consisted of an acrylonitrile butadiene styrene (ABS) pipe with a 1 mm mesh at the base. The column was filled with 30 mm of coarse quartz gravel (particle size was∼2– 3 mm) to prevent the overlying soil from exiting the column, ∼0.32 m of homogenized, dried, and grinded loamy soil col-lected at a forested site in the Marmot Creek Research Basin, Kananaskis Valley, AB (50◦560N, 115◦080W), and∼0.11 m of an in-situ soil sample from the same field site. The column was placed on top of∼70 mm of filter sand (particle size was ∼1 mm) to allow air to escape freely during the infiltration experiments.
Type-E thermocouples (TC) were placed at two depths within the column to monitor the temperature of the soil: one at the interface between the in-situ soil sample and the homogenized soil, and one towards the base of the column (∼0.34 m). The accuracy of the TC was±0.1◦C within the applied temperature range (Campbell Scientific, 2007). Tem-peratures were recorded every 10 s by a Campbell Scientific CR21X datalogger. In the first experiment the values were averaged and logged hourly; in the following two experi-ments, the values were averaged and logged every 10 min.
Copper pipe was coiled tightly around the ABS pipe and connected to a temperature-controlled refrigerated bath (RTE-DD8, Neslab). This allowed circulation of coolant, which was used to maintain frozen soil conditions during ex-periments. Filter sand was used to fill the voids between the coils. Insulation was wrapped around the outside of each col-umn for further insulation.
Three experiments were carried out, differing with re-spect to initial average soil saturation, SI [mm3mm−3],
which was estimated from average volumetric soil mois-ture,θ [mm3mm−3], and average soil porosity,φ, as SI=
θ/φ. Each experiment was conducted simultaneously on three soil columns (Fig. 1b). One experiment was con-ducted on air-dried soil, which hygroscopic water content (∼2%) was determined using standard oven-drying method (Levitt and Young, 2008). AverageSI for the dry soil was
1368 G. Lilbæk and J. W. Pomeroy: Laboratory evidence for enhanced infiltration of ion load
Page 1/1
Copernicus Publications
Bahnhofsallee 1e 37081 Göttingen Germany
Martin Rasmussen (Managing Director) Nadine Deisel (Head of Production/Promotion)
Contact
[email protected] http://publications.copernicus.org Phone +49-551-900339-50 Fax +49-551-900339-70
Legal Body
Copernicus Gesellschaft mbH Based in Göttingen Registered in HRB 131 298 County Court Göttingen Tax Office FA Göttingen USt-IdNr. DE216566440
Fig. 1. (A) Schematic drawing of soil column setup (not to scale). (B) Three soil columns set up with burettes over top in the cryospheric
environmental laboratory (CEL).
experimental use; averageSI was∼0.97 mm3mm−3.
Vol-umetric soil moisture in the columns were determined by weight; assuming a density of the water of 1000 kg m−3.
The dry and saturated conditions were selected to repre-sent the boundaries for the effect of enhanced ion infiltra-tion during infiltrainfiltra-tion to frozen soil and the infiltrability cases described as “unlimited” and “restricted” by Granger et al. (1984). For the dry soil, infiltration was assumed unlim-ited because the pore space was free of ice. For the saturated soil, infiltration was presumed restricted as a result of ice in the pore spaces. The unsaturated conditions represented a situation in-between, where part of the pore space was filled with ice, limiting infiltration.
The soil columns were allowed to freeze for a minimum of 12 h within the CEL at a room temperature of −2◦C (±2◦C). Circulation of coolant took place during this pe-riod too, allowing a rapid freezing (<4 h); the temperature of the coolant was−2◦C (±2◦C). The experimental setup caused the freezing of the soil to occur from the sides as well as top and bottom. This is not like in nature, where freezing generally occurs from the top; in areas where per-mafrost exists, freezing of the soil can also progress from be-low. The method of soil freezing will influence the migration of soil moisture that takes place during freezing of the soil (e.g., Male and Gray, 1981; Kane and Stein, 1983; Williams and Smith, 1989). However, redistribution of soil moisture is considered negligible in dry soils (i.e. the dry experiment) and only limited migration was expected in the unsaturated and saturated soil columns due to their highSI (e.g., Gray et
al., 1984).
The temperature in the CEL was increased just prior to ini-tiation of the experiments. Average room temperature dur-ing experiments was +1.6◦C (±1.2◦C). Small adjustments (±2◦C) of the coolant temperature were made throughout the experiments to ensure frozen soil conditions; these
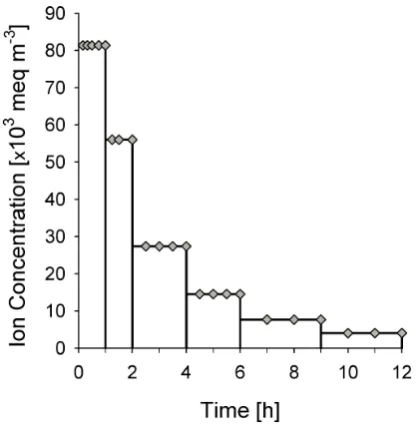
ad-Fig. 2. Changes in the applied chloride concentration over time
(line). The diamonds represents when sampling occurred.
[image:4.595.102.496.65.234.2] [image:4.595.324.534.295.509.2]G. Lilbæk and J. W. Pomeroy: Laboratory evidence for enhanced infiltration of ion load 1369
Table 1. Summary of experimental setup for each soil column.
Experiment Dry Unsaturated Saturated
Column # 1 2 3 1 2 3 1 2 3
Soil saturation,SI 0.06 0.06 0.06 0.85 0.83 0.81 0.97 0.95 0.98
[mm3mm−3]
Soil porosity, 0.46 0.47 0.47 0.42 0.45 0.42 0.43 0.43 0.43
φ
Dry bulk density 1441 1400 1407 1528 1463 1525 1514 1502 1513
[kg m−3]
Soil temperature −1.4±1.1 −0.9±0.8 −0.9±0.8 −1.2±1.2 −0.90.6 −0.8±0.6 −0.9±0.9 −0.7±0.4 −0.8±0.5 [◦C±stdev]
Precipitation rate 0.011 0.010 0.011 0.009 0.009 0.010 0.009 0.008 0.010
[kg s−1m−2]
[mm h−1] 38.5 37.6 40.2 32.9 31.6 36.4 32.0 30.2 36.2
head, would result in changing infiltration conditions as time progressed (i.e. enhance the rate of infiltration for the wa-ter). Thus, the maximum head was chosen to resemble observed field conditions. The chloride concentration de-creased exponentially from∼81 400 meq m−3(∼2890 ppm) to∼4060 meq m−3 (∼145 ppm) during the 12 h. Solutions were spiked compared to normal snow concentrations to achieve an enhanced indication of changes in ion load. All solutions were at room temperature (∼2◦C) when they were added. In each experiment, initial addition of solute to the soil surfaces of column 2 and 3 were delayed 25 and 50 min-utes, respectively, due to the timing of sample collection.
Infiltration excess water was collected using a syringe at increasing time intervals (Fig. 2). All water was collected each time to determine the mass of water that had infiltrated the soil as well as to avoid mixing of solutions once con-centrations changed. Samples were stored at 3◦C until an-alyzed (<24 h). Chloride concentrations were measured us-ing an Orion 290A meter with a chloride combination elec-trode (Orion 9617B). Detection sensitivity of the elecelec-trode was found to be 3 mV over 10 readings. Triplicate readings were done on all water samples, allowing<1.5 mV differ-ences between readings. Calibration curves had correlation coefficients of 0.99. Drift in electrode readings were checked every 10 samples and was<10%.
3 Results
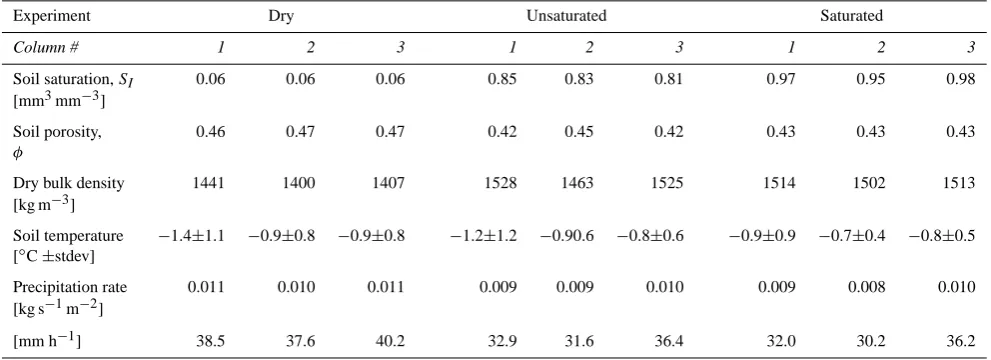
The experimental conditions of the nine soil column exper-iments are listed in Table 1. Major differences between the three experiments were due to the initial soil satura-tion. Differences in average porosity (∼0.05), dry bulk den-sity (∼125 kg m−3), average room temperature (0.1◦C), and average precipitation rates (<0.003 kg s−1m−2; 11 mm h−1)
were considered minor. The rates of precipitation were gen-erally higher than those found in nature. However, the over-flow valve ensured a maximum constant head, which was comparable to natural conditions (10 mm), and minimized the influence of the high and highly variable precipitation rates on the infiltration rate. The greatest inter-column vari-ability was observed for average soil temperatures, ranging between−0.7 and−1.4◦C, with standard deviations ranging between 0.4 and 1.2◦C. This variability was likely a result of the delay in additions of solute to columns 2 and 3, which allowed these columns to adjust to the room temperature in-crease for longer than did column 1. However, studies have shown that the effect of the soil temperature on infiltration is secondary to that of initial soil moisture (e.g., Komarov and Makarova, 1973; Granger et al., 1984; Zhao and Gray, 1997). In addition, the temperature at an advancing wetting front has been found to be rather independent of the initial temperature of a frozen soil (Zhao et al., 1997). Though, the variability may influence on the supply of latent heat as water refreezes, being greater in a colder soil, causing the soil temperature to increase faster. In general, the soil temperatures were all within the range of melt period soil temperatures observed in many seasonally frozen soils.
Ponding occurred after approximately two hours in the dry experiment (SI≈0.06 mm3mm−3), whereas it
occurred instantaneously in the saturated experiment (SI≈0.97 mm3mm−3). In the unsaturated experiment
(SI≈0.83 mm3mm−3), ponding took place almost
Table 2. Summary of infiltration results for each soil column.
Experiment Dry Unsaturated Saturated
Column # 1 2 3 1 2 3 1 2 3
Cumulative mass infiltrating, 119.7 119.3 120.0 19.4 39.6 16.7 12.2 6.3 7.7 F [kg s−1m−2]
Cumulative ion load infiltrating, 5953 6189 5643 870 2375 1174 1172 478 600 Fi [meq m−2]
–Fiif no covariance 2625 2721 2387 477 931 406 310 143 167 [meq m−2]
Normalized enhanced 1.27 1.27 1.37 0.87 1.56 1.92 2.90 2.21 2.42 infiltration, NEI
[(meq m−2)(meq m−2)−1]
Normalized infiltration 0.55 0.53 0.56 0.95 0.81 0.92 0.90 0.96 0.96 excess ion load, NRi
[(meq m−2)(meq m−2)−1]
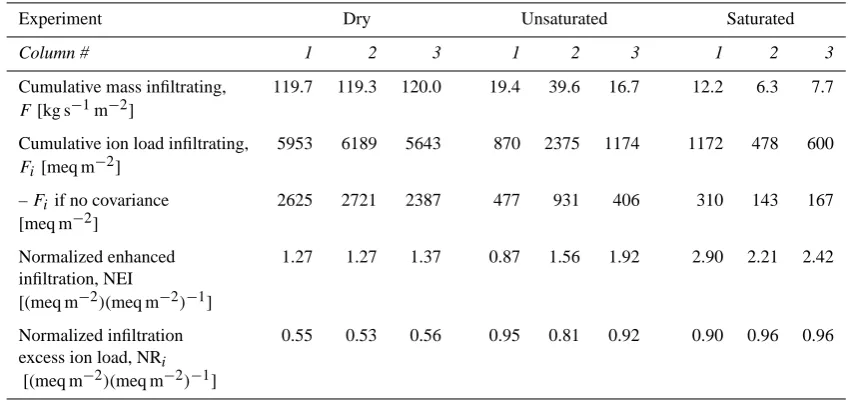
unsaturated and saturated soils, averageF were 25.2 kg m−2 and 8.7 kg m−2, respectively.
Chloride concentrations inP andRconfirmed the conser-vative behaviour of the solutions; differences between con-centrations were<10% and were assumed to be a result of instability in electrode readings. The ion load infiltrating the frozen soil,Fi [meq m−2], was estimated from conservation
of mass too,Fi=Pi−Ri, wherePi andRi are the ion load
in respectively precipitation [meq m−2] and infiltration ex-cess water [meq m−2]. All columns showed a rapid initial increase inFi followed by a quasi-steady state, as described
by Zhao et al. (1997) (Fig. 3). The transition occurred after ∼0.5 h for the saturated soil, after∼1.5 h for the unsaturated soil, and after∼2.0 h for the dry soil. The greatestFiwas
ob-served for the dry soil, with an average for the three columns of 5928 meq m−2; the lowestFi was observed for the
satu-rated soil, with an average of 750 meq m−2. Fi ranged
be-tween 870 and 2375 meq m−2 for the unsaturated soil with
an average of 1473 meq m−2.
To assess the magnitude of enhanced ion infiltration, the normalized enhanced ion infiltration, NEI [(meq m−2) (meq m−2)−1], was calculated for each column. NEI is de-fined as the ratio between the cumulative enhanced ion in-filtration and the cumulative ion inin-filtration estimated from only the time-averaged ion concentration and cumulative in-filtration, with no covariance (Lilbæk and Pomeroy, 2007):
NEI=cov[Ci(t ),f (t )] C
i·F ρ
=
Fi−
Ci·F ρ
C
i·F ρ
[image:6.595.311.541.322.544.2](2)
Fig. 3. Cumulative ion load infiltrating,Fi, for each soil column.
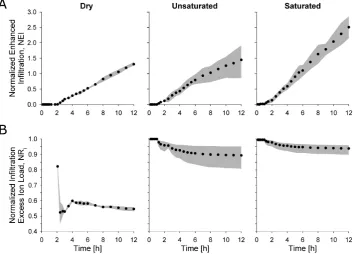
Figure 4a shows how NEI increased almost linearly with infiltration time in all three experiments. The aver-age rate of change was greatest for the saturated soil columns (slope=0.22 h−1)and least for the dry soil columns
G. Lilbæk and J. W. Pomeroy: Laboratory evidence for enhanced infiltration of ion load 1371
Fig. 4. Variation with time of (A) average normalized enhanced ion infiltration, NEI, and (B) average normalized infiltration excess ion load,
NRi, for each experiment. The grey area represents the range for the three columns.
alone (no covariance). For the dry soil, NEI ranged between 1.3 and 1.4 at the end of the experiment and for the unsat-urated soil, NEI ranged between 0.9 and 1.9; average NEI were 1.3 and 1.5, respectively. One of the columns in the un-saturated soil experiment changed slope after approximately 6 h, ending up with the lowest cumulative NEI of all the ex-periments (0.9).
The impact of enhanced ion infiltration on infiltration cess ion load was assessed by normalizing the infiltration ex-cess ion load, NRi [(meq m−2)(meq m−2)−1]. NRi is
de-fined as the ratio betweenRi and the difference betweenPi
andFi,due only to time-averaged ion concentration and
cu-mulative infiltration (no covariance) (Lilbæk and Pomeroy, 2007):
NRi=
Ri
Pi−
Ci·F ρ
=
Pi−Fi
Pi−(Fi−cov[Ci(t ),f (t )])
= Ri
Ri+cov[Ci(t ),f (t )]
(3) Calculations showed that after the initial one-third of the ex-perimental period (4 h), the ion load in the infiltration excess water was reduced due to enhanced ion infiltration (1−NRi)
by∼40% in the dry soil experiment, between 4% and 12% in the unsaturated soil experiment, and between 3% and 8% in the saturated soil experiment (Fig. 4b). A slight increase in the reduction, between 1% and 7%, was observed over the rest of the period. In general, ion loads in infiltration excess water over the dry soil columns increased the most and over
the saturated soil columns the least. The variation in totalRi
between columns was 3% in the dry soil experiment, 14% in the unsaturated soil experiment, and 6% in the saturated experiment.
4 Discussion
Three experiments were conducted, each in three replicates, to assess whether enhanced ion infiltration to frozen mineral soil could be recognized in controlled laboratory settings in addition to determining its magnitude. Each experiment dif-fered from the others with respect to initial soil saturation; differences in porosities, average room and soil temperatures, and average precipitation rates were minor (Table 1). The results show that enhanced infiltration of a conservative ion takes place once partitioning of meltwater added to a frozen mineral surface occurs.
the surface. Even so, extending the period over which the experiments were conducted was not thought to change the overall outcome; the individual values may change, but they will still show the same trend. With respect to the concentra-tions of the solute added to the soil surface, these were higher than normally observed during snowmelt (e.g., Lilbæk and Pomeroy, 2008). This was an attempt to enhance the indica-tion of changes in ion load and was not believed to impact the overall results either. The greatest effect that this may have had on the results is a depression of the solutions freezing point, but will most likely only have increased the infiltrat-ing mass and thereby increasinfiltrat-ing the impact of enhanced ion infiltration (discussed in more detail later).
It has previously been suggested that the cumulative mass that infiltrates frozen soil is inversely related to the initial moisture content of the soil (e.g., Gray et al., 2001) and that the effect of soil temperature on the cumulative infiltration is secondary (e.g., Komarov and Makarova, 1973; Granger et al., 1984). This was also observed for the experiments car-ried out in this study; greatest cumulative infiltrating mass was observed for the dry soil and least for the saturated soil. The inter-column variation could not be correlated with the inter-column variation in soil temperature indicating that it was of little importance for the general observations in this study. A similarly inverse relationship was demonstrated be-tween initial soil moisture content and cumulative infiltrating ion load; cumulative infiltrating ion load increased with de-creasing initial soil moisture (Table 2). Over the course of the infiltration, about 60% of the total ion load added to the soil surface of the dry soil infiltrated, varying little (∼1%) be-tween the columns; only 10% to 28% of the added ion load infiltrated the unsaturated soil, and between 6% and 13% in-filtrated the saturated soil.
The impact of enhanced ion infiltration increased with ini-tial soil moisture content. The largest normalized enhanced ion infiltration (NEI=2.90) was calculated for the first col-umn in the saturated experiment with∼50% difference to the other two saturated columns. This was most likely a result of the cumulative infiltrating mass being twice that of the other columns and that most of it infiltrated during the beginning of the experiment, while solute concentrations were high. The presence of soil macropores (i.e. cracks, roots) could account for the difference in infiltration, as the transport deeper into the soil would be more rapid than matrix flow alone (e.g., Beven and Germann, 1982). Consequently, the presence of macropores will enhance the effect of enhanced ion infiltra-tion due to this fast transfer of water deeper into the soil. However, no visual observations of macropores were made in any of the soil columns in either experiment. On aver-age, NEI in the saturated experiment was close to twice that of the other experiments, with 250% more ion load infiltrat-ing compared to only 131% when the soil was initially dry and 145% when the soil was unsaturated. Overall, NEI with respect to initial soil moisture ranked the experiments: satu-ratedunsaturated>dry soil conditions.
The change in slope of NEI for column 1 in the unsatu-rated experiment (Fig. 4a) was a result of the timing between high infiltration rate and meltwater ion concentration. Dur-ing the second half of the experiment, the cumulative infil-trated mass increased by roughly 50% for this column, com-pared to only 10% for the other two columns. This continu-ous infiltration throughout the experiment, even though at a very low rate (∼1 mm h−1), causes the cumulative ion load to increase continuously throughout the experiments. For the other columns, the infiltration rates became 0.0 mm h−1 dur-ing parts of this period, limitdur-ing the ion load infiltration.
Even though enhanced ion infiltration had the greatest im-pact on the saturated soil, the reduction in normalized infil-tration excess ion load 1−NRi; Fig. 4b) was almost
negligi-ble (∼5%). In contrast, enhanced ion infiltration had the least impact on the dry soil (NEI≈1.31) but the reduction in infil-tration excess ion load was almost 10 times greater than that of the saturated columns with a reduction between 44% and 47% (Fig. 4b). General ranking order for the reduction in in-filtration excess ion load with respect to initial soil moisture content was: dryunsaturated>saturated soil.
The unsaturated soil experiment showed the greatest inter-column variability in infiltration results (Table 2). Cumula-tive infiltrating mass for the second column (39.6 kg m−2) was twice that of the other columns, resulting in the great-est cumulative infiltrating ion load (2375 meq m−2)as well as greatest reduction in infiltration excess ion load (19%). Nevertheless, the third column had a cumulative infiltra-tion ion load that was half that of the second column (1174 meq m−2), with less than half the cumulative mass in-filtrating (16.7 kg m−2). The lowest cumulative infiltrating
ion load was observed in the first column (870 meq m−2),
even though its cumulative infiltrating mass was higher than that of the third column (19.4 kg m−2). This experiment showed the greatest range in normalized enhanced ion in-filtration and normalized inin-filtration excess ion load (Fig. 4), demonstrating the importance of timing between high melt-water ion concentration and infiltration rate.
A factor that may have influenced the experimental results was the high solute concentrations in the added water, which caused a depression (or lowering) of the freezing point. The freezing point depression,1Tf [◦C], can be calculated for
any solution as
1Tf =kf·m·i (4)
wherekf is the molal freezing point constant [◦C kg mol−1],
which is 1.86◦C kg mol−1for water,mis the molality of the
G. Lilbæk and J. W. Pomeroy: Laboratory evidence for enhanced infiltration of ion load 1373 Figure 5 shows how the depression of the freezing point
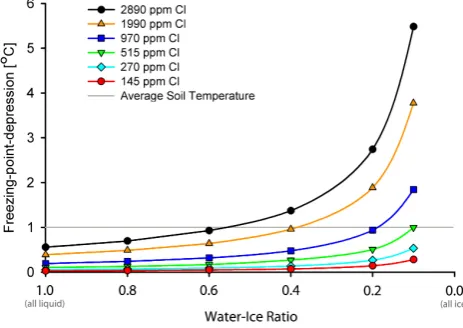
in-creases for each of the six solutions used in the experiments, as the volume of liquid water decreases. Initially, when all water is present as liquid (water-ice ratio=1.0), the freezing point depressions ranged from 0.03◦C for the 145 ppm Cl− solution to 0.6◦C for the 2890 ppm Cl−solution. As the so-lution freezes, water is present in both liquid and solid (ice) form. Subsequently, when only 20% of the initial water vol-ume is present as liquid (water-ice ratio=0.2), the freezing point depressions ranged from 0.13◦C for the 145 ppm Cl− solution to 2.8◦C for the 2890 ppm Cl− solution. The cal-culations assume that all Na+ and Cl− in solution are ex-cluded from the ice lattice, as the solubility of ions in ice is much less than in water (e.g., Smith and Haymet, 2004; Blackford et al., 2007); almost negligible. This assumption seems reasonable as reported solubility of HCl in ice range between 1 and 104mmol m−3(e.g., Domin´e et al., 1994); a
very small amount compared to the concentration of Cl− in
the here used solutions.
In this study, the solute concentrations added to the soil surfaces were greater than those typical of snowmelt water and rain; consequently, their freezing point depressions are larger than what will normally be observed in nature. Thus, unfrozen water was most likely present within the soils even though the soil temperatures were below zero; however, no measurements were done to confirm this. With average soil temperature of−1.0◦C, the freezing point depressions was most pronounced, and therefore of greatest influence, dur-ing the initial third of the experiment (Fig. 5). The result of this would therefore be a greater mass infiltrating the soil during this stage of the experiment, increasing the impact of enhanced ion infiltration. However, it was believed that the influence of the increased freezing point depression would be most pronounced for the dry soil, where infiltration was assumed unlimited, as refreezing would have been limited within the soil and thereby formation of limiting ice layers. The high initial saturations of the soils in the unsaturated and saturated experiments were believed to minimize the effect of the freezing point depression on cumulative infiltration.
5 Conclusions
Laboratory experiments with frozen loamy soil at different saturations showed that an enhanced infiltration of ions takes place during infiltration of meltwater to frozen soil due to the timing between initially higher infiltration rates and enriched ion concentrations in meltwater. The results demonstrated that the impact of enhanced ion infiltration was related to initial soil moisture content, with the greatest impact on sat-urated and near-satsat-urated soil. Even infiltration into dry soils may result in an enhanced ion infiltration of solute; in the presented experiment, it was shown to cause the greatest re-duction in infiltration excess water ion load. The results also show that synchronicity between the timing of high ion
con-Fig. 5. The change in freezing point depression for each of the
solu-tions used in the experiments as the liquid water content decreases. A water-ice ratio of 1.0 indicates that all water is present as liquid; a water-ice ratio of 0.0 indicates that all water is present as ice. The horizontal line represents average soil temperature during the ex-periments;−1◦C.
centration and infiltration rate greatly influence enhanced ion infiltration and therefore the flow path of snowpack ions dur-ing the melt and sprdur-ing runoff periods. Future work will fo-cus on examining whether enhanced ion infiltration can be identified in the field.
Acknowledgements. The authors would like to thank Michael Solo-hub for his help with the construction and building of the exper-imental setup. Also appreciated was instrumental help from Phil Marsh of Environment Canada and Charles Maul´e of the Col-lege of Engineering. Funding for the research was provided by the International Polar Year (IPY), Natural Sciences and Engineering Research Council of Canada (NSERC), Canada Research Chairs programme and Canada Foundation for Innovation (CFI).
Edited by: S. Carey
References
Abrahams, P. W., Tranter, M., Davies, T. D., and Blackwood, I. L.: Geochemical Studies in a Remote Scottish Upland Catchment, 2, Streamwater Chemistry during Snow-Melt, Water Air Soil Pol-lut., 43, 231–248, 1989.
Alexeev, G. A., Kaljuzhny, I. J., Kulik, V. Y., Pavlova, K. K., and Romanov, V. V.: Infiltration of snowmelt water into frozen soil, In: The role of snow and ice in hydrology, Symposia in Banff, Canada, 313–325, 1972.
Beven, K. and Germann, P.: Macropores and water flow in soils, Water Resour. Res., 18, 1311–1325, doi:10.1029/WR018i005p01311, 1982.
Jour-nal of Materials: Design and Applications, 221, 151–156, doi:10.1243/14644207JMDA134, 2007.
Carey, S. K. and Woo, M. K.: Slope runoff processes and flow gen-eration in a subarctic, subalpine catchment, J. Hydrology, 253, 110–129, 2001.
Campbell Scientific: CR3000 Micrologger Operator’s manual, Campbell Scientific Inc., Revised: 09/07 edition, 330 pp., 2007. Davies, T.D., Brimblecombe, P., Tranter, M., Tsiouris, S.,
Vin-cent, C. E., Abrahams, P., and Blackwood, I. L.: The removal of soluble ions from melting snowpacks, in: Seasonal snow-covers: physics, chemistry, hydrology, edited by: Jones, H. G. and Orville-Thomas, W. J., D. Reidel Publishing company, Dor-drecht, Holland, 337–392, 1987.
Domin´e, F., Thibert, E., Van Landeghem, F., Silvente, E., and Wagnon, P.: Diffusion and solubility of HCl in ice: preliminary results, Geophys. Res. Lett., 21, 601–604, 1994.
Granger, R. J., Gray, D. M., and Dyck, G. E.: Snowmelt Infiltration to Frozen Prairie Soils, Can. J. Earth Sci., 23, 669–677, 1984. Gray, D. M., Granger, R. J., and Dyck, G. E.: Overwinter Soil
Mois-ture Changes, Trans. Am. Soc. Agr. Eng., 28, 442–447, 1985. Gray, D. M., Toth, B., Zhao, L. T., Pomeroy, J. W., and Granger,
R. J.: Estimating areal snowmelt infiltration into frozen soils, Hydrol. Process., 15, 3095–3111, 2001.
Hillel, D:. Environmental Soil Physics, Academic Press, New York, USA, 771 pp., 1998.
Ikuta, K., Yada, T., Kitamura, S., Branch, N., Ito, F., Yamagichi, M., Nishimura, T., Kaneko, T., Nagae, M., Ishimatsu, A., and Iwata, M.: Effects of acidification on fish reproduction, UJNR Technical Report No. 28, 39–45, 1999.
Johannessen, M. and Henriksen, A.: Chemistry of snow meltwa-ter: Changes in ion concentration during melting, Water Resour. Res., 14, 615–619, 1978.
Jones, H. G.: The ecology of snow-covered systems: a brief overview of nutrient cycling and life in the cold, Hydrol. Pro-cess., 13, 2135–2147, 1999.
Jones, H. G. and Pomeroy, J. W.: Early spring snowmelt in a small boreal forest watershed: influence of concrete frost on the hy-drology and chemical composition of streamwaters during rain-on-snow events, Proceedings of the Eastern Snow Conference, Ottawa, Ontario, Canada, 58, 209–218, 2001.
Kane, D. L. and Stein, J.: Water movement into seasonally frozen soils, Water Resour. Res., 19, 1547–1557, 1983.
Komarov, V. D. and Makarova, T. T.: Effect of the ice content, tem-perature, cementation, and freezing depth of the soil on meltwa-ter infiltration in a basin, Soviet hydrology: selected papers, 3, 243–249, 1973.
Kuznik, L. A. and Bezmenov, A. L.: Infiltration of meltwater into frozen soil, Soviet Soil Science, 6, 665–674, 1963.
Levitt, D. G. and Young, M. H.: Soils: Hygroscopic Water Content, In: Encyclopedia of Water Science, Ed: SW Trimble, BA Stew-art and TA Howell, 2nd edition, CRC Press, USA, 1136–1139, doi:10.1081/E-EWS2-120010269, 2008.
Lilbæk, G. and Pomeroy, J. W.: Modeling enhanced infiltration of snowmelt ions into frozen soil, Hydrol. Process., 21, 2641–2649, doi:10.1002/hyp.6788 and 10.1002/hyp.6905, 2007.
Lilbæk, G. and Pomeroy, J. W.: Ion enrichment of snowmelt runoff water caused by basal ice formation, Hydrol. Process., 22, 2758– 2766, doi:10.1002/hyp.7028, 2008.
Male, D. H. and Gray, D. M.: Snowcover ablation and runoff, In: Handbook of snow – principles, processes, management and use, Ed: DM Gray and DH Male, Pergamon Press, UK, Chapter 9, 360–436, 1981.
Masterton, W. L. and Hurley, C. N.: Chemistry: Principles and Re-actions: a Core Text, Saunders College Publishing, USA, 3rd edition, 640 pp. and appendices, 1997.
Peters, N. E. and Driscoll, C. T.: Hydrogeologic Controls of Surface-Water Chemistry in the Adirondack Region of New-York-State, Biogeochemistry, 3, 163–180, 1987.
Quinton, W. L. and Pomeroy, J. W.: Transformations of runoff chemistry in the Arctic tundra, Northwest Territories, Canada, Hydrol. Process., 20, 2901–2919, doi:10.1002/hyp.6083, 2006. Romanov, V. V., Pavlova, K. K., and Kalyuzhnyy, I. L.: Meltwater
losses through infiltration into podzolic soils and chernozems, Soviet Hydrology: selected papers, 1, 32–42, 1974.
Schindler, D.: From acid rain to toxic snow, Ambio, 28, 350–355, 1999.
Smith, E. J. and Haymet, A. D. J.: Ion Solubility in Ice: Calculation of Potentially Favorable Positions of CI- and Na+ Ions in the SPC, Molecular Simulations, 30, 827–830, doi:10.1080/08927020410001709325, 2004.
Stein, J., Jones, H. G., Roberge, J., and Sochanska, W.: The predic-tion of both runoff quality and quantity by the use of an integrated snowmelt model, IAHS Publication, 155, 347–358, 1986. Tao, Y. and Gray, D. M.: Prediction of snowmelt infiltration into
frozen soils, Numerical heat transfer, Part A, 26, 643–665, 1994. Tranter, M.: Controls on the composition of snowmelt, in: Sea-sonal snowpacks: Processes of compositional change, edited by: Davies, T. D., Tranter, M., and Jones, H. G., Springer-Verlag, New York, USA, NATO ASI Series G, 28, 241–271, 1991. Williams, P. J. and Smith, M. W.: The frozen earth: fundamentals of
geocryology, Cambridge University Press, Cambridge, England, 1st paperback edition, 306 pp., 1989.
Woo, M. and Heron, R.: Occurrence of ice layers at the base of high arctic snowpacks, Arctic Alpine Res., 13, 225–230, 1981. Zhao, L. T. and Gray, D. M.: A parametric expression for estimating
infiltration into frozen soils, Hydrol. Process., 11, 1761–1775, 1997.
Zhao, L. T. and Gray, D. M.: Estimating snowmelt infiltration into frozen soils, Hydrol. Process., 13, 1827–1842, 1999.