169
AN EMPIRICAL EXAMINATION OF CHARACTERISTICS OF
MOBILE PAYMENT USERS IN INDONESIA
GUNAWAN WANG 1
,
NADIA MIRANDA PUTRI2,ARIO CHRISTIANTO 3,DANNY HUTAMA W 4.
1234Information Systems Management Department, BINUS Graduate Program – Master of Information
Systems Management, Bina Nusantara University, Jakarta, Indonesia 11480
E-mail: 1[email protected], 2[email protected], 3[email protected], 4danny.wong@
binus.ac.id
ABSTRACT
The current use of mobile devices is a necessity for almost all people, especially in Indonesia. A total of more than 100 million mobile phones have been used by the Indonesian people and approximately 150 million cellular cards have been registered in Indonesia. This is an opportunity for entrepreneurs in the technology field to take advantage of this business opportunity to create applications that use mobile devices such as banking applications. In Indonesia, banking applications have existed since 2007 and continue to grow until now with almost the same features. After testing the questionnaire, it was found that innovativeness, reachability, compatibility, convinience affect perceived usefulness and perceived ease of use towards the intention of use
Keywords: Mobile Payment, System Characteristics, Individual Differences, Mobile Payment Users
1. INTRODUCTION
Mobile payment attracts global attention from all sides of banking and the economy as an alternative payment that has been traditionally done, such as using cash, checks and debit / credit cards[1]. Mobile payment is part of the product resulting from the development of mobile
technology that offers specific solutions
specifically for the banking sector[2].
The use of mobile payment in Indonesia has been developed since 2007, during which the telecommunications company Telkom launched T-Cash as its mobile payment product. The development of mobile payment does not stop there, in the following years various companies, both telecommunications companies, and startups, innovate by issuing their respective payment brands.
Currently there are 246.29 million bank accounts in Indonesia [3] and until February 2018 as many as 290 million cellular cards have been successfully registered [4]. It can be interpreted from the data that there are more cellular card users than account holders in Indonesia. This also encourages the development of mobile payment in Indonesia because basically mobile payment usage does not require users to be registered as customers in a bank. That is why mobile money can be
divided into two, namely transactions with mobile banking and mobile payment.
Some differences between mobile payment and mobile banking, namely mobile banking is a financial transaction carried out through a mobile device against a bank account, while mobile payment is carried out using a mobile device without requiring a bank account[5].
170 This study aims to determine the characteristics of mobile payment users in Indonesia today. Of course the preference is to use and choose certain products rather than other products with the same purpose and function to use have different motivations from each individual. It is expected that this research can provide an overview to companies to provide mobile payment services that are in accordance with the characteristics of the target users so that they can be useful and useful on the market.
2. RESEARCH DESIGN
Similar research has been carried out by Kim et al[8] in which the study analyzed the effect of mobile payment characteristics and user centric factors on the use of mobile payments based on user characteristics.
To analyze the adoption of behavioral of mobile payment users, Kim et al used a research model consisting of two user-centric factors (personal innovativeness and mobile payment knowledge) and four characteristics of the mobile payment system (mobility, reachability, compatibility, and convenience). The study also categorizes user samples as early adopter and late adopter according to the results of testing.
The same testing model applied in writing this journal, is expected to get the perspective of mobile payment users in Indonesia, especially in the areas of Jakarta, Bogor, Depok, Tangerang, and Bekasi.
This study discusses how the characteristics of the Indonesian people towards the use of electronic money and how people in Indonesia view the use of electronic money which is gaining popularity today in Indonesia. Another reason why this study was conducted was to look at the intentions of the Indonesian people towards the use of mobile payments, considering that at this time the government was very aggressively promoting the use of non-cash payments.
The research written is a study using a framework based on the theory of acceptance model, the mobile payment system, the characteristics of the mobile payment system, and individual differences.
2.1. Theory Acceptance Model (TAM)
A number of studies related to public acceptance of technology have proven that TAM is the right model to describe the factors that
determine society's acceptance of technology since 1988. Since then TAM has evolved into a model that can predict human attitudes towards technology acceptance or rejection[9].TAM is the first model and the most influential model for research related to how information technology can be accepted in a condition and / or place. TAM intends to examine what factors can foster the desire of people or users to use a new technology. TAM consists of two dependent variables that support the user's desire to use technology namely perceived usefulness (PU) and perceived ease of use (PEU). Perceived usefulnes is defined as the level of individuals who believe that using technology can improve performance. Perceived ease of use is defined as the level of how individuals believe that using this new technology does not require a large effort[8].
Perceived Usefulness and Perceived Ease of Use are constructions proposed to form the intention to use new technology in TAM[10]. The prerequisite for consumers to consider the use or trial of any product or service is that new products must be useful and easy to use for consumers to intend to use the product[11]t. According to TAM, Perceived Usefulness (PU) is defined as "the extent to which a person believes that using a particular system will improve his job performance" and Perceived Ease of Use (PEOU) is defined as "the extent to which a person believes that using a particular system will be free from business. Both constructs influence one's attitude towards the system of use, which affects a person's behavioral intention to use the system, which in turn, determines the actual use of the system Underlines the importance of perceived usefulness criteria and perceived ease of use for receiving cellular payments [12][13][14].
2.2. Mobile payment
Mobile payment is an alternative method of
payment of goods, services, and others. This technology is used through mobile devices such as smartphones. Its use is quite easy, just by entering the transaction value and then confirming the payment made by entering a PIN or fingerprint scan[15].
171 through other wireless technologies such as (NFC, Bluetooth, RFID, etc.)[16].
Other studies also say that it is almost similar to the research conducted by Ghezzi et.al that mobile payment is a method of payment of any transactions made using mobile devices safely and through cellular networks and / or wireless networks.
2.3. Individual differences theory
Individual differences theory has been used to measure the level of individual acceptance of technology. Not only one but several studies have shown that differences in motivation of each individual affect the way of looking at and wanting to use technology.
This theory has been explained by many researchers that the differences in each individual affect their way of determining the use of something[17]. The supporting factors for individual differences can be measured by various factors. Factors that are considered suitable with this research are factors of innovation and user knowledge of technology.
Innovative factors are factors that state that innovative individuals tend to try many new things as experiences in their lives[18]. While the factor of knowledge of technology is the user who already understands the technology he uses starting from systems, software, and hardware [18].
The research model used in this study is a combination of two theories, namely model acceptance theory (TAM) and individual difference theory. This model is a research model conducted by [15] which is used for empirical research on the use of mobile payments for individuals. Individual Difference and system character are the two main constructs that have been recognized in previous studies. Individual Difference is considered as the most significant variable for IS success in the theoretical model proposed by Zmud (1979)[15]. In addition to task and technology characteristics, individual differences such as computer experience
and self-efficacy also affect technology
compatibility, which in turn determines individual performance and actual utilization[19].
2.4. Mobile payment system characteristics
As an emerging service, mobile payment has not received widespread adoption among users. As such, researchers have been paying attention to the behavior of mobile payment users and are trying to
identify factors that influence user adoption of mobile payments. Most research focuses on early adoption and TAM is often used as a theoretical foundation. Schierz et al.[2], noted that Perceived Risk, Perceived Usefulness, Perceived Ease of Use and Mobility affect user attitudes, which in turn affects the intention to use mobile payments. [8] argue that individual differences and system characteristics affect the intention to use mobile payment through Perceived Usefulness and Perceived Ease of Use. Individual Difference includes innovativeness and knowledge about mobile payments, while system characteristics include Mobility, Reachability, Compability, Convinience.
2.5. Research Hypothesis
1.Innovativeness
H1: User innovation has a positive effect on the perceived ease of use of mobile payment systems. Personal innovation in the information technology domain has implications for theory and practice. From a practical point of view, personal innovativeness helps identify individuals who tend to adopt information technology innovation than others. The individual can then function as the main change agent and opinion leader to facilitate further diffusion of new technology[20]. Agarwal and Prasad (1998) argue that individuals with higher personal innovativeness are expected to adopt previous innovations. They believe that to predict individual behavior towards an innovation, this construction must be conceptualized as a specific domain as opposed to other factors[21]. Previous findings about the influence of Personal Innovativeness are contradictory. For example, [22]in their study of cellular service acceptance, finding Personal innovation as a significant predictor of both Perceived Usefulness and Perceived Ease of Use factors. The same is reported by [23] in the case of an NFCenabled cellular credit card. In the study of the continuation of intentions towards mobile commerce, [21]found the Personal Innovativeness as a significant antecedent of statistics from Perceived Ease of Use. The same is reported in the case of NFC cellular payments [24] [14] (Free et al., 2013) [25].
172 that M-Payment adoption can result in benefits from increased speed and convenience through contactless payments. Inhibitors can cover the level of perceived risk, namely the risks associated with
security, privacy, personal data and
transactions[26].
2. Mobility
H3a: System mobility has a positive effect on perceived ease of use of M-Payment System. H3b: System mobility has a positive effect on the perceived usefulness of M-Payment System. While the progress of mobile devices is changing rapidly, important similarities remain the same as priority: portability, mobility, and flexibility[27]. Durability is an important component of mobile technology because of its profitability and associated mobility. The electronics industry has long invested in energy-saving technology by working to develop low-power CPUs, disk storage and display screens[15]. Technological advances and increased computer processing power mean that one mobile device such as a smartphone and PDA phone is increasingly able to perform high-level performance in many or all of these functions. Features of cellular technology that can make them very appropriate to provide individual level support to consumers[28]. It should be noted that this previous study found that mobility revealed a direct and positive impact on Perceived Usefulness and Perceived Ease of Use. Similar results were confirmed when assessing the study conducted by Liébana-Cabanillas et al. (2015a) and nfcde Luna et al. (2016)[25].
3.Reachability
H4a: Reachability of the system has a positive effect on perceived ease of use of M-Payment System.
H4b: Reachability of the system has a positive effect on the perceived usefulness of M-Payment System.
The use of a mobile system allows users to always be connected to service providers. In their daily life, this means that the existing mobile system must be able to be used in many areas, including areas that are said to be not / rarely reached by mobile payment facilities.
In addition to the affordability of the area of technology use, another thing that is also a consideration is the ability of the mobile payment system to be able to limit the number of accesses entered into one account[29].
4.Compatibility
H5a: Compatibility system has a positive effect on perceived ease of use of M-Payment System. H5b: Compatibility system has a positive effect on the perceived usefulness of M-Payment System.
Perceived compatibility and perceived usefulness are related to two different stages in the adoption process; then the relationship between these two variables is suggested. The consistency of the habits and beliefs of potential users with the technology that will be adopted seems to be in accordance with the belief that this technology might be more useful for users who adopt technology than other technologies that may not suit their lifestyle. Significant influence of Compatibility perceived in both, Perceived Usefulness and Perceived Ease of Use has been confirmed by several studies of m-payment adoption [1], [23]. In addition, a significant relationship between Compatibility perceived and Perceived Usefulness was confirmed by Hernandez García et al. (2011), Liébana-Cabanillas et al. (2015a), Ramos de Luna et al. (2016), Schierz et al. (2010) and Wu and Wang (2005) while a
significant relationship between perceived
Compatibility and Perceived Ease of Use was confirmed by Ozturk et al. (2016). On the other hand, in the study of factors influencing the intention to use mobile payment, Kim et al. (2010) found no significant evidence of the effect of perceived compatibility in Perceived Usefulness and Perceived Ease of Use
5.Convenience
173 is in the same context as Perceived Usefulness and Perceived Ease of Use [35][34].
6. Perceived Ease of Use
H7a: Perceived ease of use in using technology has a positive effect on the perceived usefulness of M-Payment System.
H7b: Perceived the ease of use in using technology has a positive effect on the intention of use of M-Payment System.
This factor is one of the supporting factors for TAM. This factor clearly explains that the easy use of applications or systems by users can increase the desire of users to use the technology.
7.Perceived Usefulness
H8: User usefulness towards technology has a positive effect on the M-Payment System's intention of use.
Perceived usefulness is a TAM factor that can determine how much the user wants to use technology.
3. METHODOLOGY
3.1 Research Method
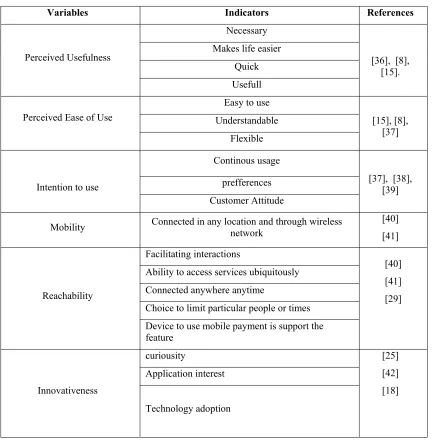
[image:5.612.92.524.295.738.2]Based on our search results, we can create a measurement tool to measure results and the value of a variable goes through several indicators such as the table below.
Table 1. Variable measurements
Variables Indicators References
Perceived Usefulness
Necessary
[36], [8], [15]. Makes life easier
Quick Usefull
Perceived Ease of Use
Easy to use
[15], [8], [37] Understandable
Flexible
Intention to use
Continous usage
[37], [38], [39] prefferences
Customer Attitude
Mobility Connected in any location and through wireless network [40]
[41]
Reachability
Facilitating interactions
[40] [41] [29] Ability to access services ubiquitously
Connected anywhere anytime
Choice to limit particular people or times Device to use mobile payment is support the feature
Innovativeness
curiousity [25]
[42] [18] Application interest
174
Variables Indicators References
M-Payment knowledge
Understand technology to ease the activity
[8] Understand how to use the feature
Understand the feature’s goals of use
Convenience
Time utilities
[8] [43] Access to device
Place utilites
Application complexity
Compatibility
compatible
[44], [38], [39] Work style
[image:6.612.120.490.336.606.2]Life style
Fig. 1. Research Model [8]
The analysis was carried out by conducting a survey in the form of a questionnaire to 100 people living in Jakarta, Bogor, Depok, Tangerang, and Bekasi areas. The criteria of the community that become the sample with the age range between 17-50 years where this age is the productive age of the community in Indonesia from students to office workers.
175
accustomed to using the m-payment facility because we wanted to know why they used m-payment and what types of m-m-payments they often used in transactions and what was the reason they used the brand. This questionnaire is sent through Google forms, forums and social media. There were 100 respondents who were collected in several brand m-payments. Table 2 shows the results of the respondent's data as a customer from the m-payment that we present, namely Grab Pay / GO-PAY, OVO, T-Cash, Etc.
Table 2. Description of the respondents based on E-Marketplace
Brand
M-Payment Respondents Valid Percentage
BCA
M-Banking 9 9%
Grab
Pay/GO-PAY 74 74%
OVO 12 12%
Others 5 5%
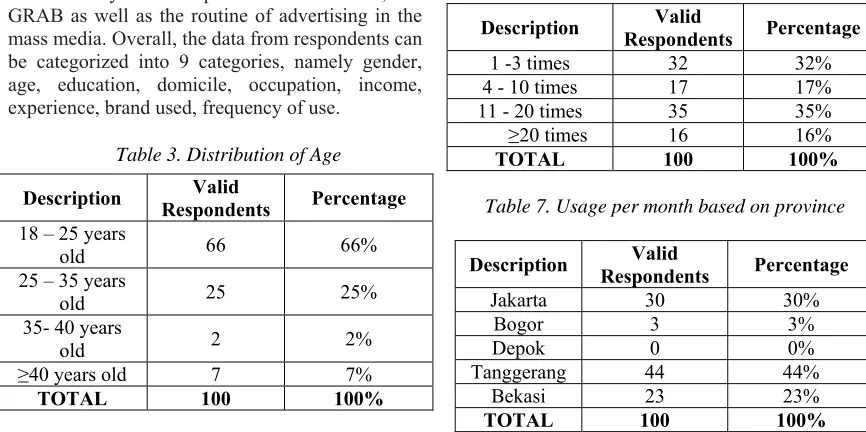
You can see the data from table 2 shows that Grab Pay / GO-PAY is a brand m-payment that is often used by customers in Jabodetabek today. On the other hand, OVO is actually a new player in this field, but its customers can compete with customers from BCA. While others still choose other brands that play in this sector. But the superiority of Grab Pay / GO-PAY can also be influenced by the widespread use of GO-JEK, and GRAB as well as the routine of advertising in the mass media. Overall, the data from respondents can be categorized into 9 categories, namely gender, age, education, domicile, occupation, income, experience, brand used, frequency of use.
Table 3. Distribution of Age
Description Respondents Valid Percentage
18 – 25 years
old 66 66%
25 – 35 years
old 25 25%
35- 40 years
old 2 2%
≥40 years old 7 7%
[image:7.612.312.528.105.169.2]TOTAL 100 100%
Table 4. Distribution of Gender
Description Respondents Valid Percentage
Male 41 41%
Female 59 59%
TOTAL 100 100%
[image:7.612.80.530.260.352.2]Data from table 4 can show that both male and female are equally active in using this m-payment. From these results, of course they are respondents who can be understood and can use this m-payment technology properly.
Table 5. Distribution of Education
Description Respondents Valid Percentage
High Schools 18 18%
Diploma 7 57%
Bachelor 67 67%
Master 8 8%
TOTAL 100 100%
The data shown in table 5 shows that the undergraduate level is the most active in using this m-payment, because at the undergraduate level they are people who have sufficient knowledge and always keep up with the changing times. This was followed by users from the High School level where at their age the level of curiosity about something new and sophisticated was quite high.
Table 6. Usage per month (Period August 2018).
Description Respondents Valid Percentage
1 -3 times 32 32%
4 - 10 times 17 17%
11 - 20 times 35 35%
≥20 times 16 16%
[image:7.612.86.519.480.696.2]TOTAL 100 100%
Table 7. Usage per month based on province
Description Respondents Valid Percentage
Jakarta 30 30%
Bogor 3 3%
Depok 0 0%
Tanggerang 44 44%
Bekasi 23 23%
TOTAL 100 100%
Can be seen from the data in table 6, the respondents used the m-payment services can be said often enough that in 1 month they can use this
176
[image:8.612.88.533.59.253.2]seen in table 7 which uses the m-payment and then followed by users from Jakarta and Bekasi. They - they are users who use the service quite often
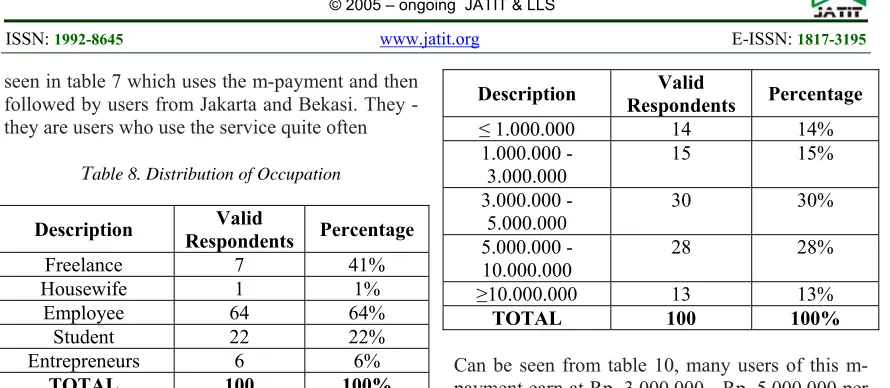
Table 8. Distribution of Occupation
Description Respondents Valid Percentage
Freelance 7 41%
Housewife 1 1%
Employee 64 64%
Student 22 22%
Entrepreneurs 6 6%
TOTAL 100 100%
Table 8 shows that these m-payment users are mostly from users who work as employees, this is understandable because employees are a real work every day. This use is also supported because some of them are Gojek users, and Grab is sure to save time, their pengabayran process uses m-payment.
Table 9. Distribution of User experience
Description Respondents Valid Percentage
≤1 years 25 32%
1 – 2 years 38 38%
2 - 3 years 17 17%
≥3 years 20 16%
TOTAL 100 100%
The data in table 9 shows that most of these m-payment users have used this service for 1-2 years. This is only natural because from the data we get those who use this service the most are new scholars who have jobs. But we can also conclude that these users include users who are very responsive to the times.
Table 10. Distribution of Expenditure per month outside installment luxury goods
Description Respondents Valid Percentage
≤ 1.000.000 14 14%
1.000.000 -
3.000.000 15 15%
3.000.000 -
5.000.000 30 30%
5.000.000 - 10.000.000
28 28%
≥10.000.000 13 13%
TOTAL 100 100%
Can be seen from table 10, many users of this m-payment earn at Rp. 3,000,000 - Rp. 5,000,000 per month. This data can be supported by many young and new users. And the standard UMR salary in Indonesia is in the range of Rp. 3,000,000 - Rp. 5,000,000 per month. This is one factor why many users have an income of Rp. 3,000,000 - Rp. 5,000,000 per month using this service.
4. FINDINGS AND DISCUSSION
4.1 Validity and Realibility Test
Descriptive statistics are used for sample demographic analysis. Test of validity and relaibility is measured using CR to assess internal consistency of data measurement. Structural Equation Modeling (SEM) was applied using the SmartPls software package to test the hypothesis (SEM) of the proposed research model. SEM is useful for evaluating casual relationships between variables and compatibility of research models. From the data we have obtained, we have been using statistical software, SmartPLS. Tests carried out are validity and reliability simultaneously, the value of the variables that we have can have valid
177
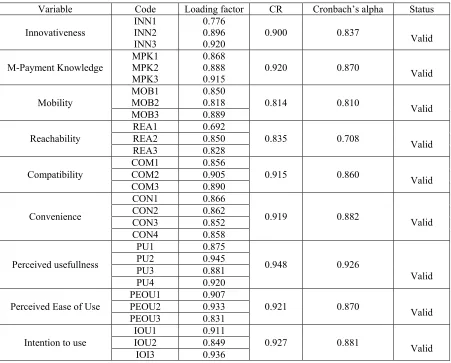
Table 11. Validity and reliability Test
CR ≥ 0.70
4.2 Hypotesis Test
Based on table 4 above the value of each variable innovativenss, M-Payment Knowledge, mobility, reachibility, compatibility, compatibility, convinience, perceived usefulness, perceived ease of use, intention of use has a CR value that exceeds from 0.70 then data from our findings can said to be valid and reliable. Moreover, the CR value of each variable has more value than Cronbach's alpha. If all online data for each variable and indicator are valid, this test can proceed to the next step, namely hypothesis testing. The analytical method used to test the hypothesis is the analysis of structural equation modeling (SEM) variables Innovativeness to perceived usefullness (H1), M-payment knowledge to perceived usefullness (H2), Mobility to perceived ease of use (H3a), Mobility to perceived usefullness ( H3b), Reachability to perceived ease of use (H4a), Reachability to
perceived usefullness (H4b), Compatibility to perceived ease of use (H5a), Compatibility to perceived usefulness (H5b), Convenience to perceived ease of use (H6a), Convenience to perceived usefullness (H6b), Perceived ease of use to perceived usefulness (H7a), Perceived ease of use to use (H7b), Perceived usefulness to intention of use (H8). The conclusion of this test is support or not support the value
of certain variables on other variables. This test is carried out using a comparison method of the value of p value calculated by formula (1 - P) which will be compared with the value of 0.75 / 0.85 as the representative of the population of the respondents. With the provision if the p value is <0.75 / 0.85, then the variable can be said not to support, and if p value> 0.75 / 0.85 then the variable can be said as a variable that supports and has an influence on the variable in question.
Variable Code Loading factor CR Cronbach’s alpha Status
Innovativeness INN1 INN2
INN3
0.776 0.896 0.920
0.900 0.837 Valid
M-Payment Knowledge MPK1 MPK2
MPK3
0.868 0.888
0.915 0.920 0.870 Valid
Mobility
MOB1
MOB2 0.850 0.818 0.814 0.810 Valid
MOB3 0.889
Reachability
REA1 0.692
0.835 0.708 Valid
REA2 0.850
REA3 0.828
Compatibility
COM1 0.856
0.915 0.860 Valid
COM2 0.905
COM3 0.890
Convenience
CON1 0.866
0.919 0.882 Valid
CON2 0.862
CON3 0.852
CON4 0.858
Perceived usefullness
PU1 0.875
0.948 0.926
Valid
PU2 0.945
PU3 0.881
PU4 0.920
Perceived Ease of Use
PEOU1 0.907
0.921 0.870 Valid
PEOU2 0.933
PEOU3 0.831
Intention to use
IOU1 0.911
0.927 0.881 Valid
IOU2 0.849
178
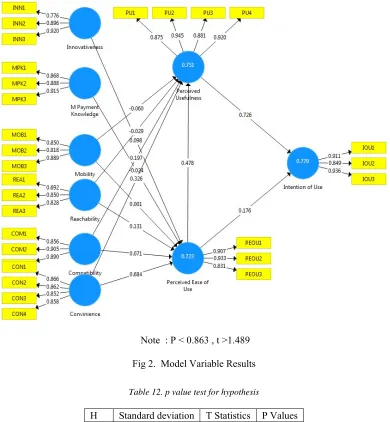
[image:10.612.112.502.111.533.2]Note : P < 0.863 , t >1.489
Fig 2. Model Variable Results
Table 12. p value test for hypothesis
H Standard deviation T Statistics P Values
H1 0,055 1,765 0,078
H2 0,089 0,275 0,784
H3a 0,089 0,014 0,989
H3b 0,099 0,608 0,543
H4a 0,079 1,667 0,096
H4b 0,063 0,451 0,652
H5a 0,097 0,728 0,467
H5b 0,132 1,488 0,137
H6a 0,125 5,477 0,0000
H6b 0,155 2,102 0,036
H7a 0,139 3,454 0,001
H7b 0,108 1,623 0,105
179
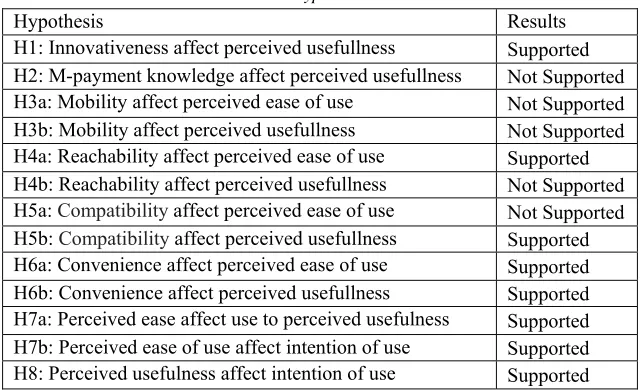
Table 13. Hypothesis Result
Note : P < 0.863 , t >1.489 4.1. Validity and Realibility Test
4.3 Discussion
In this study, the authors used TAM as a research model. From the use of this theory, it is hoped that it can unravel what kind of user category has the desire to use mobile payment technology in the Indonesian community. Based on the findings obtained after distributing questionnaires related to the use of mobile payments for people in Indonesia, especially in the Jabotabek area, this research also categorizes users from mobile payments. Research conducted shows that user innovativeness greatly influences perceived ease of use of mobile payments. This is consistent with research conducted by [8]that innovative users tend to feel that the use of mobile payments is easy. This study also proves that reachability affects perceived ease of use of mobile payment users. In addition, it was also found that the system compatibility does not affect perceived ease of use but affects perceived usefulness. This is different from the results of the study [8] whose research results state that compatibility indicators do not have a good effect on perceived ease of use or perceived usefulness. It was also proven that the convenience felt by users when using mobile payment technology turned out to affect perceived usefulness and perceived ease of use of mobile payments. Another finding was that mobile payment knowledge had no effect on perceived ease of use. Besides that mobility does not have an effect on perceived usefulness and also on perceived ease of use. While reachability does not affect perceived usefulness and compatibility it does not affect the perceived ease of use. Overall,
perceived usefulness is influenced by
compatibility, convinience, and perceived ease of use.
The challenge in conducting this test is the attitude of the community that is difficult to participate in filling out the questionnaire. Most of them have no interest in filling out surveys and some claim that they have not used electronic money on the grounds that there is no need or no need for electronic money.
The results of this study show that both perceived usefulness and perceived ease of use significantly affect the intention of mobile payment use. Of all the variables tested, it is evident that perceived ease of use of mobile payment has a very significant effect on perceived usefulness. This proves that with the easier use of mobile payments, users will increasingly feel the usefulness of the mobile payment facility. Based on the results of this study, perceived usefulness has a positive influence on the intention of use. Mobile payment in the future must be easy to use and not complex so that it increases the intention of use from its users.
5. CONCLUSION
The main objective of this study is to find the factors that are the reason why users use the mobile payment facility. This study uses TAM modeling which consists of six external factors (innovativeness, mobile payment knowledge,
mobility, reachability, compatibility, and
convenience), two independent variables
Hypothesis Results
H1: Innovativeness affect perceived usefullness Supported
H2: M-payment knowledge affect perceived usefullness Not Supported
H3a: Mobility affect perceived ease of use Not Supported
H3b: Mobility affect perceived usefullness Not Supported
H4a: Reachability affect perceived ease of use Supported
H4b: Reachability affect perceived usefullness Not Supported
H5a: Compatibility affect perceived ease of use Not Supported
H5b: Compatibility affect perceived usefullness Supported
H6a: Convenience affect perceived ease of use Supported
H6b: Convenience affect perceived usefullness Supported
H7a: Perceived ease affect use to perceived usefulness Supported
H7b: Perceived ease of use affect intention of use Supported
180 (perceived ease of use and perceived usefulness), and one independent variable (intention of use) . Having a little uniqueness from other research that has been done in Indonesia, this time the study uses a research model not only related to information systems but combines with the characteristics of technology usage by users. Research that combines TAM and the characteristics of these users is not the first to be done, before this research has been tested by (Kim et al., 2010). The study conducted this time wanted to know how influential the combination of TAM and characteristic models would be if tested to mobile payment users in the Indonesian region, namely the Jabotabek area.
The results of the analysis stated that perceived ease of use and perceived usefulness significantly affected the intention of use. Whereas perceived usefulness is signi fi cantly supported by compatibility, convinience, and perceived ease of use. For variables perceived ease of use is
significantly supported by convinience,
innovativeness, and reachability factors. The things that have been explained in the previous paragraph have shown that in order to achieve the success of the mobile payment provider in attracting users to use their products, the product must be easy to use so that the user will feel that the mobile payment product is useful and can deliver positive value to the user resulting in intention of use from the user to the mobile payment product.
5.1 Limitation and further studies
The limitations on the work of this journal are the test samples taken in Indonesia with the sample areas of Jakarta, Bogor, Depok, Tangerang, and Bekasi. Tests are not carried out in other areas other than those specified. Tests were carried out on 100 randomly selected people ranging in age from 17-50 years and domiciled in the area previously mentioned.
For the next type of research, it should be done in the wider area of users of electronic money so that it can capture the characteristics of real users of electronic money in the area under study.
REFERENCES
[1] T. Oliveira, M. Thomas, G. Baptista, and
F. Campos, “Mobile payment:
Understanding the determinants of
customer adoption and intention to
recommend the technology,” Comput.
Human Behav., vol. 61, pp. 404–414,
2016.
[2] P. G. Schierz, O. Schilke, and B. W.
Wirtz, “Understanding consumer
acceptance of mobile payment services:
An empirical analysis,” Electron. Commer.
Res. Appl., vol. 9, no. 3, pp. 209–216,
2010.
[3] D. Hariyanti, “Januari 2018, Ada 246,29
Juta Rekening di Bank Umum,”
Bisnis.com, 2018. .
[4] Agus Tri Haryanto, “Detail Jumlah
Pelanggan Operator yang Registrasi SIM
Card,” detik.com, 2018. .
[5] Untoro, R. A. Trenggana, and K. Dewi,
“Pemetaan Produk Dan Risiko
Pembayaran Bergerak ( Mobile Payment ) Dalam Sistem Pembayaran Di Indonesia,” pp. 1–73, 2013.
[6] Jeffrey Bahar, “Mobile Money in
Indonesia: Landscape and Developments, 2015,” 2015.
[7] R. Eka, “Tren Perkembangan ‘Mobile
Payment’ di Indonesia,” 2018. .
[8] C. Kim, M. Mirusmonov, and I. Lee, “An
empirical examination of factors
influencing the intention to use mobile
payment,” Comput. Human Behav., vol.
26, no. 3, pp. 310–322, 2010.
[9] N. Marangunić and A. Granić,
“Technology acceptance model: a
literature review from 1986 to 2013,”
Univers. Access Inf. Soc., vol. 14, no. 1,
pp. 81–95, 2015.
[10] F. D. Davis, “Perceived usefulness,
perceived ease of use, and user acceptance
of information technology,” MIS Q., pp.
319–340, 1989.
[11] R. Thakur and M. Srivastava, “Adoption
readiness, personal innovativeness,
perceived risk and usage intention across customer groups for mobile payment
services in India,” Internet Res., vol. 24,
no. 3, pp. 369–392, 2014.
[12] N. Mallat, “Exploring consumer adoption
of mobile payments - A qualitative study,”
J. Strateg. Inf. Syst., vol. 16, no. 4, pp.
413–432, 2007.
[13] L. da Chen, “A model of consumer
acceptance of mobile payment,” Int. J.
Mob. Commun., vol. 6, no. 1, p. 32, 2008.
[14] E. Bash et al., “the Adoption Intention of
Near Field Communication (Nfc) -
Enabled Mobile Payment Among
181 vol. 26, no. 1, pp. 319–340, 2015.
[15] E. Park and K. J. Kim, “An integrated
adoption model of mobile cloud services: Exploration of key determinants and extension of technology acceptance
model,” Telemat. Informatics, vol. 31, no.
3, pp. 376–385, 2014.
[16] A. Ghezzi, F. Renga, R. Balocco, and P.
Pescetto, “Mobile payment applications: Offer state of the art in the Italian market,”
Info, vol. 12, no. 5, pp. 3–22, 2010.
[17] R. Agarwal and J. Prasad, “Are individual
differences germane to the acceptance of
new information technologies?,” Decis.
Sci., vol. 30, no. 2, pp. 361–391, 1999.
[18] C. Demangeot and A. J. Broderick,
“Consumer Perceptions of Online
Shopping Environments,” Psychol. Mark.,
vol. 30, no. 6, pp. 461–469, 2010.
[19] T. Zhou, Y. Lu, and B. Wang, “Integrating
TTF and UTAUT to explain mobile
banking user adoption,” Comput. Human
Behav., vol. 26, no. 4, pp. 760–767, 2010.
[20] R. Agarwal and J. Prasad, “A Conceptual
and Operational Definition of Personal Innovativeness in the Domain of
Information Technology,” Inf. Syst. Res.,
vol. 9, no. 2, pp. 204–215, 1998.
[21] J. Lu, “Are personal innovativeness and
social influence critical to continue with
mobile commerce?,” Internet Res., vol. 24,
no. 2, pp. 134–159, 2014.
[22] T. Zarmpou, V. Saprikis, A. Markos, and
M. Vlachopoulou, “Modeling users’
acceptance of mobile services,” Electron.
Commer. Res., vol. 12, no. 2, pp. 225–248,
2012.
[23] L. Y. Leong, T. S. Hew, G. W. H. Tan,
and K. B. Ooi, “Predicting the determinants of the NFC-enabled mobile credit card acceptance: A neural networks
approach,” Expert Syst. Appl., vol. 40, no.
14, pp. 5604–5620, 2013.
[24] I. Ramos-de-Luna, F. Montoro-R\’\ios,
and F. Liébana-Cabanillas, “Determinants of the intention to use NFC technology as a payment system: an acceptance model
approach,” Inf. Syst. E-bus. Manag., vol.
14, no. 2, pp. 293–314, 2016.
[25] F. Liébana-Cabanillas, V. Marinkovic, I.
Ramos de Luna, and Z. Timesnic, “Predicting the determinants of mobile payment acceptance: A hybrid
SEM-neural network approach,” Technol.
Forecast. Soc. Change, vol. 129, no.
October, pp. 117–130, 2018.
[26] Y. Pan, A. Jacobs, and C. Tan,
Digitalisation, Innovation, and
Transformation, vol. 527. Springer
International Publishing, 2018.
[27] C. K. Looi, P. Seow, B. Zhang, H. J. So,
W. Chen, and L. H. Wong, “Leveraging
mobile technology for sustainable
seamless learning: A research agenda,” Br.
J. Educ. Technol., vol. 41, no. 2, pp. 154–
169, 2010.
[28] C. Free et al., “The Effectiveness of
Mobile-Health Technology-Based Health
Behaviour Change or Disease
Management Interventions for Health Care
Consumers: A Systematic Review,” PLoS
Med., vol. 10, no. 1, 2013.
[29] D. Pal, V. Vanijja, and B. Papasratorn,
“An Empirical Analysis towards the Adoption of NFC Mobile Payment System
by the End User,” Procedia Comput. Sci.,
vol. 69, pp. 13–25, 2015.
[30] X. X. viswamanth venkatesh, james Y. L.
Thong, “Consumer Acceptance and Use of Information Technology: Extending the Unified Theory of Acceptance and Use of Technology,” vol. 35, no. 4, pp. 1063– 1078, 2012.
[31] M. B. Holbrook and E. C. Hirschman,
“The experiential aspects of consumption:
Consumer fantasies, feelings, and fun,” J.
Consum. Res., vol. 9, no. 2, pp. 132–140,
1982.
[32] S. Agrebi and J. Jallais, “Explain the
intention to use smartphones for mobile
shopping,” J. Retail. Consum. Serv., vol.
22, pp. 16–23, 2015.
[33] H. Chahal and N. Kumari, “Consumer
perceived value: The development of a multiple item scale in hospitals in the
Indian context,” Int. J. Pharm. Healthc.
Mark., vol. 6, no. 2, pp. 167–190, 2012.
[34] G. de Kerviler, N. T. M. Demoulin, and P.
Zidda, “Adoption of in-store mobile payment: Are perceived risk and
convenience the only drivers?,” J. Retail.
Consum. Serv., vol. 31, pp. 334–344,
2016.
[35] F. J. Liébana-Cabanillas, J.
Sánchez-Fernández, and F. Muñoz-Leiva, “Role of gender on acceptance of mobile payment,”
Ind. Manag. Data Syst., vol. 114, no. 2, pp.
220–240, 2014.
[36] J. Revels, D. Tojib, and Y. Tsarenko,
182
mobile services,” Australas. Mark. J., vol.
18, no. 2, pp. 74–80, 2010.
[37] T. Teo and J. Noyes, “An assessment of
the influence of perceived enjoyment and attitude on the intention to use technology among pre-service teachers: A structural
equation modeling approach,” Comput.
Educ., vol. 57, no. 2, pp. 1645–1653,
2011.
[38] H. Chemingui and H. Ben Lallouna,
“Resistance, motivations, trust and
intention to use mobile financial services,”
Int. J. Bank Mark., vol. 31, no. 7, pp. 574–
592, 2013.
[39] H. F. Lin, “An empirical investigation of
mobile banking adoption: The effect of innovation attributes and knowledge-based
trust,” Int. J. Inf. Manage., vol. 31, no. 3,
pp. 252–260, 2011.
[40] F. Liébana-Cabanillas, I. Ramos de Luna,
and F. J. Montoro-Ríos, “User behaviour in QR mobile payment system: the QR
Payment Acceptance Model,” Technol.
Anal. Strateg. Manag., vol. 27, no. 9, pp.
1031–1049, 2015.
[41] L. Di Pietro, R. Guglielmetti Mugion, G.
Mattia, M. F. Renzi, and M. Toni, “The Integrated Model on Mobile Payment Acceptance (IMMPA): An empirical
application to public transport,” Transp.
Res. Part C Emerg. Technol., vol. 56, pp.
463–479, 2015.
[42] J. C. Hong, P. H. Lin, and P. C. Hsieh,
“The effect of consumer innovativeness on perceived value and continuance intention
to use smartwatch,” Comput. Human
Behav., vol. 67, pp. 264–272, 2017.
[43] Q. Chen, M. Zhang, and X. Zhao,
“Industrial Management & Data Systems,” 2017.
[44] Y. Lu, S. Yang, P. Y. K. Chau, and Y.
Cao, “Dynamics between the trust transfer process and intention to use mobile payment services: A cross-environment
perspective,” Inf. Manag., vol. 48, no. 8,
![Fig. 1. Research Model [8]](https://thumb-us.123doks.com/thumbv2/123dok_us/8900845.954809/6.612.120.490.336.606/fig-research-model.webp)