3181
PREDICTION OF RESERVOIR PROPERTIES FOR BLIND WELL
USING NEURAL NETWORK AND SEISMIC KNOWLEDGE
S.A.BEDIER1,M.A.EL-DOSUKY2,M. Z. RASHAD3,M.E.A.EL-MIKKAWY4 1 Researcher, Faculty of Science, Mansoura University, Egypt
2 Doctor, Faculty of Computers and Information Mansoura University, Egypt 3 Professor, Faculty of Computers and Information, Mansoura University, Egypt
4 Professor, Faculty of Science, Mansoura University, Egypt
E-mail: 1[email protected], 2[email protected], 3[email protected], 4 [email protected]
ABSTRACT
Well Drilling costs a lot without knowing porosity distribution. Geoscientists use the seismic waves to overcome this problem and reduce the exploration risk. The current paper proposes a system to predict porosity of well from other wells already drilled incorporating with seismic data. This proposed workflow aims to estimate porosity values from three-dimensional seismic data and wells records from F3-block North Sea data. We used porosity interpretations from two wells (F2-1 and F3-2) and three-dimensional seismic attributes for neural network training. for assessing the result of porosity prediction, we used data from another well (F3-4) as a blind well. Correlation in the three stages of training, validation, and testing are discussed. Test results indicate the superiority of the proposed Neural Network to predict porosity compared to other techniques in current use. By implementing Neural Network to predict porosity in blind well it is found that correlation R=0.98.
Keywords: Seismic attributes, Well logging, Neural Network, Porosity, Prediction.
1. INTRODUCTION
Oil found from deep depths beneath the earth's surface. Drilling is the only way to extract oil, but drilling will cost a lot without knowing the place of hydrocarbons.
Geoscientists use the seismic waves to overcome this problem and reduce the risk of exploration.[1] Like X-ray to diagnose the disease Seismic gives geoscientists knowledge about what is inside the earth by creating artificial seismic waves at a certain point in the region then recording the reflected and refracted waves from another point.[2]
Increasing profit in the oil industry either by increasing revenue or reducing expenses and risks in the exploration phase, the risk ratio can be reduced through the application of modern intelligent methods.
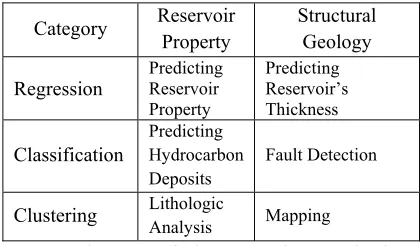
Some of oil exploration problems can be classified as shown in Table 1.
This paper aims to predict porosity values using both seismic and well log data. by proposing a Neural Network (NN) model based on data obtained from two wells which their porosity was known, and then to estimate the porosity of another
[image:1.612.312.522.480.603.2]well as blind well.
Table 1: Some of Oil Exploration Problems Classification.
Category Reservoir Property
Structural Geology
Regression Predicting Reservoir Property
Predicting Reservoir’s Thickness
Classification
Predicting Hydrocarbon Deposits
Fault Detection
Clustering Lithologic Analysis Mapping
The rest of the paper is organized as follows: The 2nd section is background materials. Previous work is given in section 3. In section 4 we propose a new system to predict porosity of well from other wells. Test results are given in section 5. Finally, Conclusion and Future work are suggested.
2. ESSENTIAL BACKGROUND MATRIALS
2.1 Seismic Exploration
3182 studying and exploring the subsurface is seismology. These objectives can be done by making maps of Earth’s interior to locate underground oil formations. Geoscientists use effectively and widely seismic reflection in hydrocarbons exploration. Measurements collected from the seismic survey are the source of information and decision-making for interpreters, whether in the form of 2D; 3D or 4D depending on the stage of exploration and purpose[2].
These measurements are called by geophysics “seismic attributes”. Seismic attributes (kinematic, dynamic, statistical or geometric) are extracted from seismic data to acquire accurate knowledge leading to a better interpretation about changing in structural (horizon depth, faults, reservoir thickness, etc.), petrophysical properties (permeability, porosity, etc.) or hydrocarbon properties (thermodynamics, product, etc.) of the seismic survey domain [3]-[4].
There are many geophysical works in literature discussing the classification of seismic attributes and their association with geologic features or reservoir properties, such as ([5],[6]).
2.2 Well Logging Exploration
A well logging in the oil industry produces a detailed record of reservoir characteristic. Measure different physical properties of surrounding rocks are made by measure equipment (logging tools) located in a borehole [7]-[8]
The main objectives of well logging are:
Identification of geological formations
Identification of fluid formation in the pores
Evaluation of the production capabilities of a reservoir formation.
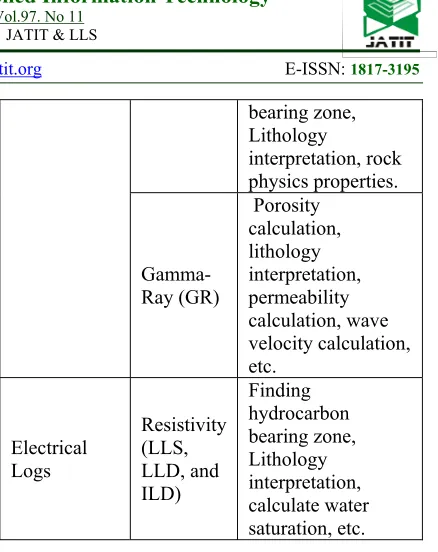
[image:2.612.312.531.44.320.2]The primary information obtained from analyzing and interpretation of well Log data can be summarized as in Table 2 [2].
Table 2: Type and Application of Some of Modern Logs.
Log Type Log Name Application
Acoustic
Logs Sonic logs (DT)
Porosity calculation, rock physics properties, wave velocity calculation. Radioactivity Logs Density (RHOB) Porosity calculation, finding hydrocarbon bearing zone, Lithology interpretation, rock physics properties. Gamma-Ray (GR) Porosity calculation, lithology interpretation, permeability calculation, wave velocity calculation, etc. Electrical Logs Resistivity (LLS, LLD, and ILD) Finding hydrocarbon bearing zone, Lithology interpretation, calculate water saturation, etc.
2.3 Artificial Neural Network (ANN)
Inspired from neural system of human, McCulloch and Pitts proposed nonlinear computational algorithm called Artificial Neural Network which have evolved in various topologies by many scientists and applied by more in different fields.[9] There are three main processes (training, validation, and testing) in ANN algorithm. Data is divided into three parts. every part measures the process performance. Basic algorithm of ANN is represented by the equation:
y x ∑ 𝑤 𝑓 𝑥 (1)
Where in this work, y represents the target vector (reservoir property),x is the vector of seismic attributes inputs, and 𝑤 is the weighting vector.[10]-[11]
3. PREVIOUS WORK
The problem under consideration many researchers presented different techniques to sort out it.
3183 Ma, Gomez et al.[14] discussed a model of porosity based on integration of three seismic attributes and eight well logs as principal component analysis (PCA) and supervised ANN regression problem. Fattahi and Karimpouli et al. [15] using data from carbonate gas reservoir in Iran to Made a comparison between different techniques in porosity and water saturation prediction then they showed that adaptive-network-based fuzzy inference system subtractive clustering method (ANFIS-SCM) method, in this case, generates a lower Mean Square Error (MSE) in comparison with support vector regression with particle swarm optimization (SVR-PSO).
Applied on Kansas gas field Singh, Kanli et al. [16] used back propagation neural network (BP-ANN) technique which uses well data as inputs to estimate the porosity.
Wu, Hao et al.[17] used inverted results of F3-block North Sea post-stack seismic data and well log data to predict the porosity, and constructed relationships between acoustic impedance (AI) and porosity. Mojeddifar, Kamali et al.[18] studied the data from the North Sea Basin and implemented a Pseudo-Forward Equation (PFE) based on similarity attribute to predict porosity.
Hosseini, Ziaii et al. [19] Used (2D) seismic With well logs data from Burgan oil field to predict hydrocarbon reservoir porosity by using three different types of artificial neural Network. The comparison of the three types shows that probabilistic neural network (PNN) is the best predictor of porosity using seismic attributes. In Viking Graben area For the porosity network Helle, Bhatt et al. [20] using BP-ANN ,they found that porosity values from grain density and in situ bulk density data gave more consistent results than using standard helium core porosity data.
4. MATERIAL AND METHODOLOGY
In the previous section, we discussed some previous assumptions that relied on smart systems to solve the problem of the prediction of porosity distribution. In this section, we investigate a new technique aims to estimate porosity from the 3d seismic and well log data.
What is new in our proposed system is our adoption of new inputs and changing the structure of the neural network and the flexibility of the system where more precise algorithms can be used in the model building stage. The dependence of our system
on the diversity of seismic variables is what distinguishes it from the previous systems, which made our system superior. Data taken from F3-block North Sea, which become publicly available and is provided by Aminzadeh and Groot [21]. We use two wells (F2–1 and F3–2) as inputs with seismic data to train and test NNs and use data from anther well (F3– 4) to estimate porosity.
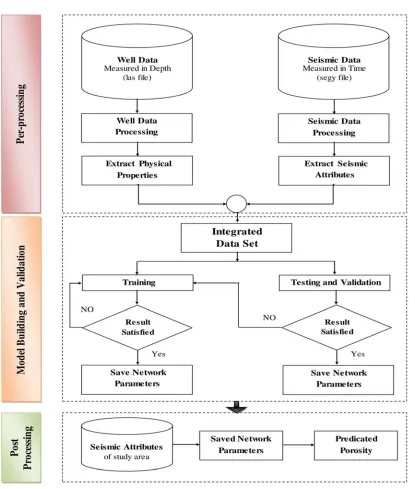
The proposed work flow to model porosity from seismic data is shown in Figure 1.
4.1 Preprocessing Stage
Seismic data measured in time domain, with well data measured in depth are used as inputs for this stage.
processing in this stage should take consideration of the following points:
Each of two datasets has to process after collecting from survey area with geophysics workflow.
Then extraction of physical properties from well data and seismic attributes from seismic data is with less noise.
Because of difference between domains of the two samples so we need to convert well dataset from depth to time domain to get integrated dataset in the time domain.
In our work, we use open detect (geophysics open source software) to get Integrated data set (seismic data with well data) to complete this stage.
4.2 Model Building
Integrated data set is divided into training validation and testing (70%, 15%and 15%). Before the training process, random values of weights are determined. In training process, these weights are changed according to the amount of error between the NN output value and actual value. until reaching the minimum value of performance function. we used mean square error (MSE) as performance function for this NN. Satisfied minimum MSE of the training process moves us to the test process which verifies the accuracy of the NN using MSE. If the accuracy of NN satisfied we save NN with its weights to apply it in the next step.
4.3 Post-processing
3184 porosity of a new well other than what we used in the Model building stage.
Figure 1: The Proposed Work Flow to Model Porosity From Seismic Data.
4.4 Data Description
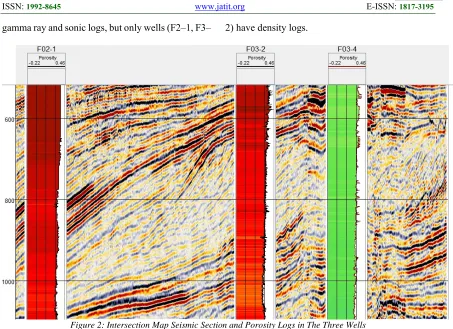
In the beginning, it is worth mentioning that the 3d seismic and well log data are taken from F3-block North Sea data. After integrating the available vertical three well logs (F2–1, F3–2 and F3–4) data measured in depth with the Seismic data measured in time domain our target area located around 500ms
3185
[image:5.612.88.541.72.401.2]gamma ray and sonic logs, but only wells (F2–1, F3– 2) have density logs.
Figure 2: Intersection Map Seismic Section and Porosity Logs in The Three Wells
Table 3: Input Features
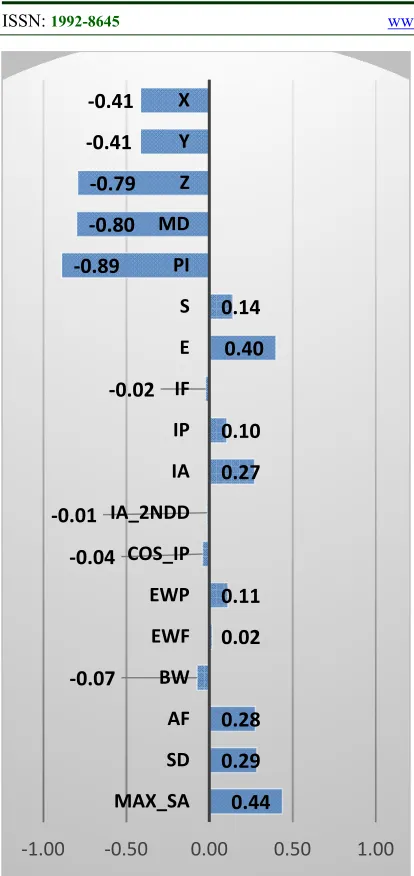
4.5 Linear Correlation
The conventional feature selection methodology is based on the linear correlation among the features. The purpose of this correlation test is to have a view of how the 18 features are linearly correlated to the target Porosity. In nature, it would be known that the relationship between each
of these features and Porosity is extremely non-linear. Figure 3 shows the result of the correlation test of the combined features against Porosity.
Part of the data set used in this paper, which consists of 3855 rows, shown in Table 4.a,b.
NO. Features Symbol NO. Features Symbol 1
Well Coordinates X 10 Instantaneous Amplitude IA 2 Y 11 Instantaneous Amplitude 2nd Derivative IA_2ndD 3 Time Z 12 Cosine of the Instantaneous Phase Cos_IP 4 Measure Depth MD 13 Envelope Weighted Phase EWP 5 P-Impedance PI 14 Envelope Weighted Frequency EWF
6 Similarity S 15 Band Width BW 7 Energy E 16 Average Frequency AF 8 Instantaneous Frequency IF 17 Spectral Decomposition SD
[image:5.612.67.550.439.640.2]3186
Figure 3: Correlation of Each Feature With Porosity.
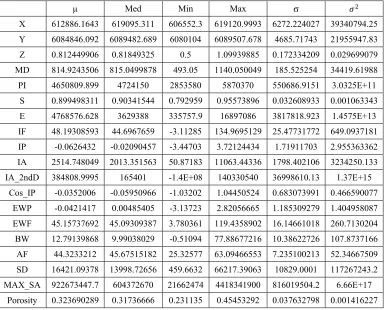
4.6 Descriptive Statistical Analysis of The Integrated Data
The basic set of descriptive statistics of the integrated seismic and log data comprising mean (µ), median (Med), minimum (Min), maximum (Max), standard deviation(σ), and variance (𝜎 ) is shown in Table 5.
5. RESULTS
5.1 Experimental results
In this study, a five-layered neural network model, three hidden layers between the input layer
and the output layer, has been used.
The performance of the training NN is shown in Figure 4, which indicates that global minimum of the mean square error is found at epoch 31 with best validation performance 0.000010705.
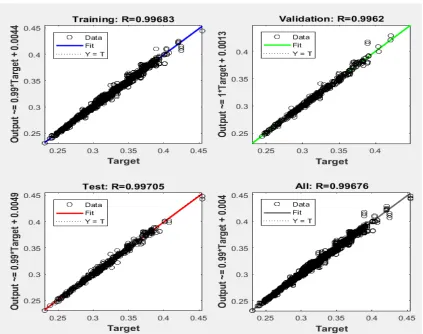
[image:6.612.313.433.251.303.2]The correlation (R) in the three stages training, validation and testing are shown in Table 6. Figure 5 show the cross plot between predicated data and target data in each of these three stages.
Table 6: Correlation in The Three Stages (Training, Validation and Testing)
R Training 0.99683 Validation 0.9962 Testing 0.99705
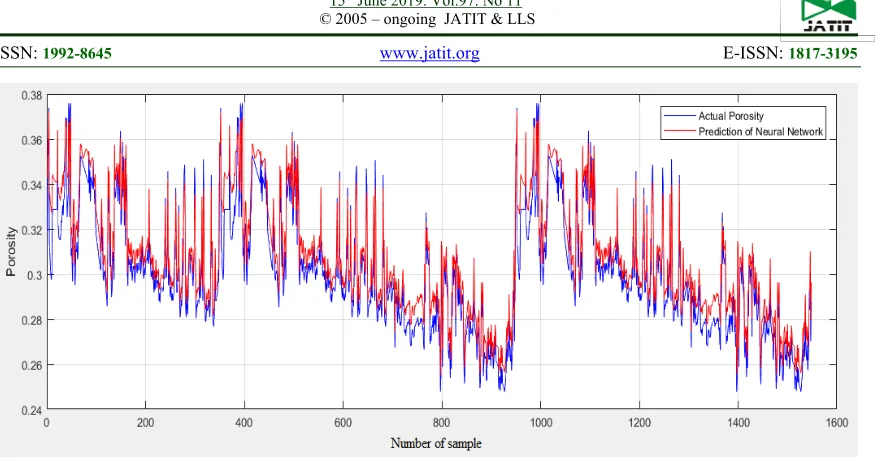
According to these results, we implemented these NN to predict porosity in a blind well which gives correlation R=0.9847. Figure 6 presents comparison between measured and predicted porosity. MATLAB is used to confirm these results.
5.2 Comparison results
[image:6.612.312.506.477.568.2]The accuracy of the proposed NN is very high compared to previous work as shown in Table 7.
Table 7: Comparison of Proposed System With Previous Work.
R Reference Proposed (NN) 0.9847
PEE 0.720 [18] PNN 0.609 [19] MLFN 0.554 [19] RBFN 0.444 [19]
6. CONCLUSION AND FUTURE WORK
In this paper, a novel system based on a neural network has been applied to predicate porosity as reservoir characteristic in blind well. proposed workflow aims to estimate porosity values from the 3d seismic and well log data taken from F3-block North Sea data. The study is based on two wells (F2–1 and F3–2) as inputs with seismic data to train and test NNs and use data from another well (F3–4) as blind well to estimate porosity.
From the analysis of the results of this work, we observed and conclude as follows : Advantages 0.44 0.29 0.28 ‐0.07 0.02 0.11 ‐0.04 ‐0.01 0.27 0.10 ‐0.02 0.40 0.14 ‐0.89 ‐0.80 ‐0.79 ‐0.41 ‐0.41
‐1.00 ‐0.50 0.00 0.50 1.00
3187
The superiority of the proposed model in its three stages training, validation and testing.
The dependence on different types of seismic variables gives better results than determining a type or two as in previous studies.
Disadvantages
Usually, relying on real data in these systems requires a lot of time and effort to train and test the efficiency of these systems. And that because of the scarcity of data.
This system is applied in areas where wells have already been drilled. This disadvantage is common in many previous works
There are many possible directions in the future, we suggest as follows:
To avoid the smallness of datasets in some area, the integration of data from different regions should be put under study.
The possibility of using this system as a kernel for hybrid systems used to construct the porosity map of the area or to locate a new well.
7. ACKNOWLEDGEMENT
The authors would like to acknowledge Opendtect (dGB Earth Science) for providing the data of the F3 Block.
REFERENCES
[1] A. Rana and R. Baliyan, "Oil Exploration Data Mining by using Various Artificial Neural Network Algorithms," International Journal, vol. 4, 2016.
[2] H. N. Alsadi, Seismic Hydrocarbon Exploration: Springer, 2017.
[3] N. C. Nanda, Seismic data interpretation and evaluation for hydrocarbon exploration and production: A practitioner’s guide: Springer,
2016.
[4] A. Gholami and H. R. Ansari, "Estimation of porosity from seismic attributes using a committee model with bat-inspired optimization algorithm," Journal of Petroleum Science and Engineering, vol. 152,
pp. 238-249, 2017.
[5] Q. Chen and S. Sidney, "Seismic attribute technology for reservoir forecasting and monitoring," The Leading Edge, vol. 16, pp.
445-448, 1997.
[6] M. T. Taner, J. S. Schuelke, R. O'Doherty, and E. Baysal, "Seismic attributes revisited," in SEG Technical Program Expanded
Abstracts 1994, ed: Society of Exploration
Geophysicists, 1994, pp. 1104-1106.
[7] M. Nikravesh, L. A. Zadeh, and F. Aminzadeh, Soft computing and intelligent data analysis in oil exploration vol. 51:
Elsevier, 2003.
[8] O. Serra, "Fundamentals of well-log interpretation," 1983.
[9] W. S. McCulloch and W. Pitts, "A logical calculus of the ideas immanent in nervous activity," The bulletin of mathematical biophysics, vol. 5, pp. 115-133, December 01
1943.
[10] D. E. Rumelhart, G. E. Hinton, and R. J. Williams, "Learning representations by back-propagating errors," Nature, vol. 323, p. 533,
10/09/online 1986.
[11] D. P. Hampson, J. S. Schuelke, and J. A. Quirein, "Use of multiattribute transforms to predict log properties from seismic data,"
GEOPHYSICS, vol. 66, pp. 220-236, 2001.
[12] A. Ali, T. M. Alves, F. A. Saad, M. Ullah, M. Toqeer, and M. Hussain, "Resource potential of gas reservoirs in South Pakistan and adjacent Indian subcontinent revealed by post-stack inversion techniques," Journal of Natural Gas Science and Engineering, vol.
49, pp. 41-55, 2018.
[13] A. Hatampour, M. Schaffie, and S. Jafari, "Estimation of NMR total and free fluid porosity from seismic attributes using intelligent systems: a case study from an Iranian carbonate gas reservoir," Arabian Journal for Science and Engineering, vol. 1,
pp. 315-326, 2017.
[14] Y. Z. Ma, E. Gomez, and B. Luneau, "Integration of seismic and well-log data using statistical and neural network methods,"
The Leading Edge, vol. 36, pp. 324-329,
2017.
[15] H. Fattahi and S. Karimpouli, "Prediction of porosity and water saturation using pre-stack seismic attributes: a comparison of Bayesian inversion and computational intelligence methods," Computational Geosciences, vol.
20, pp. 1075-1094, 2016.
[16] S. Singh, A. I. Kanli, and S. Sevgen, "A general approach for porosity estimation using artificial neural network method: a case study from Kansas gas field," Studia Geophysica et Geodaetica, vol. 60, p. 130,
2016.
3188 Technological University, 2015.
[18] S. Mojeddifar, G. Kamali, and H. Ranjbar, "Porosity prediction from seismic inversion of a similarity attribute based on a pseudo-forward equation (PFE): a case study from the North Sea Basin, Netherlands," Petroleum Science, vol. 12, pp. 428-442, August 01
2015.
[19] A. Hosseini, M. Ziaii, A. Kamkar Rouhani, A. Roshandel, R. Gholami, and J. Hanachi, "Artificial Intelligence for prediction of porosity from Seismic Attributes: Case study in the Persian Gulf," Iranian Journal of Earth Sciences, vol. 3, pp. 168-174, 2011.
[20] H. B. Helle, A. Bhatt, and B. Ursin, "Porosity and permeability prediction from wireline logs using artificial neural networks: a North Sea case study," Geophysical Prospecting,
vol. 49, pp. 431-444, 2001.
[21] G. P. Aminzadeh F, "Neural networks and other soft computing techniques with applications in the oil industry.," EAGE,
3189
Table 1.a. Partial Dataset.
Sample X Y Z MD PI S E IF IP
[image:9.612.93.549.224.294.2]1 606552.285 6080128.815 0.861 857.27 4882680 0.938 5468677.5 63.874 1.368 2 606552.285 6080128.815 0.862 858.27 4833530 0.938 5394494.0 65.779 0.276 3 606552.285 6080128.815 0.862 859.27 4757310 0.937 5324762.0 66.832 -0.841 4 606552.285 6080128.815 0.863 860.27 4847500 0.937 5271615.5 66.919 -1.828
Table 4.b. Partial Dataset.
[image:9.612.92.478.326.636.2]Sample IA IA_2ndD Cos_IP EWP EWF BW AF SD MAX_SA Porosity 1 2045.257 47128108 -0.746 0.525 55.951 12.238 48.307 13662.334 1275825200 0.332 2 1910.794 48763200 -0.757 0.362 57.384 9.360 48.108 13286.298 1216593400 0.331 3 1826.866 48101028 -0.703 0.188 58.403 6.522 47.941 12759.106 1162893400 0.337 4 1798.725 44963976 -0.585 0.016 58.898 4.112 47.822 12102.517 1118147600 0.335
Table 2 Descriptive Statistical Analysis of The Integrated Data.
µ Med Min Max σ 𝜎
X 612886.1643 619095.311 606552.3 619120.9993 6272.224027 39340794.25 Y 6084846.092 6089482.689 6080104 6089507.678 4685.71743 21955947.83 Z 0.812449906 0.81849325 0.5 1.09939885 0.172334209 0.029699079 MD 814.9243506 815.0499878 493.05 1140.050049 185.525254 34419.61988 PI 4650809.899 4724150 2853580 5870370 550686.9151 3.0325E+11 S 0.899498311 0.90341544 0.792959 0.95573896 0.032608933 0.001063343 E 4768576.628 3629388 335757.9 16897086 3817818.923 1.4575E+13 IF 48.19308593 44.6967659 -3.11285 134.9695129 25.47731772 649.0937181 IP -0.0626432 -0.02090457 -3.44703 3.72124434 1.71911703 2.955363362 IA 2514.748049 2013.351563 50.87183 11063.44336 1798.402106 3234250.133 IA_2ndD 384808.9995 165401 -1.4E+08 140330540 36998610.13 1.37E+15
Cos_IP -0.0352006 -0.05950966 -1.03202 1.04450524 0.683073991 0.466590077 EWP -0.0421417 0.00485405 -3.13723 2.82056665 1.185309279 1.404958087 EWF 45.15737692 45.09309387 3.780361 119.4358902 16.14661018 260.7130204 BW 12.79139868 9.99038029 -0.51094 77.88677216 10.38622726 107.8737166 AF 44.3233212 45.67515182 25.32577 63.09466553 7.235100213 52.34667509 SD 16421.09378 13998.72656 459.6632 66217.39063 10829.0001 117267243.2 MAX_SA 922673447.7 604372670 21662474 4418341900 816019504.2 6.66E+17
Porosity 0.323690289 0.31736666 0.231135 0.45453292 0.037632798 0.001416227
3190
Figure 4: Performance of The Neural Network.
[image:10.612.94.517.328.662.2]3191