A comparison of kinematic algorithms to
estimate gait events during overground
running
Smith, LC, Preece, SJ, Mason, D and Bramah, CA
http://dx.doi.org/10.1016/j.gaitpost.2014.08.009
Title
A comparison of kinematic algorithms to estimate gait events during
overground running
Authors
Smith, LC, Preece, SJ, Mason, D and Bramah, CA
Type
Article
URL
This version is available at: http://usir.salford.ac.uk/id/eprint/32831/
Published Date
2015
USIR is a digital collection of the research output of the University of Salford. Where copyright
permits, full text material held in the repository is made freely available online and can be read,
downloaded and copied for noncommercial private study or research purposes. Please check the
manuscript for any further copyright restrictions.
A comparison of kinematic algorithms to estimate gait events during overground
running
Laura Smith*, Stephen Preece, Duncan Mason and Christopher Bramah.
School of Health Sciences, University of Salford, Salford, United Kingdom, M6 6PU. * [email protected]
Abstract
The gait cycle is frequently divided into two distinct phases, stance and swing, which can be accurately determined from ground reaction force data. In the absence of such data, kinematic algorithms can be used to estimate footstrike and toe-off. The performance of previously published algorithms is not consistent between studies. Furthermore, previous algorithms have not been tested at higher running speeds nor used to estimate ground contact times. Therefore the purpose of this study was to both develop a new, custom-designed, event detection algorithm and compare its performance with four previously tested algorithms at higher running speeds. Kinematic and force data were collected on twenty runners during overground running at 5.6 m/s. The five algorithms were then implemented and estimated times for footstrike, toe-off and contact time were compared to ground reaction force data. There were large differences in the performance of each algorithm. The custom-designed algorithm provided the most accurate estimation of footstrike (true error 1.2 ms ± 17.1 ms) and contact time (true error 3.5 ± 18.2 ms). Compared to the other tested algorithms, the custom-designed algorithm provided an accurate estimation of footstrike and toe-off across different footstrike patterns. The custom-designed algorithm provides a simple but effective method to accurately estimate footstrike, toe-off and contact time from kinematic data.
Introduction
The gait cycle is frequently divided into two distinct phases, stance and swing. Identification of the phases is reliant upon accurate detection of the gait events footstrike and toe-off; which is typically achieved using force plates. However, in some situations, force plates cannot be used [1] and therefore it is necessary to rely on kinematic algorithms to estimate events. Algorithms to detect gait events were primarily developed within walking studies [2,3,4], however research recognises there are significant kinematic differences between walking and running gait [5]. As inaccuracies may be evident when applying walking based algorithms to running gait data, an increasing number of algorithms have been developed specifically for running gait [1,6,7].
Previously published algorithms for detecting gait events during running are based around the timing of kinematic events, such as minimum shank and foot angular accelerations [6]. Although relatively good estimation accuracy has been reported [5,6], some algorithms fail to accurately determine the timing of footstrike [7]. Furthermore, other published algorithms have not been shown to perform as well in subsequent studies [5,6]. For example, Hreljac and Stergiou [6] determined gait events utilising two-dimensional (2D) calculations in which footstrike and toe-off coincided with the local minima of the foot and shank angular accelerations in the sagittal plane, respectively. The algorithm proved effective, with average Root Mean Square (RMS) errors for footstrike of 4.5 ms and toe-off of 6.9 ms. However, when tested by Fellin et al. [5], this same algorithm demonstrated lower accuracy, with errors of -20.8 ms for footstrike and -245.0 ms for toe-off.
studies are that they have only tested event estimation algorithms at relatively slow speeds, for example 3.35 m/s [5] or have not reported speed [6,7], and some have only investigated one footstrike pattern, e.g. a rearfoot footstrike [5,6]. Therefore it is unknown how previously published algorithms perform at higher speeds, characteristic of competitive races and whether they work consistently across different footstrike patterns.
The purpose of the present study was three-fold: 1) to propose a new custom-designed kinematic algorithm, 2) to compare its accuracy with established algorithms for both event and contact time estimation at a relatively fast running speed and 3) to compare algorithm accuracy between different footstrike patterns. The accuracy of all algorithms was validated with force plate data.
Methods
Participants
Twenty elite runners (16 male and 4 female) participated in the study. The mean (± SD) age was 24.3 ± 4.4 years, mass 63.3 ± 8.5 kg and height 177.3 ± 6.8 cm. Participants reported no history of lower leg pain or pathology. Prior to participation all participants gave written informed consent and the research was approved by the University ethics committee. The study complied with the Declaration of Helsinki.
Data Collection
spines (PSIS), greater trochanters, medial and lateral femoral condyles, medial and lateral malleoli, calcaneous, and the first, second and fifth metatarsal heads. In addition, rigid cluster plates, each with four markers, were securely attached bilaterally on the participant’s shank and thigh. Prior to testing, a static calibration trial was recorded, with the participants standing in an anatomically neutral position [9], after which the dynamic data was collected. Participants wore their own running shoes and ran along a 35 m track at 5.6 m/s (± 2.5%), contacting the force plate with their right foot. Following a 5 minute warm-up, five acceptable trials were collected for each participant. Trials in which the participant visibly targeted or partially contacted the force plate were discarded.
Data Processing and Analysis
For each of the five trials, data were trimmed visually in Qualisys Track Manager (version 2.5, Qualisys AB, Gothenburg, Sweden) to within the flight phase prior to the landing foot contact (right). Kinematic data were exported to Visual 3D (Visual 3D Inc, Rockville, Maryland, USA) and all raw kinematic marker trajectories were filtered with a fourth order Butterworth low pass filter with a cut-off frequency of 10 Hz. A CODA pelvis was created and hip joint centres were defined utilising adaptations to the equations developed by Bell et al. [10]. Segmental kinematics were derived using a global optimisation approach [11], described in detail in Mason et al. [12] For each trial, true footstrike and toe-off events were identified by applying a 20N threshold to the vertical component of the ground reaction force (vGRF). The strike Index [13] was then used to characterise footstrike patterns. This index is calculated as the position of the centre of pressure at footstrike, relative to the length of the foot [13]. A strike index of 0-33%, 34-67% and 68-100% indicate rearfoot, midfoot and rearfoot strikers, respectively. Using the strike index, 6 participants were classified as rearfoot, 8 as midfoot and 6 as forefoot footstrikers.
trajectories and computed joint angles. Of these algorithms four had been published previously and one was custom-designed. These algorithms are described in detail here:
Alton: We implemented an adapted version of the Alton et al. [2], algorithm outlined in Fellin et al. [5]. Footstrike and toe-off were defined as the minimum vertical position of the heel and second metatarsal head respectively. Due to the presence of multiple minima in the vertical position of the second metatarsal head, a secondary criteria [3] was implemented. Specifically, toe-off was defined as the minimum vertical second metatarsal head position closest to the second peak in knee extension.
Dingwell: Footstrike was defined to be the first peak in knee extension and toe-off as the second peak in knee extension [3].
Hreljac: An algorithm suggested by Hreljac and Stergiou [6] defined footstrike and toe-off as the local minima of the foot and shank angular accelerations in the sagittal plane respectively [5]. In order to account for the multiple minima in these accelerations Fellin et al. [5] trimmed data to 50 ms before footstrike. However, such an approach would not be appropriate in any practical application where the aim is to accurately determine footstrike in the absence of vGRF data. Therefore, instead of data trimming, a secondary criteria was incorporated. Specifically, footstrike was defined as the local minima of the foot angular acceleration in the sagittal plane which was closest to the first in peak knee extension. Similarly, toe-off was defined as the local minima of the shank angular acceleration in the sagittal plane which was closest to the second peak in knee extension.
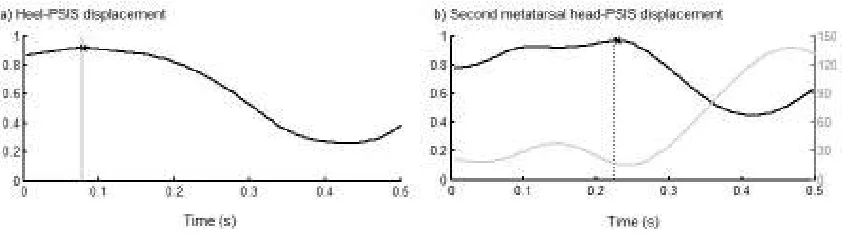
Smith (custom-designed algorithm): The custom-designed algorithm used a similar approach to Zeni et al. [4]. However, instead of using AP displacement, calculations were based around vertical displacement. Footstrike was estimated to occur at the first maximum in vertical displacement between the heel and PSIS marker (Fig. 1a). Similarly, toe-off was estimated to occur at the point of maximum vertical displacement between the second metatarsal head and PSIS marker (Fig. 1b). There were multiple minima in this displacement curve and therefore the minima closest to the second peak knee extension was used in the final algorithm.
Figure 1. Representation of the custom-designed algorithm (Smith). a) Vertical displacement between the heel
and PSIS marker is plotted against time and footstrike estimated to occur at the first maximum (denoted with an
x). The dashed line shows footstrike time derived from the vGRF. b) Vertical displacement between the second
metatarsal head and PSIS marker is plotted against time and toe-off estimated to occur at the local maxima
closest to the second peak in knee extension. This estimate is marked on the graph with an x, in which the black
line represents the custom-designed algorithm, whereas the grey line represents knee flexion-extension and
again the dashed line represents vGRF derived toe-off.
[image:7.612.96.517.267.385.2]was also calculated for both events: footstrike and toe-off and also for contact time. Both TE and RMS errors were calculated for each trial. These data were then averaged within each participant (across the five trials) and then averaged across participants.
Differences between true and algorithm contact times for the different algorithms were examined in SPSS 20 using repeated-measures ANOVA, with Bonferonni post hoc analysis (p < 0.05). Actual differences between true and algorithm contact time were also quantified as an effect size using Cohen’s d [14]. Effect sizes were interpreted as d < 0.2, small difference, d < 0.5, medium difference and d < 0.8, large difference [14].
Results
Footstrike and Toe-off
There were differences in gait event detection accuracy between algorithms (Table 1). Smith provided the most accurate estimation of footstrike, demonstrating the lowest TE (1.2 ± 17.1 ms) and RMS errors (14.1 ms). This was also evident across different footstrike patterns (Table 2)., Smith demonstrated the lowest RMS errors for each footstrike pattern compared to all other algorithms The Hreljac and Dingwell algorithms underestimated the time of footstrike, however, Smith, Zeni and Alton all overestimated footstrike (Table 1). The Alton algorithm most accurately estimated toe-off (Table 1) (TE -3.8 ± 4.2 ms and RMS 6.1 ms), however this was only marginally better than the custom-designed algorithm (TE 4.7 ± 5.9 ms and RMS 9.2 ms). The same pattern was also evident across footstrike patterns, with Alton performing marginally better for RMS error. Apart from Alton, all algorithms overestimated toe-off, with estimates of <10 ms for the Dingwell, Hreljac and Zeni algorithms (Table 1).
Table 1. Mean (SD) True Error (TE) and Root Mean Square (RMS) error between estimated and true footstrike
and toe-off expressed in ms. Note: Positive values indicate the kinematic algorithm overestimated and negative
Smith Alton Dingwell Hreljac Zeni
Footstrike True Error 1.2 (17.1) 32.0 (14.1) -27.4 (7.4) -20.0 (8.6) 18.7 (81.4)
RMS Error 14.1 32.3 27.9 23.1 151.7
Toe-off True Error 4.7 (5.9) -3.8 (4.2) 13.8 (10.5) 34.1 (50.7) 91.4 (22.5)
RMS Error 9.2 6.1 19.7 66.6 106.4
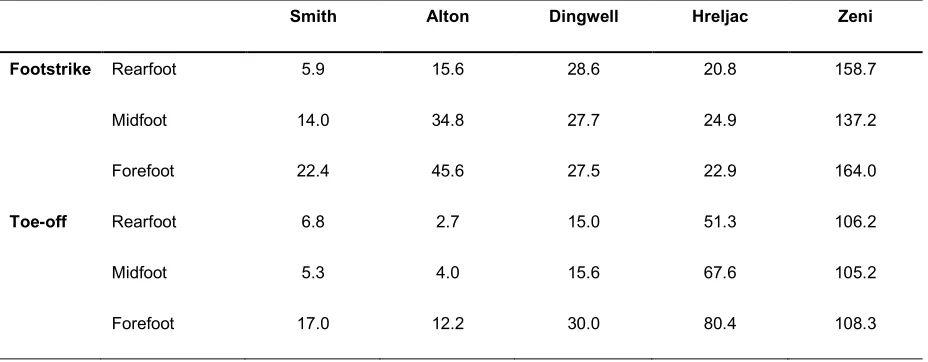
Table 2. Root Mean Square (RMS) error between estimated and true footstrike and toe-off for groups
representing each footstrike pattern; rearfoot (n = 6), midfoot (n = 8) and forefoot (n =6) strikers.
Smith Alton Dingwell Hreljac Zeni
Footstrike Rearfoot 5.9 15.6 28.6 20.8 158.7
Midfoot 14.0 34.8 27.7 24.9 137.2
Forefoot 22.4 45.6 27.5 22.9 164.0
Toe-off Rearfoot 6.8 2.7 15.0 51.3 106.2
Midfoot 5.3 4.0 15.6 67.6 105.2
Forefoot 17.0 12.2 30.0 80.4 108.3
Contact Time
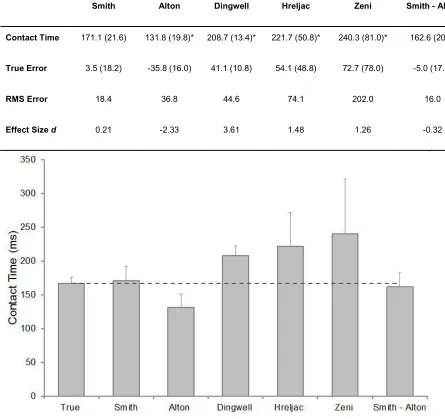
[image:9.612.59.523.278.459.2]Table 3. Mean (SD) estimated contact time and also True Error (TE), Root Mean Square (RMS) error and Effect
Size d between estimated and true contact time. All values are expressed in ms. Note that * denotes that the
algorithm contact time is significantly different (p <0.05) to the true contact time of 167.6 (8.9) ms for
repeated-measures ANOVA. For TE, positive values indicate the kinematic algorithm overestimated and negative values
indicate the kinematic algorithm underestimated contact time.
Smith Alton Dingwell Hreljac Zeni Smith - Alton
Contact Time 171.1 (21.6) 131.8 (19.8)* 208.7 (13.4)* 221.7 (50.8)* 240.3 (81.0)* 162.6 (20.5)
True Error 3.5 (18.2) -35.8 (16.0) 41.1 (10.8) 54.1 (48.8) 72.7 (78.0) -5.0 (17.8)
RMS Error 18.4 36.8 44.6 74.1 202.0 16.0
Effect Size d 0.21 -2.33 3.61 1.48 1.26 -0.32
Figure 2. True (vGRF derived) and estimated (kinematic algorithm derived) mean (SD) contact time (ms).
Dashed-line also represents true contact time (167.6 ± 8.9 ms). Repeated-measures ANOVA found all algorithms
were significantly different to true contact time (p < 0.05), except Smith and Smith-Alton which were not
significantly different to true contact time (p > 0.05). Similarly there were significant differences between all
[image:10.612.88.533.180.599.2]Discussion
The current study aimed to: 1) propose a new custom-designed kinematic algorithm, 2) compare the accuracy of current kinematic algorithms for estimating gait events and contact times at a fast running speed and 3) compare algorithm accuracy between different footstrike patterns. The results demonstrated clear differences in performance with the custom-designed (Smith) algorithm showing best performance for footstrike, the Alton and Smith algorithm best for toe-off, which was also evident across footstrike patterns; and the Smith algorithm best for contact time (Table 1, 2 and 3).
The Smith algorithm was based on the idea that the maximum vertical displacement between the PSIS and a foot marker could be used to identify footstrike and toe-off events. This idea was developed from a consideration of foot motion and also the motion of the body’s centre of mass (COM) which is often modelled as a spring-mass system during running [15]. The vertical height of the COM is maximal around the middle of swing phase, falls to a minimum around mid-stance and then increases again during the latter half of stance [15]. Similarly, during swing, the foot is lifted to ensure clearance, and to reduce the lower limb moment of inertia, and this reduces the vertical displacement between the heel and PSIS marker. Towards the end of swing, the foot moves downwards faster than the COM and this creates a maxima in vertical displacement between heel and PSIS and the instance of footstrike. In preparation for toe-off, during terminal stance the height of the COM increases due to triple extension of the hip, knee and ankle. At toe-off and the onset of swing, this triple extension is followed by a rapid increase in the vertical height of the foot. This results in a distinct peak followed by a subsequent rapid decrease in the vertical displacement between the 2nd metatarsal head and PSIS marker. This combination of events creates the observed local maxima in vertical displacement.
in previous research [5,6]; Hreljac and Stergiou [6] reported average RMS overestimations of 4.5 ms and 6.9 ms, whereas Fellin et al. [5] reported underestimations of 20.8 ms and -245.0 ms, for footstrike and toe-off respectively. It is possible that the discrepancies between the two studies may have resulted from inconsistencies in data trimming [5] or differences in force plate thresholds. Interestingly, when testing the same algorithm, the current study showed the time of footstrike was underestimated whereas the time of toe-off was overestimated. Visual inspection of the data showed that these inaccuracies were most likely due to the presence of numerous oscillations within the foot and shank angular accelerations [5]; and a lack of a distinct peak in leg angular acceleration [6].
Fellin et al. [5] have advocated the algorithm developed by Alton et al. [2], reporting RMS errors in footstrike of 24.3 ms during overground running. When tested in the current study this algorithm elicited similar overestimations: RMS error 32.3 ms and TE 32.0 ± 14.1 ms which may have been caused by shoe heel compression [6]. In agreement with previous research our investigation showed that the algorithm developed by Dingwell et al. [3] estimated footstrike early [5]. This may have been due to the knee achieving peak extension during terminal swing and the onset of flexion occurring prior to footstrike [5,8]. The results of this and previous studies suggested that the algorithms proposed by Alton et al. [2], Dingwell et al. [3], Hreljac and Stergiou [6] and Zeni et al. [4] may lead to relatively large errors in foot strike estimation. They may therefore not be suitable for footstrike determination during overground running.
selected which was closest to maximum knee extension. This appeared to improve on the modification proposed by Fellin et al [5], with a TE of only -3.8 ± 4.2 ms. Taken together, these findings suggest that the proposed adaptation to Alton et al. [2] or the custom-designed algorithm (Smith) may be the most appropriate method of estimating toe-off from kinematic data at faster speeds.
minimum error for the estimate of gait events. However, this is an inherent limitation of using three-dimensional cameras systems for which greater sampling frequencies are not possible.
Conclusions
This study described a custom-designed algorithm which accurately estimated footstrike, toe-off and contact time from input of kinematic data. Although an adaptation to an existing algorithm [2] marginally outperformed the custom-designed algorithm for toe-off estimation, we would recommend the use of the new algorithm for estimating gait events at faster speeds. However, further work is required to confirm whether it would be equally effective at slower speeds.
References
[1] Maiwald C, Sterzig T, Mayer TA, Milani TL. Detecting foot-to-ground contact from kinematic data in running. Footwear Sci 2009;1:111-8.
[2] Alton F, Baldey L, Caplan S, Morrissey MC. A kinematic comparison of overground and treadmill walking. Clin Biomech 1998;13:434–40.
[3] Dingwell JB, Cusumano JP, Cavanagh PR, Sternad D. Local dynamic stability versus kinematic variability of continuous overground and treadmill walking. J Biomech Eng 2001;123:27–32.
[4] Zeni JA, Richards JG, Higginson JS. Two simple methods for determining gait events during treadmill walking using kinematic data. Gait Posture 2008;27:710–4.
[5] Fellin RE, Rose WC, Royer TD, Davis IS. Comparison of methods for kinematic identification of footstrike and toe-off during overground and treadmill running. J Sci Med Sport 2010;13:646-50.
[6] Hreljac A, Stergiou N. Phase determination during normal running using kinematic data. Med Biol Eng Comput 2000;38:503–6.
[7] Leitch J, Stebbins J, Paolini G, Zavatsky AB. Identifying gait events without a force plate during running: A comparison of methods. Gait Posture 2011;33:130-2.
[8] Novacheck TF. The biomechanics of running. Gait Posture 1998;7:77-95.
[9] Cappozzo A, Catani F, Croce UD, Leardini A. Position and orientation in space of bones during movement: anatomical frame definition and determination. Clin Biomech 1995;10:171-8.
[10] Bell AL, Pederson DR, Brand RA. Prediction of hip joint centre location from external landmarks. Hum Movement Sci 1989;8:3-16.
[12] Mason DL, Preece SJ, Bramah CA, Herrington LC. Reproducibility of kinematic measures of the thoracic spine, lumbar spine and pelvis during fast running. Gait Posture 2014;In Press.
[13] Cavanagh PR, Lafortune MA. Ground reaction forces in distance running. J Biomech 1980;13:397–406
[14] Cohen J. Statistical power analysis for the behavioural sciences. New York: Routledge; 1988.