ORIGINAL RESEARCH ARTICLE
UTILIZATION OF A CONTINUOUS FLOW SYSTEM TO EVALUATE THE PARAMETERS OF
THE BARU PULP FERMENTATION PROCESS FOR THE PRODUCTION OF
ALCOHOLIC BEVERAGE
1
Mônica Alves Toledo,
1Danilo Alves dos Santos
1Ananda Helena Nunes Cunha,
2Eliana Paula Fernandes Brasil,
1Geralda de Fátima Lemes and
1Jonas Alves Vieira
1
State University of Goiás, Anápolis Campus of Exact and Technological Sciences - Henrique Santillo (CCET),
Br 153, No 3105, Fazenda Barreiro do Meio, Brasil
2
Federal Universityof Goiás, CollegeofAgronomy, Campus Samambaia - Rodovia Goiânia/Nova Veneza,
Km 0 – CaixaPostal 131, CEP 74690-900, Goiânia, GO, Brasil
ARTICLE INFO ABSTRACT
In the present work, it was evaluated the fermentation process of the pulp of baru, to obtain alcoholic beverage, correlating the growth of the microorganisms consonant to the time, with the consumption of substrate and the production of alcohol. This monitoring was carried out using a continuous flow system with conductometric detection. The time of degradation of the sugars constituents of the pulp of baruwas evaluated, in accordance with the microorganism activity. The studies were carried out using bread yeast as a test microorganism. The population growth of the microorganisms was monitoredaccording to the variation of CO2 concentration produced by them
in the baru pulp extract. For the extract of one gram of the sample including 0.4 g of yeast diluted in 100 ml, it was found that the degradation time of the sugars was approximately 60 min. Therefore, it can be stated that the results obtained are consistent with the proposed objectives.
Copyright©2018, Mônica Alves Toledo et al.This is an open access article distributed under the Creative Commons Attribution License, which permits
unrestricted use, distribution, and reproduction in any medium, provided the original work is properly cited.
INTRODUCTION
The so-called barueiro plant belonging to the species Dypterix alata, a legume family tree diffused in the Cerrado biomeis popularly known in different regions, by various names such
as barujo, cumbaruand cumaru, among others Mosquetta, et
al.(2011). The fruit (baru) is an ovoid brown walnut. The pulp, consisting of a solid spongy mass, covers a seed consisting of a hard and thick woody bark, which encloses an oily almond in an elliptical form. Baruis part of the native species group used by the regional population as a source of family income, Magalhães R. A. (2014). The fruit formation begins in December and ripe fruits can be collected from June to October, but it depends on the locality.
*Corresponding author: Mônica Alves Toledo,
State University of Goiás, Anápolis Campus of Exact and Technological Sciences - Henrique Santillo (CCET), Br 153, No 3105, Fazenda Barreiro do Meio, Brasil
In the state of Goiás, ripe fruits are collected in the months of August, September and October Sano et al. (1999). The production of fruits per plant can reach 5,000 units, Magalhães R. A. (2014). According toRoberto et al.(2010), the pulp of barucan be consumed in natura or in the form of sweets, jellies and liqueurs. For its peculiar flavor and fiber content can be used as pre-gelatinized flour elaborated by thermoplastic extrusion, (Rocha and Cardoso Santiago, 2009), used it as a new source of nutrients for bread making. The pulp of baruis formed of a mass that can be fermented due to the high content of carbohydrates, and can be used to produce alcoholic beverage Roberto et al. (2010). The yeast used in the production of bread (biological yeast) and some bacteria ferment sugars, thus producing two molecules of pyruvic acid, which are then converted into ethyl alcohol (ethanol), thus resulting in the release of CO2 and consequently the formation
of adenosine triphosphate (ATP). Tortora et al. (2012). Due to its high sugars content, baru pulp can also be used in the
ISSN: 2230-9926
International Journal of Development Research
Vol. 08, Issue, 01, pp.18534-18539, January,2018
Article History:
Received 11th October, 2017
Received in revised form 26th November, 2017
Accepted 20th December, 2017
Published online 31st January, 2018
Available online at http://www.journalijdr.com
Key Words:
Alcoholic beverage; Pulp of baru; Flow system; Bread yeast.
Citation: Mônica Alves Toledo, Danilo Alves dos Santos Ananda Helena Nunes Cunha, Eliana Paula Fernandes Brasil, Geralda de Fátima Lemes
and Jonas Alves Vieira.2018. “Utilization of a continuous flow system to evaluate the parameters of the baru pulp fermentation process for the production
of alcoholic beverage”, International Journal of Development Research, 08, (01), 18534-18539.
production of fermented beverages. In 2011, Ribeiro and colleagues optimized the fermentation process, verifying the effects of the variables related to the concentration of baru pulp and yeast on the loss of solids and soluble solids, and to select a fermented alcoholic beverage of baru of the semi-dry type. The authors obtained a 10.7 Brix drink of soluble solids using 17 g of yeast per liter of wort and 40 g of baru pulp per 100 ml of water. The need to study the alcoholic fermentation process of baru pulp is due to the fact that it presents adequate chemical characteristics for the production of alcoholic beverages, and it is not necessary to add sucrose in the midst of fermentation. Also, the pulp is often considered a waste, therefore the study aims to encourage its use for human consumption and provide reliable information in order to increase the value added of this important fruit from cerrado biome. Often, under artisan conditions, the rural producer is not able to measure the parameters of the fermentation process of fruit pulp, as in the case of baru. Therefore, the importance of finding means that can serve as a tool to define the adequate time for the fermentation of the sample. Thus, it is understood the need to study the fermentation process of the pulp of baru, to obtain alcoholic beverage, in accordance with the fermentation time, relating the growth of microorganisms with the consumption of substrate that results in the production of alcohol. The studies were carried out using a continuous flow system to monitor the population growth of microorganisms. This system was developed and built in the laboratory of Analytical Chemistry CCET-UEG campus.
It is important to emphasize that the methodology using flow systems with conductimetric detection is suitable for the determination of analytes in samples in the gaseous state or in reactions that the product is converted into the form of gas, as well as of related substance, allowing its separation of the reactive medium, (Bitton and Dutka, 1986), Reis et al. (1997). The volatile species of analytical interest is selectively separated from the medium by the diffusion process in a separation chamber, consisting of two plates containing a channel that allows the passage of solution, the two plates are separated by a membrane permeable to the volatile species, (Bitton and Dutka, 1986). Thus the gas generated in the sample is transferred through the membrane to a flow of deionized water, where interaction occurs with the gas resulting in the formation of carbonic acid that ionizes in aqueous medium. The resulting ions pass through a cell of conductivity, where the ionic concentration is detected and this is correlated with the increase or decrease of the population of the microorganisms in the medium. It is important to emphasize that this procedure makes direct conductimetry a selective method used in chemical analysis. CO2 is a substance of
fundamental biological importance. Its production is interrelated with the respiration of microorganisms. Due to the food used to generate energy, as well, increase the microbial population. The process proceeds as a function of the oxygen consumption of the medium by the microorganisms, generating a CO2 concentration proportional to the oxygen
consumed. This substance is also of great importance in the process of photosynthesis, since, autotrophic organisms use it in electron-donating solvents and light energy in the formation of carbohydrates and oxygen. Thus, seeking a compensation of CO2 consumed, microbial respiration starts to contribute to the
production cycle of carbon dioxide as a function of the consumption of organic substance. Due to the active participation of CO2 in the metabolism, mainly as a product of
microorganism respiration, this compound has started to be
used as an important parameter in the monitoring of the metabolic activity of microorganisms, being used, including for the evaluation of toxic effects caused by chemical compounds,Greenberg et al. (1992), Vieira et al. (2013). In the present work, the fermentation process of the pulp of baruwas evaluated to obtain alcoholic beverage, correlating the growth of the microorganisms in accordance with the time, with the consumption of substrate and the production of alcohol. This monitoring was carried out using a continuous flow system.
MATERIALS AND METHODS
The experiments were carried out at the Chemistry Laboratories of CCET-UEG Campus.
Sample
A sample of approximately 20 kg of baruwas collected in the cerrado region of Trindade, Goiás, Brazil, as shown in Figure 2. A sample of 20 kg of baruwas collected at the beginning of December 2015 (Figure 1 and 2). The fruits were then transported to the laboratory where the sample treatment procedures were performed. First, the fruit pulp was separated into slices, placed in a drying oven with forced ventilation, at a temperature of around 40oC for 24 hours. After this procedure the material was crushed, sieved to obtain the sample in the form of fine powder wick 0.297 mm, as uniform as possible. Two fractions of 0.1 g of the sample were then weighed into two containers, one of which was added 0.02 g of bread yeast, which corresponds to 20 % of the sample mass, the maximum amount of recommended yeast Tortora et al.(2012), for a content above 20 % yeast, results in a higher concentration of acid, generating a bitter taste in the beverage, making it unpleasant. In the other container was used as the blank test thus, without yeast. 20 ml of deionized H2O were added, both
were placed in a water bath at 37°C, to promote the proliferation of the microorganisms. The abstracts were evaluated using the continuous flow system (Figure 3), with conductometric detection, to monitor the variation of the CO2
concentration produced by the microorganisms in the fraction of the sample inoculated with bread yeast, and in the blank to ensure that the sample is exempt of contamination by possible microorganisms even of other species that could interfere in the obtained results.
Equipaments and Accessories
The continuous flow system built in the laboratories of CCET-UEG campus, whose analysis module is represented in figure 3, was constituted with a peristaltic pump, Milan, model 204, equipped with tubes of Tygon, to effect the pumping of the solutions , PTFE tubes with internal diameter of 0.8 mm, for channeling solutions, two solenoid three-way valves, Nresearch 225T031, Aloje, MA, USA; two timers, built in the laboratory, to connect the valves for a defined time; a gas-diffusing chamber, built in acrylic, composed of a teflon membrane, to allow separation of the analyte (CO2) from the
sample medium, a TECNAL Conductor, Model, Tec-4MP, a conductivity cell for flow system, to monitor variations in the CO2 concentration produced by the microorganisms on the
define the granulometry of the sample powder; Analytical weight balance of the Gehaka brand.
Figure 1. Baruzeiro and fruits (barus). Source: Kyodo and
[image:3.595.306.564.205.322.2]Yoko Fujino/NB
Figure 2. Sample of baru collected in the cerrado region,
municipality of Trindade, Goiás Brazil
Description of Operation of the flow system
For the Development of the proposed scientific methodology, a flow system was developed and built, the diagram of which is shown in figure 3. In this system, two substrates of the sample were monitored at each stage. The substrate (S1) inoculated with microorganism (bread yeast) and substrate (S2) without inoculation with microorganism, used as a blank test. The degradation of sugars (fermentation) in the substrates was monitored in a time interval of 30 min, as a function of the variation of CO2 concentration, produced in the process of
metabolism of the inoculated microorganisms. Thus the increase in CO2 concentration is proportional
population growth. The solutions were conditioned in Mariotte flasks, from which aliquots of them, previously defined as optimization variable, were inserted in the analytical path, using the continuous pumping process. These containers are the most suitable for closed flow systems, since their configuration contributes to maintain constant internal pressure, regardless of the volume variation of the solution inside.
According to the analysis module shown in Figure 3, the carrier solution is pumped continuously through the channel C3, through the channel of the lower plate of the separation
18536 International Journal of Development Research,
define the granulometry of the sample powder; Analytical
ource: Kyodo and
collected in the cerrado region, ality of Trindade, Goiás Brazil
Description of Operation of the flow system
For the Development of the proposed scientific methodology, a flow system was developed and built, the diagram of which figure 3. In this system, two substrates of the sample were monitored at each stage. The substrate (S1) inoculated with microorganism (bread yeast) and substrate (S2) without inoculation with microorganism, used as a blank fermentation) in the substrates was monitored in a time interval of 30 min, as a function of the concentration, produced in the process of metabolism of the inoculated microorganisms. Thus the concentration is proportional to their own The solutions were conditioned in Mariotte flasks, from which aliquots of them, previously defined as optimization variable, were inserted in the analytical path, using the continuous pumping process. These containers are e most suitable for closed flow systems, since their configuration contributes to maintain constant internal pressure, regardless of the volume variation of the solution
According to the analysis module shown in Figure 3, the umped continuously through the channel , through the channel of the lower plate of the separation
chamber, into the discard. Keeping the valves v
solutions of the substrates S1 and S2were continuously pumped through the channels C
through the respective valves and returning to their original recipient. Turning v1 on for 5s, a 200 μL aliquot of the
substrate S1, which was transported by the carrier solution, was inserted into the confluence point Y, through th diffusion chamber, where the CO
intercalating into the solution acceptor, pumped by channel C flowing through the upper plate channel of the separation chamber. In channel C2 the part of the route was dashed,
informing that there was overlap with channel C
Figure 3. Module of analysis of continuous system flow. H2SO4
0.2 molL-1, C1 = channel 1, C2
channel 4, P = peristaltic pump, v
timer 1, T2 = timer 2, S1 = substrate recipient 1, S2 = substrate
recipient 2, SC = separation chamber, Cd = W = discard
The CO2 produced by the microorganisms permeates the PTFE
membrane, intercalating in an acceptor fluid (deionized water), which interacts with the water forming the carbonic acid, which ionizes as represented in (Eq.1), this solution was pumped through the conductivity cell of the conductivity meter, in which the ion concentration was monitored in real time. Reis et al.(1997) and then discarded.To insert the substrate S2 in the analytical path, the v
for 5s to insert a 200 μL aliquot into the analytical path at the confluence point Y, thus repeating the procedure similar to that described for S1. During the time that one valve was kept on to insert a solution in the analytical path, the other valve was kept off and the solution of the other container was kept in circulation, i.e., it was continuously pumped out of its container through the valve and returning
container. At the end of each sampling cycle, with the two valves turned off, the initial pumping condition returned, condition ready to start a new sampling cycle and readings. The confluence point Y is a point that allowed the encounter between two solutions, according to the sampling sequence: either between the carrier solution and the substrate solution S1, or the carrier solution with the substrate solution S2. When none of the solutions of the substrates S1 and S2 were inserted, the carrier solution (H2SO4) was kept flowing individually.
The 0.2 molL-1 H2SO4 solution was used as the carrier solution
to keep the gas in the form of CO where it is separated from the sample.
CO2 + H2O HCO3- + CO32- + H
Timers are semi-automatic electronic devices used to turn on and off certain electronic equipment or accessories. They were built in the laboratory, there is a scale of adjustment that allows adjustment of time interval, acc
keep the appliance on, and they are mechanically activated and
International Journal of Development Research, Vol. 08, Issue, 01, pp.18534-18539, January,
chamber, into the discard. Keeping the valves v1 and v2 off, the
solutions of the substrates S1 and S2were continuously pumped through the channels C1 and C2 respectively, passing
through the respective valves and returning to their original on for 5s, a 200 μL aliquot of the substrate S1, which was transported by the carrier solution, was inserted into the confluence point Y, through the gas diffusion chamber, where the CO2 gas was separated,
intercalating into the solution acceptor, pumped by channel C4,
flowing through the upper plate channel of the separation the part of the route was dashed, e was overlap with channel C1.
Module of analysis of continuous system flow. H2SO4
2 channel 2, C3 = channel 3, C4 =
channel 4, P = peristaltic pump, v1 = valve 1, v2 = valve 2, T1 =
= timer 2, S1 = substrate recipient 1, S2 = substrate recipient 2, SC = separation chamber, Cd = conductivity meter,
W = discard
produced by the microorganisms permeates the PTFE membrane, intercalating in an acceptor fluid (deionized water), ch interacts with the water forming the carbonic acid, which ionizes as represented in (Eq.1), this solution was pumped through the conductivity cell of the conductivity meter, in which the ion concentration was monitored in real d then discarded.To insert the substrate S2 in the analytical path, the v2 valve was turned on
L aliquot into the analytical path at the confluence point Y, thus repeating the procedure similar to that ime that one valve was kept on to insert a solution in the analytical path, the other valve was kept off and the solution of the other container was kept in circulation, i.e., it was continuously pumped out of its container through the valve and returning to its original container. At the end of each sampling cycle, with the two valves turned off, the initial pumping condition returned, condition ready to start a new sampling cycle and readings. The confluence point Y is a point that allowed the encounter etween two solutions, according to the sampling sequence: either between the carrier solution and the substrate solution S1, or the carrier solution with the substrate solution S2. When none of the solutions of the substrates S1 and S2 were inserted, ) was kept flowing individually. solution was used as the carrier solution to keep the gas in the form of CO2 up to the diffusion chamber
where it is separated from the sample.
+ H+ ………..Eq.1
automatic electronic devices used to turn on and off certain electronic equipment or accessories. They were built in the laboratory, there is a scale of adjustment that allows adjustment of time interval, according to the need to keep the appliance on, and they are mechanically activated and
[image:3.595.40.286.289.474.2]turn themselves off automatically. In the present work the timers were built with a time interval scale of 0.5 s to 5 min, allowing electronic components to be switched on
time interval defined by the analyst. They are made up of a key that once activated, turns the unit on, keeps it switched on for the set period of time, and automatically switches it off at the end of this period. In this system the timers we
purpose of turning the three-way solenoid valves V
and off for defined periods according to the optimization conditions of the variables required for analysis. In order to sample the substrate solution S1, the timer T
V1 on and the timer T2 was used to turn V
sampling period of the substrate solution S2. During the respective samplings, each valve was kept on for 5 s, accurately reproducing the sample volume in different samplings. Each sampling was performed after the analytical path of the previous reading had been cleaned.
were carried out by inserting 200 μL solution of the sample substrates, which corresponded to 5s of sample, whose the flow rate was maintained at 2.4 mLmin-1. In
Schlieren effect problem, the pH of the carrier solution was adjusted with sodium hydroxide to 7.15, this pH being similar to that of the solutions of the substrates.
RESULTS AND DISCUSSION
[image:4.595.310.556.273.453.2]The results concerning the evaluation of the of sugars in the sample are shown in Figure 4
Figure 4. Evaluation of the sugarsdegradation time of the Baru pulp sample, in the fermentation process of the sample for the alcohol beverage production, in three dilution con
150 mL, 200 mL
The time of degradation of sugars in the sample was evaluated in three dilution conditions. The substrates were prepared maintaining the ratio of 1g of sample and 0.2g of yeast, i.e., 20% of yeast regarding the mass of the sample, the
were diluted in 100 mL, 150 mL and 200 mL. As shown in figure 5. The degradation time ranged from 45 min for the lowest dilution (100 mL) and 60 min for the highest dilution (200 mL). The preliminary analyzes were positive for the study concerned. The reliability of the results was evaluated by performing three replicates at three different inoculation conditions. Three substrates were prepared by maintaining the sample concentration constant and varying the percentage of bread yeast, as described below:
substrate A - 20 mL deionized water, 0.1 g sample and 0.01 g yeast;
0 20 40 60 80 100 120
60 90 120 150 180 210 240 270 K ( µS cem -1) Time (min)
turn themselves off automatically. In the present work the timers were built with a time interval scale of 0.5 s to 5 min, allowing electronic components to be switched on and off in a time interval defined by the analyst. They are made up of a key that once activated, turns the unit on, keeps it switched on for the set period of time, and automatically switches it off at the In this system the timers were built with the way solenoid valves V1 and V2 on
and off for defined periods according to the optimization conditions of the variables required for analysis. In order to sample the substrate solution S1, the timer T1 was used to turn
was used to turn V2 on during the
sampling period of the substrate solution S2. During the respective samplings, each valve was kept on for 5 s, accurately reproducing the sample volume in different was performed after the analytical path of the previous reading had been cleaned. The studies L solution of the sample substrates, which corresponded to 5s of sample, whose the . In order to avoid Schlieren effect problem, the pH of the carrier solution was adjusted with sodium hydroxide to 7.15, this pH being similar
The results concerning the evaluation of the degradation time of sugars in the sample are shown in Figure 4.
Evaluation of the sugarsdegradation time of the Baru pulp sample, in the fermentation process of the sample for the alcohol beverage production, in three dilution conditions, 100 mL,
The time of degradation of sugars in the sample was evaluated in three dilution conditions. The substrates were prepared maintaining the ratio of 1g of sample and 0.2g of yeast, i.e., 20% of yeast regarding the mass of the sample, the substances were diluted in 100 mL, 150 mL and 200 mL. As shown in figure 5. The degradation time ranged from 45 min for the lowest dilution (100 mL) and 60 min for the highest dilution (200 mL). The preliminary analyzes were positive for the The reliability of the results was evaluated by performing three replicates at three different inoculation conditions. Three substrates were prepared by maintaining the sample concentration constant and varying the percentage of
20 mL deionized water, 0.1 g sample and 0.01
substrate B - 20 mL of deionized water, 0.1 g of sample and 0.02 g of yeast; substrate C
sample and 0.00 yeast used as blank in relation to microorganisms.
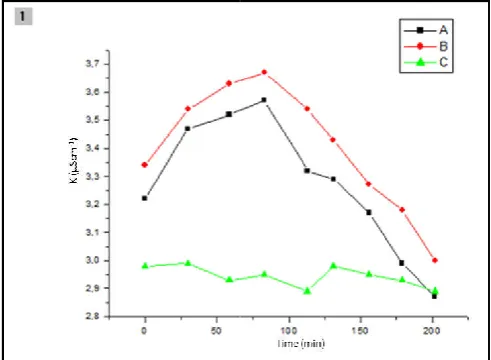
The results for the evaluation of the substrates are shown in Figure 4. The following criterion was used: for each condition three substrates of the sample were prepared and for each substrate it was submitted to the process of reading in triplicate, evaluating the degradation of sugars over time. repeatability may be better observed in the graph Figure 5, in which it can be seen that for different yeast contents, it resulted in a sensitivity difference regarding the percentage added. I important to highlight that the points of maximum sensitivity coincide in the same inoculation time, which shows that the amount of microorganisms produced a lower CO concentration, however, it was enough to degrade the sugars that could be fermented.
Figure 5 - Evaluation of the repeatability of baru pulp substrate analysis with 0%;10% and 20% of yeast.
Graph A, B and C = substrate with 0.1 g of sample and 0.01 g, 0.02 g and 0.00 g of yeast respectively. After the development of the proposed methodology as well as the optimization of the experimental conditions of analysis, a flow system with a very simple configuration with few accessories was tried, according to the diagram represented in Figure 6. The goal was to provide an alternative low cost and especially easy to operate, making its possible application more attractive to small and medium producers of alcoholic beverages, which use the fermentation process. This system consisted of only one peristaltic pump, Milan, model 204, equipped with tubes, PTFE tubes with internal diameter of 0.8 mm; a gaseous diffusion chamber, built in acrylic, composed of a teflon membrane; a TECNAL conductor, model, Tec
conductivity cell for flow system. The function of the equipment and accessories are the same as described for the previous system shown in Figure 3. As shown in the analysis module of Figure 6, the solution of the substrate (S) was pumped out of the packaging vial, flowing through the channel C1, through the gas diffusion chamber and r
point of origin, it remains circulating until the end of the analysis. Thus, the volume of the sample substrate is maintained constant throughout the reading period. The CO produced by the microorganisms is separated from the solution of the substrate in the gas diffusion chamber, and channelled through the conductivity cell into the discard.
120 140 160
100 mL 150 mL 200 mL
20 mL of deionized water, 0.1 g of sample and substrate C - 20 mL deionized water, 0.1 g sample and 0.00 yeast used as blank in relation to
The results for the evaluation of the substrates are shown in Figure 4. The following criterion was used: for each condition three substrates of the sample were prepared and for each substrate it was submitted to the process of reading in triplicate, evaluating the degradation of sugars over time. The repeatability may be better observed in the graph Figure 5, in which it can be seen that for different yeast contents, it resulted in a sensitivity difference regarding the percentage added. It is important to highlight that the points of maximum sensitivity coincide in the same inoculation time, which shows that the amount of microorganisms produced a lower CO2
concentration, however, it was enough to degrade the sugars
Evaluation of the repeatability of baru pulp substrate analysis with 0%;10% and 20% of yeast.
Graph A, B and C = substrate with 0.1 g of sample and 0.01 g, 0.02 g and 0.00 g of yeast respectively. After the development hodology as well as the optimization of the experimental conditions of analysis, a flow system with a very simple configuration with few accessories was tried, according to the diagram represented in Figure 6. The goal was to t and especially easy to operate, making its possible application more attractive to small and medium producers of alcoholic beverages, which use the This system consisted of only one peristaltic pump, Milan, model 204, equipped with Tygon tubes, PTFE tubes with internal diameter of 0.8 mm; a gaseous diffusion chamber, built in acrylic, composed of a teflon membrane; a TECNAL conductor, model, Tec-4MP, a conductivity cell for flow system. The function of the re the same as described for the previous system shown in Figure 3. As shown in the analysis module of Figure 6, the solution of the substrate (S) was pumped out of the packaging vial, flowing through the channel , through the gas diffusion chamber and returning to its point of origin, it remains circulating until the end of the analysis. Thus, the volume of the sample substrate is maintained constant throughout the reading period. The CO2
[image:4.595.37.294.390.557.2]configuration, the advantage of not losing the sample solution is highlighted, reproducing a condition similar to the process of fermentation of organic substances as that of producers of alcoholic beverages.
Figure 6. Proposed flow system analysis module. P = peristaltic
pump, C1 = channel 1, C2 channel 2, S = substrate vessel, SC =
separation chamber, Cd = conductivity meter, W = discard
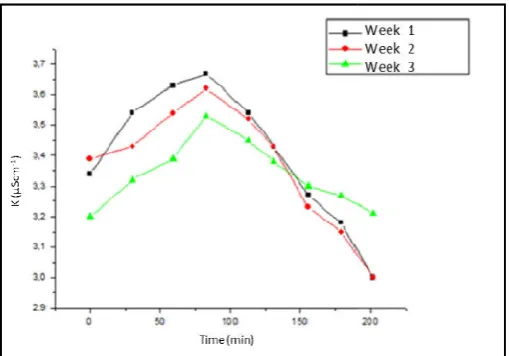
In the sequence of activities, the characteristics of the results were analyzed in relation to reproducibility. For this analysis, the substrate that presented greater sensitivity in the evaluation of the repeatability using the previous system was adopted This substrate consists of 0.1 g of sample with 0.02 g of yeast. The studies were performed once a week for 3 weeks, as shown in Figure 7. The results were found to have a good reproducibility, both in relation to sensitivity and in relation to the time of sugars degradation. The small variations in sensitivity can be attributed to factors such as calibration of the equipment, different temperatures or even small variations in the mass of the sample used in the preparation of the substrate. Since for each repetition a new substrate was prepared, consequently a new calibration was done and due to different weeks the readings might have been carried out at different temperatures. Note that the conductivity can change considerably as a function of temperature
important to emphasize that the CO2 concentration in the
aliquot of the blank substrate remained constant, thus demonstrating that the variation in CO2 concentration in the
other aliquots was produced by the inoculated microorganisms and not by possible contamination by fungi or bacteria.
Figure 7. Results regarding the evaluation of the reproducibility
of sugars degradation in baru pulp substrates.Values m
three replicates
Reproducibility of analysis at different weeks using the substrate consisting of 0.1 g of sample and 0.02 g of yeast. It is possible to affirm that the fermentation process of pulp of for the production of alcoholic beverage is based on the degradation of sugars in the sample as a function of time.
18538 International Journal of Development Research,
[image:5.595.36.291.512.690.2]configuration, the advantage of not losing the sample solution is highlighted, reproducing a condition similar to the process of organic substances as that of producers of
Figure 6. Proposed flow system analysis module. P = peristaltic channel 2, S = substrate vessel, SC = conductivity meter, W = discard
In the sequence of activities, the characteristics of the results were analyzed in relation to reproducibility. For this analysis, the substrate that presented greater sensitivity in the evaluation of the repeatability using the previous system was adopted. This substrate consists of 0.1 g of sample with 0.02 g of yeast. The studies were performed once a week for 3 weeks, as shown in Figure 7. The results were found to have a good reproducibility, both in relation to sensitivity and in relation to of sugars degradation. The small variations in sensitivity can be attributed to factors such as calibration of the equipment, different temperatures or even small variations in the mass of the sample used in the preparation of the substrate. repetition a new substrate was prepared, consequently a new calibration was done and due to different weeks the readings might have been carried out at different temperatures. Note that the conductivity can change considerably as a function of temperature variations. It is concentration in the aliquot of the blank substrate remained constant, thus concentration in the other aliquots was produced by the inoculated microorganisms
not by possible contamination by fungi or bacteria.
Results regarding the evaluation of the reproducibility pulp substrates.Values mean for
Reproducibility of analysis at different weeks using the substrate consisting of 0.1 g of sample and 0.02 g of yeast. It is possible to affirm that the fermentation process of pulp of baru for the production of alcoholic beverage is based on the
n of sugars in the sample as a function of time.
It is considered as limit of the time of degradation of sugars, the instant that initiates the deactivation of the population of microorganisms. This condition is monitored as a function of the CO2 concentration, since the decrease in CO
is correlated with the decrease in the population of the microorganisms. As shown in the graphs of figures 6 and 8. It was found that shortly after inoculation, a high concentration of sugars (food) and a small population of microorganisms predominate and, consequently, a low concentration of CO Over time, an inversion occurs, i.e., increase of microorganisms and CO2 concentration and a decrease in the
amount of food. From the moment that the food becomes insufficient, it initiates the deactivation of the microorganisms, in this condition the graph begins to decrease due to the decrease in the CO2 production.
evaluated, the outset of the deactivation of the microorganisms predominated around 60 min. This, indirectly, means that the fermentation was concluded and, therefore, the substrate can be submitted to the distillation process to obtain the final product, that is, the separation of the alcohol resulting from the fermented material (baru pulp).
Conclusions
The feasibility of the fermentation process of
for the production of alcoholic beverage, using the process of degradation of baru pulp sugars by microorganisms (bread yeast), as well as a good performance of the systems in flow, to monitor the concentration of CO
microorganisms in the sample extracts has been proven. It was possible to determine the influence regard
degradation time, as a function of the dilution factor of the sample extracts. For 0.1 g of sample to 20 mL the minimum time was 100 min and at the dilution of 0.1 g to 20 mL with addition of 20% yeast the minimum time was reduced to 60 min. It is concluded that this decrease in the time of degradation in relation to the increase in the amount of yeast added to the sample is due to the amount of sample consumed by the microorganisms. The greater amount of yeast favours its population growth, thus reducing the time of fermentation for the production of the alcoholic beverage. The techniques employed have proved that after 60 minutes, the sample fermentation has been completed and therefore the distillation process for the production of alcoholi
REFERENCES
Bitton, G.; Dutka, J.B. 1986a. Introduction and review of microbial and biochemical toxicity screening procedures. In: _____. Toxicity Testing using Microorganisms. Boca Raton, Florida: CRC Press.1: p 1
Greenberg, A. E.; Clesceri, L. S.; Eaton, A. D. (1992).Ed.; Standard Methods 18a Edição, p 8.2.
Luis Roberto Carrazza João Carlos Cruz D´Ávila Manual Tecnológico de Aproveitamento integral do Fruto do Baru (Dipteryxalata), 2ª edição Brasília
ISPN
Magalhães R. A. 2014. Cadeia produtiva da amêndoa do baru (dipteryxalata vog.) no cerrado: uma análise da sustentabilidade da sua exploração. Ciência Florestal, Santa Maria. 24: p. 665-676.
Rafael M., Gabriela C. R., Rodrigo A. A. Luciana M. C. Fernanda C. F., Roseane F.
Clarice M. B. R., Cristiane de B. da S., Adriana R. P., Ruy C. R. B. e Sílvia S. G. (2011). Uso de Amêndoas de Baru
International Journal of Development Research, Vol. 08, Issue, 01, pp.18534-18539, January,
It is considered as limit of the time of degradation of sugars, the instant that initiates the deactivation of the population of microorganisms. This condition is monitored as a function of ation, since the decrease in CO2 concentration
is correlated with the decrease in the population of the microorganisms. As shown in the graphs of figures 6 and 8. It was found that shortly after inoculation, a high concentration l population of microorganisms predominate and, consequently, a low concentration of CO2.
Over time, an inversion occurs, i.e., increase of concentration and a decrease in the amount of food. From the moment that the food becomes ufficient, it initiates the deactivation of the microorganisms, in this condition the graph begins to decrease due to the production. In the experimental conditions evaluated, the outset of the deactivation of the microorganisms nated around 60 min. This, indirectly, means that the fermentation was concluded and, therefore, the substrate can be submitted to the distillation process to obtain the final product, that is, the separation of the alcohol resulting from the
pulp).
The feasibility of the fermentation process of baru pulp sample for the production of alcoholic beverage, using the process of pulp sugars by microorganisms (bread yeast), as well as a good performance of the systems in flow, to monitor the concentration of CO2 produced by the
microorganisms in the sample extracts has been proven. It was possible to determine the influence regarding the sugars degradation time, as a function of the dilution factor of the sample extracts. For 0.1 g of sample to 20 mL the minimum time was 100 min and at the dilution of 0.1 g to 20 mL with addition of 20% yeast the minimum time was reduced to 60 It is concluded that this decrease in the time of degradation in relation to the increase in the amount of yeast added to the sample is due to the amount of sample consumed by the microorganisms. The greater amount of yeast favours its thus reducing the time of fermentation for the production of the alcoholic beverage. The techniques employed have proved that after 60 minutes, the sample fermentation has been completed and therefore the distillation process for the production of alcoholic beverages can be used.
Bitton, G.; Dutka, J.B. 1986a. Introduction and review of microbial and biochemical toxicity screening procedures. In: _____. Toxicity Testing using Microorganisms. Boca Raton, Florida: CRC Press.1: p 1-8.
A. E.; Clesceri, L. S.; Eaton, A. D. (1992).Ed.; Edição, p 8.2.
Luis Roberto Carrazza João Carlos Cruz D´Ávila(2010). Manual Tecnológico de Aproveitamento integral do Fruto do Baru (Dipteryxalata), 2ª edição Brasília – DF, 2010
Cadeia produtiva da amêndoa do baru (dipteryxalata vog.) no cerrado: uma análise da sustentabilidade da sua exploração. Ciência Florestal, Santa
, Rodrigo A. A.M., Nívia M. M. C. e Fernanda C. F., Roseane F.R., Aline F. O., Clarice M. B. R., Cristiane de B. da S., Adriana R. P., Ruy (2011). Uso de Amêndoas de Baru
para remoção de Ni em etanol combustível. Química Nova. 34: P. 923-927.
Reis, B.F.; Vieira, J.A.; Krug, F.J. &Giné, M.F. 1997. Development of a flow injections system two analytical paths for ammonium determination in soil extracts by conductometry. J. Braz.Chem. Soc., 8: p 523-528.
Ribeiro, A. E. C., Ascheri, D. P. R., Ascheri, J. L. R. 2011. Aplicação da metodologia de superfície de resposta para a seleção de uma bebida alcoólica fermentada de polpa de baru. Revista Agrotecnologia. 2: p. 57–72.
Rocha, L. S.; Cardoso, S. R. A. 2009. Implicações nutricionais e sensoriais da polpa e casca de baru (DipterixAlata vog.) na elaboração de pães. Ciência & Tecnologia de Alimentos. 29: p. 820-825.
Sano S. M., Vivaldi L. J., Spehar C. R. 1999. Diversidade morfológica de frutos e sementes de Baru (Dipterixalata Vog.). Pesquisa Agropecuária Brasileira.34: p. 513-518. Tortora, G.J.; Funke, B.R.; Case, C.L. Microbiologia. 10.ed.
Porto Alegre: Artmed, 2012. 934 p.
Vieira, J. A.; Cunha, A. H. C. ; Costa, Orlene Silva da ; Góis, P. F. 2013. Uso da bactéria Escherichia Coli para avaliação da toxicidade de Cd e amoxicilina por turbidimetria empregando sistema em fluxo por gravidade. Analytica (São Paulo). 12: p. 84-90.