6
I
January 2018
Effect of Processing Parameters on Metal Matrix
Composites in Stir Casting Process Using Taguchi
Technique
S. Rajesh1, S. Madhankumar2, M. Harikrishnan3, T. Vignesh4
1, 2, 4
Assistant Professor, Department of Mechatronics Engineering, Sri Krishna College of Engineering and Technology, Coimbatore.
3
P.G Scholar, Government college of Technology, Coimbatore
Abstract: The mechanical properties of composites not only depend on the volume of reinforcements, but also on the distribution of reinforcements.Al6063 alloy, reinforced with mixture of Silicon Carbide (SiC) and Alumina (Al2O3) particles, known as hybrid composites have been fabricated by stir casting technique and optimized at different parameters like stirring speed, processing temperature, reinforcement preheat temperature and percentage addition of SiC (5%,10% and 15%) by Taguchi method L9 Orthogonal array. Optimum Brinell hardness (BHN), Ultimate tensile strength(UTS) and Yield strength (YS) have been found under the influence of stirring speed, processing temperature, reinforcement preheat temperature and percentage addition of SiC. Finally, confirmation test has been carried out to verify the experimental results.
Key words: Hybrid Composite, Orthogonal Array, Ultimate Tensile Strength, Brinell Hardness, Stir casting Technique.
I. INTRODUCTION
Composite materials are made from two or more constituent materials and distinct on a macroscopic level within the finished structure. They do not dissolve or blend with each other. Composite materials play an important role in the field of engineering as well as advance manufacturing in response to unprecedented demands from technology due to rapidly advancing activities in aircrafts, aerospace and automotive industries. Stir casting technique is one of the popular Liquid Metallurgy Route (LMR) and also known as a very promising route for manufacturing near net shape hybrid metal matrix composite components at a normal cost. The stir casting furnace is mounted on the floor and the temperature of the furnace is precisely measured and controlled in order to achieve sound quality composite. Two thermocouples and one PID controller were used for this purpose. As mild steel materials are having high temperature stability, they are selected as stirrer rod and impeller [1].
The porosity can be reduced by constant stirring, maintaining the optimum melt temperature and using sand mold. The addition of SiC as secondary ceramic reduces the coefficient of friction there by reduction in the noise and vibration during the motion [2]. The ceramics used are soft and hard nature, the hard ceramics increases the wear resistance and strength whereas the soft ceramics increases the lubrication effect, reduces the noise and vibration etc. Metal matrix composites (MMCs) provide a combination of the metallic properties of the matrix (high toughness) with the ceramic properties of the reinforcement (high strength and high modulus) to give a material greater strength and stiffness, higher temperature capabilities and more excellent wear resistance than a similar monolithic material [3,4]. The Argon gas was supplied into the near the crucible during the stirring to avoid the formation of oxide layer on the surface of matrix melt. From the microstructure analysis, the particles were distributed uniformly in the processing temperature 750°C and 800°C. The particles agglomerations were found in the processing temperature of 700°C, 850°C and 900°C due to the changes of viscosity in liquid Al matrix [5,6]. At full liquid condition it is difficult uniform distribution of the reinforcement in the molten metal. Preheating of mold helps in reducing porosity as well as increases mechanical properties. Uniform dispersion of material blade angle should be 45° or 60 ° & no of blade should be 4 [7].
II. EXPERIMENTALWORK
In the present investigation, tensile test and hardness test were performed on SiC and Al2O3 particulates reinforced Al6063 alloy
matrix composite. The matrix material was loaded in a graphite crucible and it was placed inside a top loaded resistance furnace at different process parameters like stirring speed (A), processing temperature (B), reinforcement preheat temperature (C) and percentage addition of SiC (D) (5%,10% and 15%) by Taguchi method L9 Orthogonal array.
Stirring time: 6min. Al2O3: 3%
Table 1.Taguchi Runs
RUN A B C D
1 400 750 600 5%
2 400 800 650 10%
3 400 850 700 15%
4 500 750 650 15%
5 500 800 700 5%
6 500 850 600 10%
7 600 750 700 10%
8 600 800 600 15%
9 600 850 650 5%
III. RESULTSANDDISCUSSION
The machined specimen has been tested for tensile test and hardness test (Brinell test) to identify the mechanical properties then regression equation is formed by using Minitab17 software.
[image:3.612.33.579.351.611.2]A. Tensile Test (Ultimate Tensile Strength)
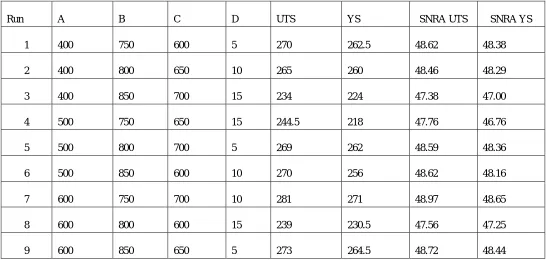
Table 2.SN ratio Ultimate Tensile Sterngth
Run A B C D UTS YS SNRA UTS SNRA YS
1 400 750 600 5 270 262.5 48.62 48.38
2 400 800 650 10 265 260 48.46 48.29
3 400 850 700 15 234 224 47.38 47.00
4 500 750 650 15 244.5 218 47.76 46.76
5 500 800 700 5 269 262 48.59 48.36
6 500 850 600 10 270 256 48.62 48.16
7 600 750 700 10 281 271 48.97 48.65
8 600 800 600 15 239 230.5 47.56 47.25
9 600 850 650 5 273 264.5 48.72 48.44
Table 3.Response for Signal to Noise ratio and Means (UTS)
Level A B C D
1 48.16 48.46 48.27 48.65
2 48.33 48.21 48.32 48.69
3 48.42 48.24 48.32 47.57 DELTA 0.26 0.25 0.04 1.12
Level A B C D 1 256.3 265.2 259.7 270.7
2 261.2 257.7 260.8 272.0 3 264.3 259.0 261.3 239.2
DELTA 8.0 7.5 1.7 32.8
RANK 2 3 4 1
Figure 1 Main effect plots for S/N ratio and mean (UTS)
[image:4.612.119.497.377.621.2]It is evident from the tables that, among these parameters, percentage addition of Silicon carbide (5%, 10% and 15%) is a dominant factor on the ultimate tensile strength.
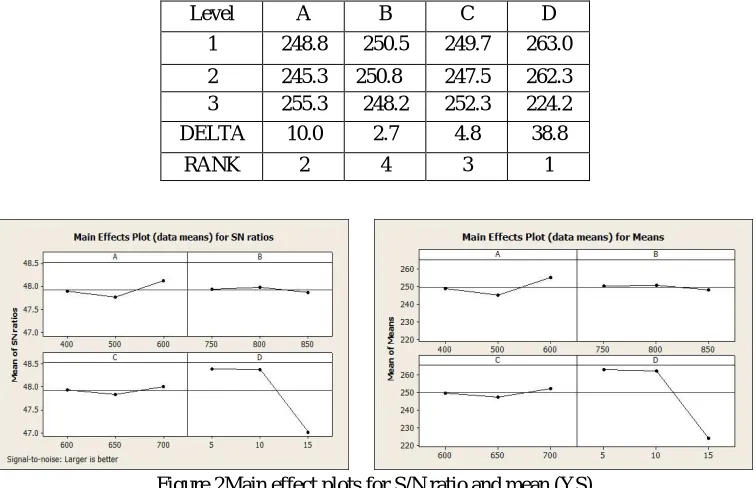
Table 4.Response for Signal to Noise ratio and Means (YS)
Level A B C D
1 248.8 250.5 249.7 263.0
2 245.3 250.8 247.5 262.3 3 255.3 248.2 252.3 224.2
DELTA 10.0 2.7 4.8 38.8
RANK 2 4 3 1
Figure 2Main effect plots for S/N ratio and mean (YS)
It is evident from the tables that, among these parameters, percentage of addition of Silicon carbide (5%, 10% and 15%) is a dominant factor on the yield strength.
B. Hardness Test (BHN)
Table 5.SN ratio Brinell hardness number
RUN A B C D BRINELL HARDNESS SNRA
1 400 750 600 5% 178.66 45.04
2 400 800 650 10% 178.33 45.02
3 400 850 700 15% 172.66 44.74
4 500 750 650 15% 174.33 44.82
5 500 800 700 5% 183.66 45.28
6 500 850 600 10% 190.33 45.59
7 600 750 700 10% 191.66 45.65
8 600 800 600 15% 168.90 44.55
9 600 850 650 5% 188.66 45.51
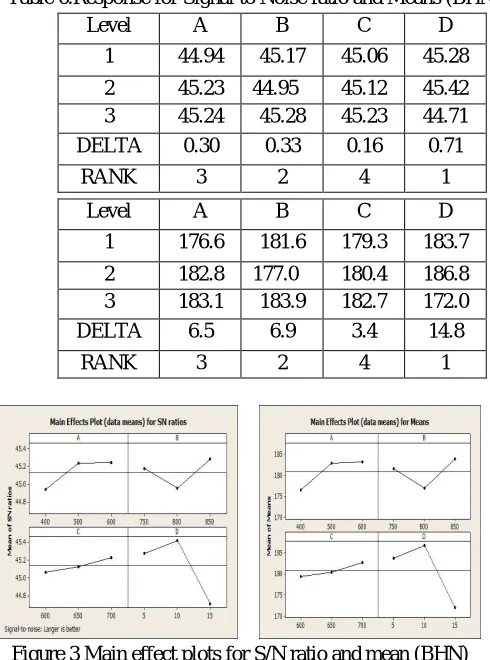
Table 6.Response for Signal to Noise ratio and Means (BHN)
Level A B C D
1 44.94 45.17 45.06 45.28
2 45.23 44.95 45.12 45.42 3 45.24 45.28 45.23 44.71 DELTA 0.30 0.33 0.16 0.71
RANK 3 2 4 1
Level A B C D
1 176.6 181.6 179.3 183.7
2 182.8 177.0 180.4 186.8 3 183.1 183.9 182.7 172.0
DELTA 6.5 6.9 3.4 14.8
RANK 3 2 4 1
Figure 3 Main effect plots for S/N ratio and mean (BHN)
It is evident from the tables that, among these parameters, percentage of addition of Silicon carbide (5%, 10% and 15%) is a dominant factor on the hardness [7].
[image:5.612.186.431.315.645.2]Table 7.Optimum Level Process Parameter
RUN A B C D SNRA UTS SNRA YS SNRABHN
7 600 750 700 10 48.97 48.65 45.65
C. Multiple Linear Regression Models
Statistical software MINITAB17 is used for developing a multiple linear regression equation.This developed model gives the relationship between independent/predictor variable and a response variable by fitting a linear equation to the measured data. The regression equation developed for UTS is,
UTS (MPa) = 311 + 0.0400 A - 0.062 B + 0.017 C - 3.15 D R-Sq = 92.5% R-Sq (adj) = 85.0%
The regression equation developed for YS is,
YS (MPa) = 274 + 0.0325 A - 0.023 B + 0.027 C - 3.88 D R-Sq = 94.0% R-Sq (adj) = 88.0%
The regression equation developed for BHN is,
BHN = 136 + 0.0326 A + 0.0233 B + 0.0336 C - 1.17 D R-Sq = 91.6% R-Sq (adj) = 82.2%
D. Confirmation Experiment
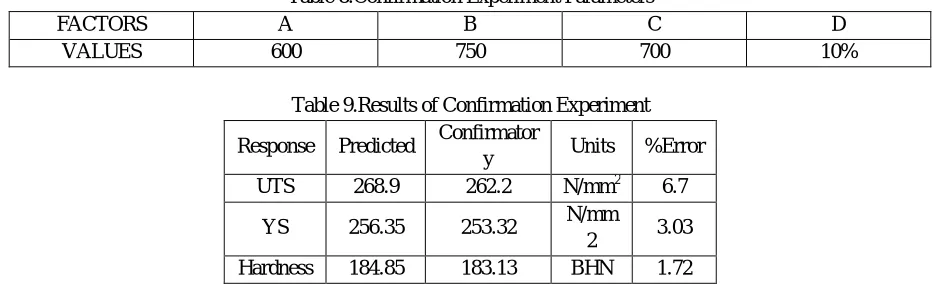
[image:6.612.71.541.353.498.2]Confirmation test is the last step in analysis process and the parameter values for four different factors are shown in table 8 and the results of confirmation test are shown in table 9.
Table 8.Confirmation Experiment Parameters
FACTORS A B C D
VALUES 600 750 700 10%
Table 9.Results of Confirmation Experiment
Response Predicted Confirmator
y Units %Error
UTS 268.9 262.2 N/mm2 6.7
YS 256.35 253.32 N/mm
2 3.03
Hardness 184.85 183.13 BHN 1.72
The results of confirmation experiments and their comparison with regression model which helps to identify the optical parameter values from the experimental analysis are shown in table 9. From the analysis the percentage error is too small indicate the Taguchi method is suitable for calculating ultimate tensile strength and hardness.
IV. CONCLUSION
This investigation is focused on the optimization of stir casting parameters for improving mechanical properties of Al6063-SiC-Al2O3 composite. The experiments were conducted according to Taguchi design of experiments (L9 Orthogonal array) by
considering four factors stirring speed, processing temperature, reinforcement preheat temperature and percentage addition of Silicon Carbide (5%,10% and 15%). The optimum conditions for ultimate tensile strength, yield strength and Brinell hardness number are identified. The following are the conclusions drawn from the present study.
Optimum ultimate tensile strength, yield strength and Brinell hardness number obtained from the experiment,that the third level of stirring speed, second level of processing temperature, third level of reinforcement pre-heat temperature and second level of percentage addition of Silicon Carbide are the optimum points, it was found that the seventh run is optimum.
REFERENCES
[1] Vignesh. V. Shanbhaga, Nitin. N. Yalamoorib, Procedia Engineering, pp607 – 613, 2014.
[2] Raghavendra. N, V. S. Ramamurthy, International Journal of Research in Engineering and Technology eISSN: 2319-1163 ,pp2321-7308, 2015. [3] A. K. M. Asif Iqbal, Open Journal of Composite Materials, No3,pp 97-106, 2013.
[4] Pradeep Kumar, Journal of Minerals and Materials Characterization and Engineering, No1, pp124-130, 2013.
[5] V. C. Uvaraja, N. Natarajan , Journal of Minerals and Materials Characterization and Engineering, No11,pp 757-768, 2012. [6] V. S. K. Venkatagalapthy, Journal of Surface Engineered Materials and Advanced Technology, No 2, pp11-15, 2012.
[7] RajeshkumarGangaramBhandare, Parshuram M. Sonawane, InternationalJournal of Engineering and Advanced Technology (IJEAT), pp2249-8958, 2013. [8] G. B. Veeresh Kumar, C. S. P. Rao, N. Selvaraj, M. S. Bhagyashekar,Journal of Minerals & Materials Characterization & Engineering, Vol. 9, No.1, pp.43-55,
2010.
[9] A.Baradeswaran, A.Elayaperumal, Procedia Engineering, No64, pp973 – 982, 2013.
[10] B. Karthikeyan, S. Ramanathan, V. Ramakrishnan, Materials and Design, No31, pp 92–95, 2010.