Comparative Study of Various Neural Network
Models for Software Quality Estimation
Mohan Goswami, Pradeep Kumar Bhatia
Abstract: - Quality measurement is a challenging job now a day to measure accurate quality. There are number of models available to measure the software quality. This paper presents the application of neural network in software quality estimation based on object oriented metrics. Our comparative focused on three neural network models namely Ward Neural Network (WNN), General Regression Neural network (GRNN) and Fuzzy Neural Network(FNN) based on object oriented metrics. The object oriented metrics used for this study are Coupling between Objects (CBO), Depth of Inheritance Tree (DIT), Number of Children (NOC), Response for a Class (RFC), Weighted Methods per Class (WMC), Lack of Cohesion in Methods(LCOM) and Message Passing Coupling (MPC). Fuzzy-Neural network is found to be more accurate as compared to other mentioned models on the bases of realistic data.
INTRODUCTION
Software quality describes the wide range of activities concerned with measurement in Software Engineering. It provides measurement of the software products and the process of software production/development. The complexity of the software increased with the developing of the large scale of the software’s. The software metrics are used for the successful execution of the software quality. The concepts of software metrics are coherent, understandable and well established. Different software metrics are produced and used for producing quality software. Object oriented metrics are one such metrics which are used from many years for obtaining quality software.
In general quality estimation means either estimating reliability or maintainability. Estimation reliability means measuring the number of the errors which can encountered in a program. There are number of statistical techniques which are used in software quality models. These quality models are often based on statistical relationships between measure of quality and measure of software metrics. The relationship between software metrics and quality factors are complex and nonlinear which resulting in limiting the accuracy of the conventional models.
We focused our study in the object oriented paradigm and used object oriented metrics that is Coupling between Objects (CBO), Depth of Inheritance Tree (DIT), Number of Children (NOC), Response for a Class (RFC), Weighted Methods per Class (WMC), Lack of Cohesion in Methods (LCOM) and Message Passing Coupling (MPC).
WNN is a back propagation network. It uses different activation functions which is applied to hidden layer slabs to detect different features in a pattern processed through a network to lead to better predictions. To detect mid-range of date gaussian function is applied to one hidden layer and gaussian complement to another hidden layer to determine highest and lower extremes of the date. The output layer produces different views of the data. Combining the two feature set in the output layer leads to a better predication.
FNN is a combination of fuzzy system and neural network where the fuzzy sets and rules are adjusted using neural networks tuning techniques in an iterative way with data vectors (input and output system data). Such systems show two distinct ways of behavior. The first phase is called the learning phase, it behaves like neural networks that learns its internal parameters off-line. The second phase is called the execution phase, it behaves like a fuzzy logic system. Both the techniques possess advantages and disadvantages which can be compensated by combining both and better results can be obtained. This both the techniques are complementary, which justifies its use together.
RELATED WORK
As software development has become an essential investment
for many organizations. As our day to day activities
dependencies keep on increasing on software. Software quality is gaining an ever increasing importance in effective software project management. Good software estimation is inherently a challenging task.
Although many attempts have been made to solve the problem in the last few decades by developing number of software quality estimation models and techniques but still we are not able to develop a model or technique which can used/applied to all type of software development process.
Software quality is the most important attribute of software which must have clear target. As per International Standard Origination (ISO) the software quality is defined as the software quality is the characteristics which are the ability reflecting the software products to satisfy the prescribe requirement and potential requirement and the sum of characteristics [1]. One of the effective way to analyze the software products is the software metrics whose measure enables software developer and software analyst to gain insight into the efficiency of the software process and projects. It measured different aspects of software complexity and therefore play an important role in
analyzing, improving software quality and in better
understanding of the software products.
According to Tom De Marco “you cannot control what you cannot measure”. With the help of software metric we are able to measure some property of the software or its component [2,
3]. Software metric are helpful in improving the quality of software, planning the budget, its cost estimation etc with the help of software metric we are able to understand the software product in an effective way.
Now a days OO approach is in dement and of great interest. In software development the use of OO methods are on rise and there is a growing need to both document and improve current practices in OO design and development.
Chidamber and Kamerer [4] proposed a set of OO metrics which could be used to manage OO design efforts. In their paper, they suggested that the primary use of the metrics by managers would be to identify outlying values that might reflect sub-optimal design practice.
Quah et al.in [5] presented the application of neural network in software quality estimation using OO metrics. Ward neural network and General Regression neural network are used to predict the quality of software and it is found the general Regression predicts more accurately then Ward Neural Network.
Briand et al. [6] performed an empirical study on the relationships between existing OO coupling, cohesion and inheritance measures and the probability of fault detection in system classes during testing. Their univariate analyses have shown that many coupling and inheritance measures are strongly related to the probability of fault detection in a class. Their multivariate analysis results showed that by using some of the coupling and inheritance measures, very accurate models could be derived to predict in which classed most of the faults actually lie.
Most of the early predication models are built using statistical models limit the accuracy as the relationship between static software metrics and quality factors are complex and nonlinear.
sophisticated model techniques capable of modeling complex functions.
In 1992, Khoshgoftaar [7] adopted back propagation neural network to predict the wrong number of software models using 8 software measurement parameters as the input to the neural network get better result than statistical models.
In 2002 Donald E. Neumann [8] combine principal components analysis and neural network to established a PCA-ANN prediction model of software quality to predict the faults of software.
Basili et al. [9] observed that Chidamber and Kamerer metrics were associated with fault proneness based on the study of 8 medium size system.
Khoshgoftaar [10] used neural network as a tool for the prediction of software quality. A large telecommunication system has been presented by them which classify the modules as either fault prone or not fault prone. A comparison between the neural network and a non parametric discrimination model was done and the result shows that neural network has better predicative capability then the other one.
Hu and Zhong [11] proposed a model to predict software module risk based on neural network. They applied the learning vector quantization network for prediction of the software quality.
Although the neural network has been applied to the number of fields successfully. But now a day’s researchers are combining fuzzy and neural network together to obtain better results and this combination is called fuzzy-neural system.
Wang Tie Jiang [12] proposed a software reliability prediction model which combined neural network and fuzzy logic and used the most prominent factors influence the software reliability for the input of neural network.
Jim Shum and He Pei [13] proposed a prediction model of software by using fuzzy-neural network.
Quah and Thwin [14] predicted the number of faults in a particular class by using a multiple regression model and a
neural network model. They used the real time sub-system data from 3 industrial houses and found the neural network can predict more accurately then regression model.
Khoshgoftaar, in 2001 [15] introduced the fuzzy nonlinear regression techniques based on high reliable system of engineering and he adopted the fuzzy nonlinear regression technique, fuzzy logic and neural network to predict software quality and get better results.
Related Terms (Selection of OO Metrics)
Object oriented metrics are used to predicts the software defects using various neural networks. Objects oriented that have strong relationship with software quality has been selected. To indicate the presence of software defects the following existing metrics (Chidamber and Kemerer, 1994; Tang et al., 1999) are used [4]:
Coupling Between Objects (CBO) is a count of the number of classes that are coupled to a particular class. The methods of one class call the methods or access the variables of the other class. Coupling measures the degree of inter dependence among the components of a software system. High coupling results more complex system which is hard to understand, higher the sensitivity to changes in other parts of the design and therefore maintenance is more difficult. A high coupling has been found to indicate fault-proneness.
Depth of Inheritance Tree (DIT) is defined as maximum inheritance path from the class to the root class. The deeper a class is in the hierarchy, the more methods and variables it is likely to inherit making it more complex to predicts its behavior. Deep tree indicate greater design complexity since more methods and classes are involved. a high DIT has been found to be contain more faults.
Response For a Class (RFC) The response set of a class is a set of methods that can potentially be executed in response to a message received by an object of that class. A given method is counted only once in RFC even if it is executed by several methods M. Since RFC specifically includes methods called from outside the class, it is also a measure of the potential communication between the class and other classes. A large RFC has been found to indicate more faults. Classes with a high RFC are more complex and harder to understand. Testing and debugging is complicated.
Weighted Methods per Class (WMC) is defined as the number of methods defined in a class. WCM measures the complexity of an individual class. A class with more member functions than its peers is considered to be more complex and therefore more error prone [3]. The larger the number of methods in a class, the greater the potential impact on children since children will inherit all the methods defined in a class.
Lack of Cohesion of Methods (LCOM) is defined as the numbers of pairs of methods that shared references to instance variables. Every method pair combination in the class was assessed. If the pair do not share references to any instance variable then the count is increased by 1 and if they do share any instance variables then the count is decreased by 1. LCOM is viewed as a measure of how well the methods of the class co-operate to achieve the aims of the class. A low LCOM value suggests the class is more cohesive and is viewed as better.
Message Passing Coupling (MPC) tells how many messages are passed among objects of the classes. The number of message send out from a class indicates how dependent the implementation of the local methods is on the methods in other class.
Study of Neural Network System
We’ll study GRNN, WNN and FNN networks whose details are given below:
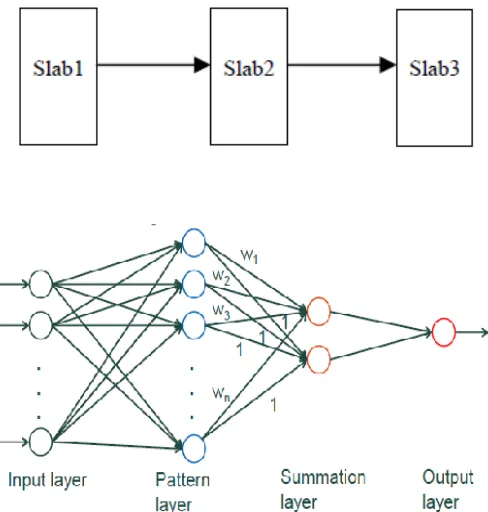
[image:5.612.316.560.151.407.2]General Regression Neural Network (GRNN) architecture is show below [5]:
Figure 1, represent structure of GRNN
The input layer is the layer where the inputs are applied. The number of neuron in the input layer is the number of inputs. The hidden layer is the layer where a nonlinear transformation is applied on the data from input space to the hidden space. The most application the hidden space is of high dimensionality. The number of neuron in the hidden layer is usually the number of pattern in the training set as each pattern is represented by one neuron. The output layer is the layer where the outputs are produced. The number of neuron in the output layer corresponds to the number of output.
In 1991, Specht shows that algorithm in GRNN is able to provide a smooth transition from one observed value to another even with sparse data in a multidimensional measurement space. It has fast training time and even perform well in noisy environment and give enough data. It can model non-linear function also in well. GRNN application are able to produce continuous valued output.
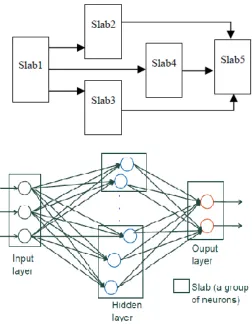
[image:6.612.19.271.294.618.2]Ward Neural Network (WNN) architecture shown below is proposed by NeuroShell 2 in 2001. It is a back propagation network and suitable for practical application.
Figure 2, represent structure of WNN
The above architecture is a three layer back propagation network and much suitable for different application. It
can be trained easily and quickly as compared to 4 or 5 layer network.
A slab is a group of neurons. The slab 1 is the input layer where the inputs are applied. The output of this layer is used as the inputs for the hidden layer. The hidden layers in neural network are known as feature detectors as all the calculation are down at this layer. The slab 2, 3 and 4 are used in the hidden layer and there different activation functions are used for one for each slab. This offers three ways of viewing the data. On slab 2 we use the Gaussian function. It is a unique function as it is not a increasing function unlike the others. It is a classic bell shaped curve, which maps high values in low ones and maps mid-range values into high one.
On slab 3 we use the hyperbolic tangent function. It is better for continuous valued output especially if the linear function is used on the output layer. On slab 4 we used the Gaussian complement to get the meaningful characteristics in the extremes of the data. The slab 5 is used as the output layer and a linear function is used on this layer.
We use a smaller learning rate 0.1 and momentum 0.1 as our
network is predictive network where outputs are continuous values rather than categories.
Fuzzy Neural Network
Fuzzy neural network is the combination of the neural network and fuzzy system where the limitation of one system is compensated by strong points of another system. Our fuzzy neural network is build on the rules which were extracted by the use of attribute reduction algorithm. Before using attribute reduction algorithm we need to discretize the data.
Discretization of data
A variety of methods like equal interval method, equal frequency method and fuzzy method [16] can be used for the discretization of attribute value. The continuous data is descretized on the bases of self organizing map network (SOM). It is neural network based on self organizing learning algorithm.
1. Initialize the initial classification values of m of the SOM network and the initial dimension of condition attribute d=1
2. Condition attribute value is sorted in dimension d from low to high and then this sorted SOM network value is classified in dimension d.
3. Mean of the boundary value is used as the dividing value of class m in the 2 adjacent classes.
4. Quantize the condition attribute in dimension d by condition attribute quantification parameters
5. d=d+1, return (2) until the finally dimensional.
Structure of Fuzzy Neural Network
The structure of the fuzzy neural network is shown below:
Figure 3, represent structure of fuzzy neural network [17]
The first layer is the input layer in which the node i corresponds to component {Xi} in input vector X.
The second layer is fuzzy layer where each node represents a variable value of fuzzy language whose number is decided by the values of discretization process. The output of this layer is the membership degree.
The third layer is rule layer where the number of neuron is equal to the number of decision rule. Each node of this layer represent the former part of a fuzzy rule. Each neuron is a multiplier which calculate the multiplier of membership degree of the
entire condition attribute and the multiplier decides the rule k. the weight between this layer and fuzzy layer is 1.
The fourth layer is normalized layer which realizes the normalized calculation. The number of neuron in this layer is equal to the number of neuron in third layer.
The fifth layer is the output layer which product the final decision results. The number of neurons in this layer is the number of decision attributes.
Case Study for comparison
Relationships between static software metrics and quality factors are often complex and nonlinear, limiting the accuracy of conventional approach. To overcome the above limitation, neural networks are used at modeling nonlinear functional relationships.
Each metrics is standardized to a mean of zero and one for a variance which result that we get a one standard variation for each metrics. After this we performed the principal component analysis. Three principal components are identified with the help of Principle component analysis (PCA) from QUES system which capture 59.82%, 15.42% and 13.86% of the data set variance which give representation of 89.1% of the population.
Below table shows the three PCs of the data.
Table: 1 Rotated Principal Components for the QUES System [17]
Metrics PC1 PC2 PC3
DIT 0.06 0.027 0.966
MPC -0.023 0.966 0.037
RFC 0.877 0.333 0.043
LCOM 0.869 -0.156 0.059
[image:7.612.19.276.328.477.2]The first principal component shows high correlation between metrics with RFC, LCOM and WMC.
The second principal component is highly correlated with MPC.
The third principal component shows highest correlation with DIT.
Data is divided into three parts which are training, testing and production in 3:1:1 ratio which is most accepted ration used by most neural network researchers. 19 patterns are randomly extracted for test and production set and remaining 59 patterns are used for training set. The dependent variables represent the number of faults per class and the independent variables were the three PCs identified above.
[image:8.612.317.576.105.320.2]Fuzzy Neural Network of multiple input, multiple output can be divided into many fuzzy neural network of multiple input – one output. The below mentioned NASA data is used to predict the object-oriented software reliability. Object-oriented metrics CBO, DIT, NOC, RFC, WMC and LCOM used as input and reliability for output.
Table: 2, NASA sample data.[19]
No. of samples
Metrics
CBO DIT LCOM NOC RFC WMC
1 24 4 100 0 110 73
2 19 4 100 0 78 30
3 13 1 88 0 99 99
4 21 4 100 0 68 30
5 17 2 90 0 69 36
6 10 1 88 0 22 22
7 19 3 94 0 53 17
8 14 2 90 0 37 25
9 18 2 100 1 38 13
10 6 2 59 0 33 25
11 4 1 75 2 8 8
12 1 4 100 0 53 22
13 3 2 100 0 38 11
14 10 2 46 0 23 15
15 0 1 100 1 98 98
16 14 3 96 0 48 18
17 14 4 87 5 61 26
18 17 5 93 0 54 6
19 12 2 83 0 52 39
[image:8.612.316.586.414.530.2]Next step is to construct GRNN and WNN architecture with the help of data mentioned in table 2 and FNN with the help of data mentioned in table 3.
Table 3 shows node summery of three networks.
No. of nodes used in different layers
Input Layer Hidden Layer Output Layer
GRNN 3 71 1
WNN 3 9 1
FNN 6 56 1
To compare the goodness of fit of models we well measure the parameter mean square error (MSE) for each model. After analyzing the data shown in table 1 and table 2, the result obtain is shown in table 4.
[image:8.612.25.284.437.667.2]GRNN WNN FNN
Mean Square Error (MSE) 817.004 509.790 20.5426
Conclusion
Software quality is directly or indirectly influenced by number of factors and each factor should be evaluated carefully. In our paper we have taken GRNN, WNN and FNN to determine the mean square error value. In order to get an accurate, objective and scientific evaluation for the software quality. This paper presents GRNN, WNN and FNN models for quality prediction. The realistic data collected from different sources shows that FNN can better predict the software quality.
Next work is find out the different application where a particular network provide better result. As it may be possible that GRNN and WNN may perform well as compared to FNN.
References
[1] Briand, L., et al., Exploring the Relationships between Design Measures and Software Quality in Object-Oriented Systems, Journal of Systems and Software, vol. 51, pp. 245-273, 2000
[2] Manik Sharma, gurdev singh, “A Comparative Study of Static Object Oriented Metrics”, IJoAT
[3] S.R Chidamber and C.F. Kemerer, “A Metrics Suite for
Object Oriented Design”, IEEE Transactions on Software
Engineering, Vol. 20 No. 6
[4] Chidamber, S. and Kemerer, C., A Metrics Suite for Object Oriented Design, IEEE Transactions on Software Engineering, vol. 20,pp. 476-493, 1994
[5] Quah, T.S. and Thwin, M.M.T., Application of Neural Networks for Software Quality Prediction using Object-Oriented Metrics”, IEEE Transactions on Neural Networks, 2003.
[6] Briand, L., et al., Assessing the applicability of faultproneness models across object-oriented software projects, IEEE Transactions on Software Engineering, vol. 28, pp. 706 – 720, 2002
[7] T.M. Khoshgoftaar, A.S. Pandya, H.B. More A neural-nerwork approach for predicting software development
faults. IEEE Computer, vol. 17, No. 8, pp. 83-88, 1992
[8] Donal E.Neumann.An Enhanced Neural Network Technique for Software Risk Analysis.IEEE Transaction on Software Engineering, vol. 28, No. 9, pp. 904-912, 2002
[9] V. Basili, L.Briand and W. Melo ―A Validation of Object-Oriented Design Metrics as Quality Indicators‖, IEEE Transactions on Software Engineering, vol. 22 No.10, pp. 751-761, 1996
[10] T.M. Khoshgaftaar, E.D. Allen, J.P. Hudepohl and S.J. Aud "Application of neural networks to software quality modeling of a very large telecommunications system," IEEE Transactions on Neural Networks, Vol. 8, No. 4, pp. 902--909, 1997.
[11] Q. Hu and C. Zhong, ―Model of predicting software module risk based on neural network‖(in Chinese), Computer Engineering and Applications, Vol.43, No.18, pp.106-110, 2007.
[12] Wang Tiejiang, Li Meng. A Fuzzy Neural-Net Model for Software Reliability Evaluation[J]. Computer
Engineering and Applications, vol. 24, pp. 37-40, 2003
[13] LIAO Jin-shun, He Pei. Method of Software Quality Evaluation Based on Fuzzy Neural Network. Computer
[14] J. T. S. Quah, M. M. T. Thwin, “Prediction of Software
Readiness Using Neural Network”, In Proceedings of 1st
International Conference on Information Technology & Applications, Bathurst, Australia, pp. 2312-2316, 2002.
[15] Zhiwei,T.M.Khoshgoftaar.Software quality prediction for high-assurance network telecommunications
systems.The Computer Journal, vol. 44, No. 6, pp. 557-568, 2001
[16] Yu Kun,Liu Zhigui,Huang Zhengliang. Overview of the Discretization Methods in the Application of Rough Set
Theory. Journal of SWUST, vol. 20, No. 4, pp. 32-36, 2005
[17] Li Guoyong.Intelligent control and
Matlab[M].BeiJing:electronic industry,2005
[18] Mie Mie Thet Thwin, Tong-Seng Qual, Application of neural networks for software quality prediction using Object-Oriented Metrics, International Conference on Software Maintenance, 2003. ICSM 2003
![Table: 1 Rotated Principal Components for the QUES System[17]](https://thumb-us.123doks.com/thumbv2/123dok_us/8588347.863095/7.612.19.276.328.477/table-rotated-principal-components-the-ques-system.webp)

