M E T H O D
Open Access
Gene-level differential analysis at
transcript-level resolution
Lynn Yi
1,2, Harold Pimentel
3, Nicolas L. Bray
4*and Lior Pachter
2,5*Abstract
Compared to RNA-sequencing transcript differential analysis, gene-level differential expression analysis is more robust and experimentally actionable. However, the use of gene counts for statistical analysis can mask transcript-level dynamics. We demonstrate that‘analysis first, aggregation second,’where thepvalues derived from transcript analysis are aggregated to obtain gene-level results, increase sensitivity and accuracy. The method we propose can also be applied to transcript compatibility counts obtained from pseudoalignment of reads, which circumvents the need for quantification and is fast, accurate, and model-free. The method generalizes to various levels of biology and we showcase an application to gene ontologies.
Keywords:RNA-sequencing, Differential expression, Meta-analysis,Pvalue aggregation, Lancaster method, Fisher’s method,Šidák correction, RNA-seq quantification, RNA-seq alignment, Pseudoalignment, Transcript compatibility counts, Gene ontology
Background
Direct analysis of RNA abundance by sequencing comple-mentary DNAs (cDNAs) using RNA-sequencing (RNA-seq) offers the possibility of analyzing expression at the resolution of individual transcripts [1]. Nevertheless, RNA-seq con-tinues to be mostly studied at the gene level, partly because such analyses appear to be more robust [2] and also because gene-level discoveries are more experimentally actionable than transcript-level discoveries due to the difficulty of knocking down single isoforms [3].
Gene-level RNA-seq differential analysis is, at first glance, similar to transcript-level analysis, with the caveat that transcript counts are first summed to obtain gene counts [4,5]. However, despite such superficial simplicity, there is considerable complexity involved in transitioning from transcripts to genes. In [6], it was shown that a naïve approach of summing transcript counts to gene counts leads to inaccurate estimates of fold-change between con-ditions when transcripts have different lengths. Because transcript counts are proportional to transcript lengths, summing transcript counts is not equivalent to summing transcript abundances.
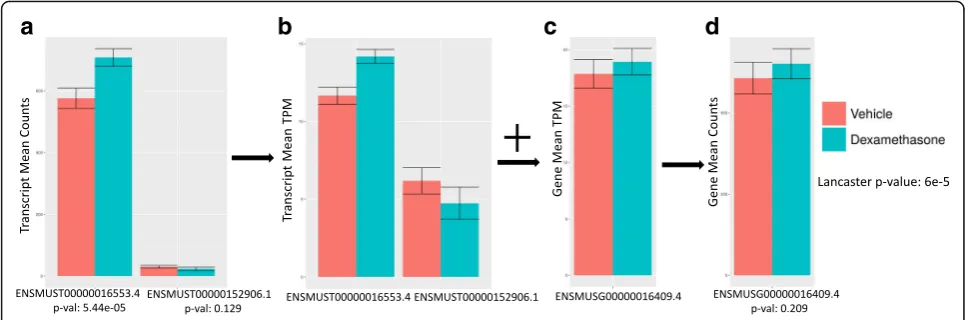
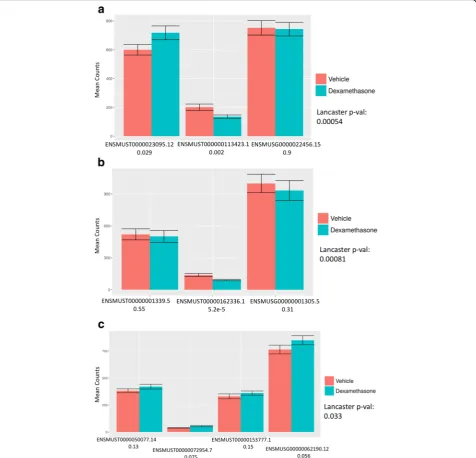
A remedy to this problem is to estimate gene abun-dances (e.g. in transcript-per-million units) by summing transcript abundances [7], but regularization methods for variance estimation of gene counts [8] cannot be directly applied to abundances. For this reason, recent workflows for gene-level differential analysis rely on converting gene abundance estimates to gene counts [2,9]. Such methods have two major drawbacks. First, even though the result-ing gene counts can be used to accurately estimate fold changes, the associated variance estimates can be distorted (see Fig.1 and Additional file1: Section 1). Second, the assignment of a single numerical value to a gene can mask dynamic effects among its multiple constituent transcripts (Fig. 2). In the case of “cancellation” (Fig. 2a), the abun-dance of transcripts changing in opposite directions cancels out upon conversion to gene abundance. In “domination” (Fig. 2b), an abundant transcript that is not changing can mask substantial change in abundance of a minor tran-script. Finally, in the case of “collapsing” (Fig. 2c), due to over-dispersion in variance, multiple isoforms of a gene with small effect sizes in the same direction do not lead to a significant change when observed in aggregate, but their independent changes constitute substantial evidence for differential expression. As shown in Fig.2, these scenarios are not only hypothetical scenarios in a thought experi-ment, but events that occur in biological data.
* Correspondence:[email protected];[email protected] 4Innovative Genomics Institute, Berkeley, CA, USA
2Division of Biology and Biological Engineering, Caltech, Pasadena, CA, USA
Full list of author information is available at the end of the article
Rather than aggregating quantifications before differ-ential analysis, one approach is to first perform a transcript-level differential analysis followed by a gene-level meta-analysis. Such a method is implemented in the DEXSeq program [10], although it is not effective at recovering differential events lost due to collapsing and is suboptimal even for cancellation or domination events (see “Results” and Additional file 1: Section 2). Meta-analysis has been suggested for microarray studies to ag-gregate probe-level P values [11] and is performed in genome-wide association studies to aggregate single nucleotide polymorphism P values to make gene-level [12–14] and pathway-level inferences [14, 15], but such approaches do not appear to have been extensively explored for RNA-seq.
We present a new framework for gene-level differen-tial analysis that utilizes the Lancaster method [16]. In this framework, differential expression is performed on transcripts as usual, but then transcript-level p values are aggregated to obtain gene-level p values. (See
“Methods” for details about the Lancaster method. See Additional file 1 for applicability of the Lancaster method to RNA-seq.)
Our approach can be based on pvalues derived from transcript-level differential analysis, but can also be ap-plied topvalues derived from comparisons of transcript compatibility counts (TCCs), a concept introduced by the pseudoalignment method in kallisto [17]. TCCs are the number of reads that are compatible with a set of transcripts, i.e. an equivalence class. In default RNA-seq quantification mode, kallisto matches each read with its equivalence class, thus generating TCCs, and then applies the expectation-maximization (EM) algorithm on
TCCs to obtain transcript quantifications. Differential analysis performed on directly TCCs has the advantage of being fast and model-free, and we show that it is particularly useful for positionally biased RNA-seq data.
Finally, we highlight the generality of our approach at varying levels of biological resolution by extending it to gene ontology analysis. In contrast to classical gene ontology (GO) tests that identify enrichment of GO terms with respect to gene lists, our approach identifies GO terms in which there is significant perturbation among the associated genes. We combine this idea with TCC-based differential analysis to illustrate how GO analysis can be performed on RNA-seq data without transcript quantification.
Results
We first examined the performance of aggregation in comparison to standard gene-level differential expression methods using three simulated scenarios from Pimentel et al. [9]. In these simulations, transcripts are perturbed in-dependently, in a correlated fashion with other transcripts of the gene, or according to effect sizes observed in a bio-logical experiment. In the first scenario of independent ef-fects, random transcripts in the transcriptome are independently chosen to be perturbed and the effect size for each transcript is chosen independently. In the second scenario of correlated effects, genes are independently chosen to be differentially expressed and all transcripts of the same gene are perturbed in the same direction. In the third scenario of experimentally based effects, effect sizes are learned from an experimental dataset and applied to the simulation (see “Methods” for more details). Each of the three scenarios was simulated 20 times.
a
b
c
d
[image:2.595.56.539.88.248.2]We evaluated the performance of various aggregation methods on these simulations with two differential ex-pression methods: sleuth and DESeq2. These differential expression methods were chosen for their superior per-formance in previously published simulations [9]. sleuth utilizes bootstraps on reads to estimate inferential
vari-ance due to read-mapping and quantification
uncertainty, which is then used in a linear model to per-form differential expression analysis. DESeq2 utilizes a negative binomial model on counts [18]. We evaluated every aggregation method using each differential expres-sion method in each of the three simulation scenarios.
[image:3.595.61.538.89.547.2]after experimental effect sizes, plotted as a false discovery rate (FDR)-sensitivity tradeoff curve. (Additional File 1: Figures S1 and S2 show results with other two simulation scenarios using sleuth. Additional File1: Figure S3 shows results with the three simulation scenarios using DESeq2.) Aggregation of transcript p values using the Lancaster method [16] outperforms standard gene-level analysis; it provides greater power at lower FDR. Furthermore, Lancaster-based aggregation outperforms the Šidák method of DEXSeq, which utilizes the minimum tran-script p value to make the gene-level determination (method corrected, Additional file1: Section 2). While the Šidák method performs well when transcripts are perturbed independently (Additional file 1: Figure S1), it performs very poorly in the more common case of corre-lated effect (Additional file 1: Figure S2). In addition to providing more power at lower FDR than the other methods, the Lancaster method is also better at control-ling and accurately reporting FDR (See Fig. 3b for reported FDRs). Additional file1: Figure S3 shows similar improvements when aggregation is performed using
p values that are derived from DESeq2 [18] instead of sleuth. Regardless of the differential expression method used to computepvalues, the Lancaster method of aggre-gation outperforms the other methods, showing that im-provements in performance are due to the aggregation method and not the differential expression software.
Transcript-levelpvalues are computed from transcript quantifications, a process that introduces uncertainty from multiple-mapping RNA-seq reads. Pimentel et al. [9] showed that propagating uncertainty from the
transcript quantification to differential expression ana-lysis increases accuracy of the differential expression analysis. In kallisto [17], pseudoalignment was per-formed to generate TCCs, which are the number of reads that are compatible with sets of transcripts and therefore do not contain any quantification uncertainty. Given the improved results observed with performing Lancaster aggregation, we asked whether it is possible to perform differential expression analysis directly on TCCs and aggregate on TCC pvalues to obtain gene pvalues, thereby bypassing transcript quantification and the uncertainty it entails altogether. Figure 3 shows that aggregating TCC p values outperforms other methods, including that of aggregating transcript p values. Fur-thermore, aggregating TCCpvalues reported FDRs that are as or more accurate than those reported by other methods. In this instance, we used only TCCs that mapped solely to the transcripts of a single gene, which accounts for 88% of the RNA-seq reads. It may be pos-sible to continue to improve performance by accounting for intergenic TCCs.
Aggregation of TCCs is useful when quantification is complicated due to non-uniformity of reads coverage across transcript spans. While non-uniformity in cover-age is prevalent in RNA-seq [19], it is particularly extreme in variants of RNA-seq that enrich for 5′or 3′ sequences. We used TCC aggregation to perform differ-ential expression on QuantSeq data [20], where an experiment involved mechanically stretching rat primary type I like alveolar epithelial cells and then performing QuantSeq 3’ messenger RNA (mRNA) sequencing to
a
b
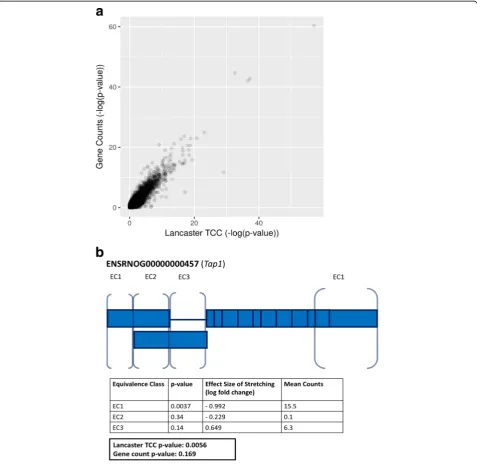
[image:4.595.56.540.88.270.2]detect changes in 3′untranslated region (UTR) expres-sion ([21], GEO Series GSE89024). Figure4ashows that overall results with TCC-based aggregation are similar to standard analysis based on gene counts obtained by summing the number of reads that map to any constitu-ent isoforms. However, TCC-based aggregation allows for the discovery of events that are masked in standard count-based analysis. Figure4bshows an example where
we discovered 3’UTR isoform switching, an event which could not be identified with a gene counts-based ana-lysis. While p value aggregation works well for gene-level differential expression analysis, aggregation can be extended to other natural groupings. To demonstrate the generality of the approach, we appliedpvalue aggre-gation to gene ontologies [22]. Classic gene ontology (GO) analysis of a RNA-seq experiment involves first
Fig. 4Analysis of positionally biased RNA-seq data using TCC aggregation. A log-log plot ofpvalues comparing aggregated sleuth-derived TCCp
values using the Lancaster method (x-axis) topvalues obtained by differential analysis in DESeq2 with gene counts (y-axis) shows overall agreement (a). DESeq2 applied on gene counts discovered 460 DE genes (FDR < 0.05); Lancaster aggregation on TCCs discovered 243 genes (FDR < 0.05). TCC aggregated analysis can detect differential 3’UTR usage that is masked in gene count analyses (b). An example is shown from the rat geneTap1, with
[image:5.595.60.538.192.657.2]performing gene differential expression analysis to obtain either a list of statistically differential genes (i.e. all genes with q-value < 0.05) or a rank order list of genes (i.e. ordered bypvalue) and then identifying GOs that are statistically enriched in this gene list. Common statistical tests for enrichment include Fisher’s exact test and Wilcoxon rank-sum test [23, 24]. Instead of testing for enrichment of GOs, we examined the complemen-tary question of“perturbation analysis,”namely, whether the GO is significantly perturbed. To test for perturb-ation, we aggregatedpvalues based on transcript quanti-fications or TCCs for all genes in each GO term to obtain p values for each GO term, which are then Bonferroni corrected. Unlike standard GO enrichment analysis, this perturbation analysis utilizes the informa-tion derived from all genes and reveals informainforma-tion not only about membership, but also about the significance of perturbation.
We performed differential expression and GO analysis on recently published RNA-seq data that examined the effect of dexamethasone treatment on primary neural progenitor cells of embryonic mice ([25], GEO Series GSE95363). First, we performed differential expression using each of the four previously discussed aggregation methods to obtain differential gene lists (FDR < 0.05). (Additional file 1: Figure S4 compares differential expression with sleuth standard gene mode vs Lancaster aggregating TCC p values.) Then, we applied classical GO enrichment analysis to each method’s differential gene list. The Lancaster method applied to TCC-derived
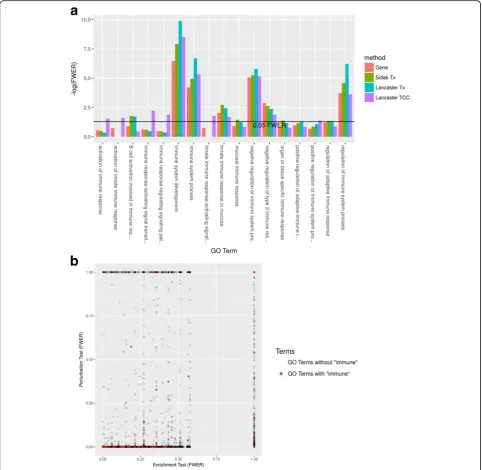
p values produced the differential gene list that is enriched for the most “immune”-containing GO terms (Fig. 5a). To apply the GO perturbation test, we per-formed further aggregation on the gene pvalues result-ing from differential expression analysis to generate GO
pvalues, resulting in a total of four GO perturbation tests. Each GO perturbation test resulted in a perturbed GO list (FWER < 0.05) that was more enriched for “immune” -containing GO terms than the corresponding enrichment test (FWER < 0.05) (Additional file1: Figure S5).
To highlight some specific results, in the GO perturb-ation test based on aggregating TCC pvalues, we found 6396 GO terms (< 0.05 FWER) perturbed by dexametha-sone treatment. Example terms at the top of the per-turbed list included: system process (GO:0003008); response to stress (GO:0006950); metabolic process (GO:0008152); immune system process (GO:0002376); inflammatory response (GO:0006954); and response to hormone (GO:0009725). As a comparison, the corre-sponding classical enrichment analysis using Fisher’s exact test revealed 2123 enriched GO terms (< 0.05 FWER). Many of the perturbed GOs mentioned above were also enriched, but system process and inflamma-tory response were not (FWER = 0.27 and 1.00). In other
words, an enriched ontology is likely perturbed, but not vice versa, and indeed, many “immune”-containing GO terms were perturbed but not enriched (Fig. 5b). These results suggest that perturbation analysis can be a useful and powerful complementary analysis to standard GO enrichment analysis.
Discussion
We have shown that aggregating p values to obtain gene-level p values is a powerful and tractable method that provides biologically interpretable results. By using only the resultingpvalues from a differential expression analysis, aggregation bypasses issues of different vari-ances and directions of change across constituent tran-scripts, allowing it to capture cancellation, domination, and collapsing events. All the examples of failure modes of traditional gene differential analysis showcased in Fig.2 were successfully identified with the Lancaster method. Furthermore, performing the Lancaster method on TCC p values leverages the idea of pseudoalignment for RNA-seq, enabling a fast and model-free approach to differential analysis that circumvents numerous drawbacks of previous methods.
The method of pvalue aggregation is also extendable to testing other features of biological interest. We have demonstrated its utility for GO analysis to test for perturbation of gene ontologies, a complementary ana-lysis that can be used in addition to existing GO enrich-ment tests. Aggregation can be performed hierarchically to maintain resolution at all levels including transcripts, genes, and GO terms. Further applications can include testing for intron retention, differential transcript start site (TSS) usage, and other use cases where aggregation of features is of interest. Finally, gene-level testing directly from TCC counts is particularly well-suited for single-cell RNA-seq analysis, where many technologies produce read distributions that are non-uniform across transcripts.
Conclusions
Transcript differential analysis and gene differential ana-lysis for RNA-seq have been two independent proce-dures up until now. Aggregating transcriptpvalues with the Lancaster method to call gene differential expression not only outperforms other gene-level methods, it also retains information about transcript dynamics and
[image:7.595.57.540.88.558.2]Methods
Aggregation ofpvalues
Fisher’s method aggregates K p values p1,…, pK, which, under the null hypothesis, are independent and uniformly distributed between 0 and 1. Under the null hypothesis, the test statisticT ¼PKi¼1−2 logðpiÞ is chi-squared distributed
with degrees of freedom (df) = 2K. The aggregatedpvalue is therefore 1−ϕðPKi¼1−2 logðpiÞÞ whereϕis the
cumula-tive distribution function (CDF) of a chi-squared distribu-tion withdf = 2 K[27].
The Lancaster method [16] generalizes Fisher’s method for aggregating p values by introducing the possibility of weighting thepvalues with weightsw1,…,wK. According to the Lancaster method, under the null hypothesis where all studies have zero effect, the test statisticT ¼PKi¼1ϕ−1wiðpiÞ,
whereϕ−1wiis the inverse CDF of the chi-squared distribution with df = wi, follows a chi-squared distribution with
df ¼PKi¼1wi. Fisher’s method is a specific instance of the
Lancaster method where all p values are uniformly weighted by 2 and we found that the Lancaster method ap-plied with a weighting scheme based on transcript counts outperformed Fisher’s method (Additional file1: Figure S6). We investigated whether the assumptions of Fisher’s and the Lancaster method, namely that pvalues are in-dependent and uniformly distributed under the null hy-pothesis, apply to RNA-seq. Additional file1: Figure S7 shows a distribution of the transcript p values for the dexamethasone RNA-seq data we examined. Aside from a peak close to 0, presumably corresponding to the dif-ferential transcripts, thepvalues appear to be uniformly distributed. Furthermore, the Additional file1: Section 3 contains a walkthrough of the experiments we per-formed to test the independence between transcripts under the null hypothesis, showing that while transcripts of the same are not independent in general, the depend-ence is weak and does not lead to exaggerated pvalues or inflated FDRs (Additional file1: Figures S8 and S9).
TheŠidák method [28] utilizes a test based on the mini-mumpvaluem = min(p1,…, pK), namely the adjustmentθ= 1 – (1−m)K. In the context of Kisoforms with pvalues
p1,…, pK,θis the gene-levelpvalue based on adjusting for the number of isoforms in the gene. If there areM genes, the adjustments will generatepvaluesθ1,…, θM, which can be corrected for multiple testing. This method is similar to the perGeneQvalue result from DEXSeq [10], and while both methods control the FDR, the gene ranking is different between the two methods (Additional file1: Section 2).
Transcript differential analysis and aggregation
RNA-seq reads were quantified with kallisto v.0.43.1 to ob-tain transcript counts and abundances. These transcript counts were used as inputs in differential expression methods sleuth and DESeq2 in order to obtain
transcript p values, which were then aggregated with the Lancaster method to obtain gene p values. sleuth and DESeq2 were run with their respective default filters and the Wald test. sleuth was run with 30 bootstraps. Transcripts filtered out from the differential ex-pression analysis due to low counts were also filtered out from thepvalue aggregation. To obtainpvalue weights for the Lancaster method, we used as weights the mean ex-pression level for the transcript extracted by the differential expression analysis (i.e. the mean_obs parameter in sleuth, the baseMean parameter in DESeq2). FDRs were calculated for the gene-specificp values using the Benjamini– Hoch-berg method. While we used the Wald test in this manu-script for obtaining tranmanu-script and gene differential expression analysis, we also tested the likelihood ratio test, which showed similar improvements with Lancaster aggre-gation and whose performance is comparable to the Wald test (Additional file1: Figure S10).
Transcript compatibility count differential analysis and aggregation
TCCs of RNA-seq reads were obtained with the kallisto
pseudo option, which outputs a TCC matrix whose two dimensions are the number of samples and number of equivalence classes. Each TCC represents the RNA-seq counts corresponding to an equivalence class of tran-scripts. All TCCs corresponding to transcripts from more than one gene were filtered out from the analysis; 88% of reads were retained after applying this filter. The remaining TCCs were used to perform differential ex-pression with sleuth [9] and DESeq2 [18] by using TCCs in lieu of transcript/gene counts. In order to use sleuth, we performed 30 bootstraps on TCCs, whose results were inputted into sleuth to estimate inferential vari-ance. Non-expressed TCCs were filtered from the sleuth analyses and the default filter in DESeq2 was used. Both methods were performed with the likelihood ratio test because we found that the Wald test applied to TCCs reported overly liberal FDRs. The resulting TCC p
values from the differential expression analysis were aggregated using the Lancaster method, with p value weights equal to the log-transformed mean counts normalized to 1. In other words, given K TCCs of the same gene with mean counts t1, …, tK, the weight for the ith TCC is wi¼PKlogðtiþ1Þ
j¼1logðtjþ1Þ .
Gene differential analysis
counts were obtained by summing reads that uniquely map to a gene. Both sleuth and DESeq2 were run with the Wald test and their respective default filters.
Simulations
The simulations used to benchmark the method followed the approach of Pimentel et al. [9]. A null distribution consisting of the negative binomial model for transcript counts was learned from the Finnish female lymphoblastic cell lines subset of GEUVADIS [29]. A distribution of fold changes to the mean was learned from an experimental dataset from Trapnell et al. [6]; 20% of genes were chosen randomly to be differentially expressed, with fold changes of the transcripts assigned by rank-matching transcript abundances. Twenty simulations were performed, each with different randomly chosen sets of differentially expressed genes (for further details on the simulation structure, see [9]).
The simulations were quantified with kallisto v0.43.1 using an index constructed from EnsemblHomo sapiens
GRCh38 cDNA release 79. Differential expression ana-lyses were performed with sleuth and DESeq2 and then aggregated with various methods described above. Sensi-tivities and corresponding FDRs were calculated and then averaged across the 20 simulations. The average sensitivity at each average FDR was plotted with the mamabear package ([9], https://github.com/pimentel/ mamabear).
Rat alveolar epithelial cell stretching dataset analysis
We used a 3’QuantSeq dataset (GEO Series GSE89024) of stretched and unstretched rat primary type I like alveolar epithelial cells. Five replicates for each condition were performed by the original experimenters, resulting in a total of ten single-end RNA-seq samples [21].Reads were trimmed to remove poly-A tails with fqtrim-0.9.5 using the default parameters [30]. As discussed above in the “Methods” section under “Transcript compatibility count differential analysis and aggregation,” TCCs were obtained with the kallisto pseudo option, differential expression of TCCs was performed in sleuth, and TCCpvalues were aggregated with the Lancaster method. Because kallisto quantification is invalid for this non-uniform sequencing dataset and it cannot be used to pro-vide bootstrap estimates of inferential variance required for sleuth, we used DESeq2’s default pipeline to perform gene differential analysis, summing all reads mapping uniquely to a gene to obtain gene counts.
Dexamethasone dataset analysis
We analyzed a dataset (GEO Series GSE95363) consist-ing of reads derived from RNA-seq on primary mouse neural progenitor cells extracted from two regions of the brain, from female and male embryonic mice, and with
and without dexamethasone treatment. Three replicates were performed for each of the eight combinatorial con-ditions, resulting in a total of 24 single-end RNA-seq samples [25]. As detailed above in “Transcript differen-tial analysis and aggregation,” samples were quantified with kallisto v0.43.1 (default kmer length 31, with 30 bootstraps per sample), using an index constructed from
Ensembl Mus musculus GRCm38 cDNA release 88.
Within sleuth, a linear model with three parameters (gender, brain region, and treatment) was constructed, a Wald test was performed to test for effect of treatment on transcript expression, and the resultingpvalues were aggregated. As detailed above in“Transcript compatibil-ity count differential analysis and aggregation,” TCCs were obtained with kallisto v0.43.1 using thepseudo op-tion, differential expression of TCCs was performed in sleuth, and the resulting p values aggregated. On this dataset, we also performed the sleuth’s standard gene pipeline (detailed in“Gene differential analysis”) and the Sidak aggregation method, resulting in a total of four different aggregation methods.
Each method’s significant gene list, thresholded at FDR < 0.05, was inputted into a classical GO analysis to test for GO enrichment. topGO_2.26.0 [31] was invoked to perform Fisher’s exact test, using gene ontologies drawn from GO.db_3.4.0 and mouse gene annotations drawn from org.Mm.eg.db_3.4.0 [32]. Furthermore, the gene pvalues from each aggregation method were used in a GO perturbation test. In the GO perturbation test, gene p values are weighted by the counts mapping uniquely to the gene and aggregated with the Lancaster method, using the ontology-to-gene mappings provided by topGO. The GO pvalues were Bonferroni corrected to obtain FWER.
Software versions
Additional file
Additional file 1:Supplementary material. (PDF 13757 kb)
Acknowledgments
We thank Jase Gehring, Páll Melsted, and Vasilis Ntranos for discussion and feedback during development of the methods. Conversations with Cole Trapnell regarding the challenges of functional characterization of individual isoforms were instrumental in launching the project.
Funding
LY was partially funded by the UCLA-Caltech Medical Science Training Program, NIH T32 GM07616, and the Lee Ramo Fund. Harold Pimentel was partially funded by NIH R01 HG008140.
Availability of data and materials
Scripts to reproduce the figures and results of the paper are available athttp:// github.com/pachterlab/aggregationDE/, which is under GNU General Public License v3.0. [33]. The RNA-seq datasets used in the analysis can be found at GEO GSE89024 [21]and GEO GSE95363 [25].
Authors’contributions
LY, NLB, and LP devised the methods. LY analyzed the biological data. LY and LP performed computational experiments. HP developed and implemented the simulation framework. LY and LP wrote the paper. NLB and LP supervised the research. All authors read and approved the final manuscript.
Ethics approval and consent to participate
No data from humans were used in this manuscript.
Competing interests
The authors declare that they have no competing interests.
Publisher’s Note
Springer Nature remains neutral with regard to jurisdictional claims in published maps and institutional affiliations.
Author details
1UCLA-Caltech Medical Science Training Program, Los Angeles, CA, USA. 2Division of Biology and Biological Engineering, Caltech, Pasadena, CA, USA. 3Department of Genetics, Stanford University, Palo Alto, CA, USA.4Innovative
Genomics Institute, Berkeley, CA, USA.5Department of Computing and Mathematical Sciences, Caltech, Pasadena, CA, USA.
Received: 5 October 2017 Accepted: 8 March 2018
References
1. Wang Z, Gerstein M, Snyder M. RNA-Seq: a revolutionary tool for transcriptomics. Nat Rev Genet. 2009;10(1):57–63.https://doi.org/10. 1038/nrg2484.
2. Soneson C, Love MI, Robinson MD. Differential analyses for RNA-seq: transcript-level estimates improve gene-level inferences. F1000Research. 2015;4:1521.https://doi.org/10.12688/f1000research.7563.1.
3. Kisielow M, Kleiner S, Nagasawa M, Faisal A, Nagamine Y. Isoform-specific knockdown and expression of adaptor protein ShcA using small interfering RNA. Biochem J. 2002;363(Pt 1):1–5.https://doi.org/10.1042/bj3630001. 4. Anders S, Huber W. Differential expression analysis for sequence count data.
Genome Biol. 2010;11(10):R106.https://doi.org/10.1186/gb-2010-11-10-r106. 5. Anders S, Pyl PT, Huber W. HTSeq—a Python framework to work with
high-throughput sequencing data. Bioinformatics. 2015;31(2):166–9.https://doi. org/10.1093/bioinformatics/btu638.
6. Trapnell C, Hendrickson DG, Sauvageau M, Goff L, Rinn JL, Pachter L. Differential analysis of gene regulation at transcript resolution with RNA-seq. Nat Biotechnol. 2013;31(1):46–53.https://doi.org/10.1038/nbt.2450. 7. Trapnell C, Williams BA, Pertea G, Mortazavi A, Kwan G, van Baren MJ, et al.
Transcript assembly and quantification by RNA-Seq reveals unannotated transcripts and isoform switching during cell differentiation. Nat Biotechnol. 2010;28(5):511–5.https://doi.org/10.1038/nbt.1621.
8. Robinson M, McCarthy DJ, Smyth GK. edgeR: a Bioconductor package for differential expression analysis of digital gene expression data. Bioinformatics. 2010;26(1):139–40.https://doi.org/10.1093/ bioinformatics/btp616.
9. Pimentel H, Bray NL, Puente S, Melsted P, Pachter L. Differential analysis of RNA-seq incorporating quantification uncertainty. Nat Methods. 2017;14(7): 687–90.https://doi.org/10.1038/nmeth.4324.
10. Anders S, Reyes A, Huber W. Detecting differential usage of exons from RNA-seq data. Genome Res. 2012;22(10):2008–17.https://doi.org/10. 1101/gr.133744.111.
11. Hess A, Iyer H. Fisher’s combined p-value for detecting differentially expressed genes using Affymetrix expression arrays. Genome Biol. 2007;8:96.
https://doi.org/10.1186/1471-2164-8-96.
12. Chen Z, Yang W, Liu Q, Yang JY, Li J, Yang MQ. A new statistical approach to combining p-values using gamma distribution and its application to genome-wide association study. BMC Bioinformatics. 2014;15(Suppl 17):S3.
https://doi.org/10.1186/1471-2105-15-S17-S3.
13. Dai H, Charnigo R, Srivastava T, Talebizadeh Z, Ye SQ. Integrating P-values for genetic and genomic data analysis. J Biom Biostat. 2012;3:e117.https:// doi.org/10.4172/2155-6180.1000e117.
14. Lamparter D, Marbach D, Rueedi R, Kutalik Z, Bergman S. Fast and rigorous computation of gene and pathway scores from SNP-based summary statistics. PLoS Comput Biol. 2016;https://doi.org/10.1371/ journal.pcbi.1004714.
15. Li S, Williams BL, Cui Y. A combined p-value approach to infer pathway regulations in eQTL mapping. Stat Interface. 2011;4:389–402.https://doi.org/ 10.4310/SII.2011.v4.n3.a13.
16. Lancaster HO. The combination of probabilities: an application of orthonormal functions. Austral J Statistics. 1961;3:20–33.https://doi.org/10. 1111/j.1467-842X.1961.tb00058.x.
17. Bray N, Pimentel H, Melsted H, Pachter L. Near-optimal probabilistic RNA-seq quantification. Nat Biotechnol. 2016;34:525–7.https://doi.org/10. 1038/nbt.3519.
18. Love MI, Huber W, Anders S. Moderated estimation of fold change and dispersion for RNA-seq data with DESeq2. Genome Biol. 2014;15:550.
https://doi.org/10.1186/s13059-014-0550-8.
19. Hayer KE, Pizarro A, Lahens NF, Hogenesch JB, Grant GR. Benchmark analysis of algorithms for determining and quantifying full-length mRNA splice forms from RNA-seq data. Bioinformatics. 2015;31(24):3938–45.https://doi. org/10.1093/bioinformatics/btv488.
20. Moll P, Ante M, Seitz A, Reda T. QuantSeq 3 [prime] mRNA sequencing for RNA quantification. Nat Methods. 2014;11(12):31.
21. Dolinay T, Himes BE, Shumyatcher M, Lawrence GG, Margulies SS. Integrated stress response mediates epithelial injury in mechanical ventilation. Am J Respir Cell Mol Biol. 2017;57(2):193–203.https://doi. org/10.1165/rcmb.2016-0404OC.
22. Ashburner M, Ball CA, Blake JA, Botstein D, Butler H, Cherry JM, et al. Gene ontology: tool for the unification of biology. Nat Genet. 2000;25(1):25–9.
https://doi.org/10.1038/75556.
23. Huang DW, Sherman BT, Lempicki RA. Bioinformatics enrichment tools: paths toward the comprehensive functional analysis of large gene lists. Nucleic Acids Res. 2009;37(1):1–13.https://doi.org/10.1093/nar/gkn923. 24. Mi H, Muruganujan A, Casagrande JT, Thomas PD. Large-scale gene
function analysis with the PANTHER classification system. Nat Protoc. 2013;8: 1551–66.https://doi.org/10.1038/nprot.2013.092.
25. Frahm KA, Waldman JK, Luthra S, Rudine AC, Monaghan-Nichols AP, Chandran UR. A comparison of the sexually dimorphic dexamethasone transcriptome in mouse cerebral cortical and hypothalamic embryonic neural stem cells. Mol Cell Endocrinol. 2017;https://doi.org/10.1016/j.mce. 2017.05.026.
26. Van den Berge K, Soneson C, Robinson MD, Clement L. stageR: a general stage-wise method for controlling the gene-level false discovery rate in differential expression and differential transcript usage. Genome Biol. 2017; 18(1):151.https://doi.org/10.1186/s13059-017-1277-0.
27. Fisher RA. Statistical methods for research workers. 4th ed. London: Oliver and Boyd; 1932.
28. Šidàk Z. Rectangular confidence region for the means of multivariate normal distributions. J Am Stat Assoc. 1967;62:626–33.https://doi.org/10. 1080/01621459.1967.10482935.
variation in humans. Nature. 2013;501:506–11.https://doi.org/10.1038/ nature12531.
30. Johns Hopkins Center for Computational Biology. fqtrim; 2015.https://doi. org/10.5281/zenodo.20552.https://github.com/gpertea/fqtrim/tree/v0.9.4. 31. Alexa A and Rahnenfuhrer J. topGO: Enrichment Analysis for Gene
Ontology. R package version 2280. 2016.
32. The Gene Ontology Consortium. Gene Ontology Consortium: going forward. Nucl Acids Res. 2015;43(Database issue):D1049–56.https://doi.org/ 10.1093/nar/gku1179.
33. Yi L, Pimentel H. Bray NL. Pachter L. aggregationDE. Github. 2016.https:// doi.org/10.5281/zenodo.1179317;https://github.com/pachterlab/ aggregationDE.
• We accept pre-submission inquiries
• Our selector tool helps you to find the most relevant journal
• We provide round the clock customer support
• Convenient online submission
• Thorough peer review
• Inclusion in PubMed and all major indexing services
• Maximum visibility for your research
Submit your manuscript at www.biomedcentral.com/submit