Online Anomaly Detection under Over-sampling
PCA
P. Chinababu 1*, Mrs. A.Vanathi 2
1
M. Tech, Dept. of Computer Science & Engineering, Aditya Engineering College, India.
2 Associate professor, Dept. of Computer Science & Engineering, Aditya Engineering College, Surampalem, AP, India, JNTU Kakinada, India.
Abstract- Anomaly detection is the process of identifying unusual behavior. Outlier detection is an important issue in data mining and has been studied in different research areas. In this paper we use “Leave One Out” procedure to check each individual point the “with or without” effect on the variation of principal directions. Based on this idea, an over-sampling principal component analysis (osPCA) outlier detection method is proposed for emphasizing the influence of an abnormal instance. Except for identifying the suspicious outliers, we also design an online anomaly detection to detect the new arriving anomaly. In addition, we also study the quick updating of the principal directions for the effective computation and satisfying the online detecting demand. It is widely used in data mining; the proposed framework is favored for online applications which have computation or memory limitations. Compared with the all existing algorithms, our proposed method is in terms of flexibility, accuracy and efficiency.
Keywords- over sampling, anomaly detection, fault detection, Leave One Out, Principle component analysis.
I. INTRODUCTION
Fig 1: Intuition of angle-based outlier detection
Consider a sample data set as illustrated in fig 1. For a point within the cluster, the angles between difference vectors to pairs of other points differ widely. The variance of the angles will become smaller for points at the border of cluster. However, even here the variance is still relatively high compared to the variance of angles for real outliers. Here, the angles to most pairs of points will be small since most points are clustered in some directions. In this paper, we observe that removing or adding an abnormal instance will cause a larger effect on principal directions than removing or adding a normal one. From this observation, we apply the “Leave One Out” (LOO) procedure to check each individual point the “with or without” effect on the variation of principal direction. This will help us to remove the suspicious outliers in the dataset. Thus, it can be used for the data cleaning purpose. Once we have a clean dataset, we can extract the leading principal directions from it and use these directions to characterize the normal profile for the dataset. Similarly, we can evaluate the “with or without” effect of new arriving data point. That defines a suspicious score for the new arriving data point. If the score is greater than a certain threshold, we regard this point as an outlier. Based on this strategy, we proposed an on-line anomaly detection method. Intuitively, the “with or without” effect on the principle direction will be diminished for a single data point even it is an outlier when the dataset is large. To overcome this problem, we employ the “over-sampling” scheme that will amplify the “with or without” influence made by an outlier. We also are aware of computation issues in the whole process. How to compute the principle directions efficiently when the mean and covariance matrix are changed slightly is also a key issue and the tricks for matrix computation will be includes in this work as well.
II. OVER-SAMPLING PRINCIPAL COMPONENT ANALYSIS
In this section, we first introduce the classical dimension reduction method PCA briefly. The study on the influence of the variation of principal directions via LOO procedures is also be exhibited. Finally, we introduce the over-sampling scheme in PCA to emphasize the influence of an abnormal instance. In addition, an effective computation for computing the covariance matrix and estimating principal directions in LOO procedure is also proposed. .
A. Principal Component Analysis
PCA is an unsupervised dimension reduction method. It can retain those characteristics of the data set that contribute most to its variance by keeping lower-order principal components. These few components often contain the “most important” aspects of the data. Let A Rp X n be the matrix and each column, xi R
p
, represents an instance. PCA involves the eigenvalue decomposition in the covariance matrix of the data. Its formulation is solving an eigenvalue problem as follows:
∑AГ = λГ , (1)
Where ∑A= i-µ) (xi-µ) T
is the covariance matrix, µ is the grand mean, and the resulting Г is the eigenvector set. In practical, some eigenvalues have little contribution to variance and can be discarded. It means that we only need to keep few components to represent the data. In addition, PCA explains variance and is sensitive to outliers. A few points distant from the center would have a large influence on variance and its principal directions. In other words, these first few principal directions will be influences seriously if our data contain some outliers.
B. Effects if an outlier on Principal directions
check the variation of the principal directions is significant.
Fig: 2 the illustration for the effect of an outlier on the first principal direction
In summary, we find that the principal directions will be effected with removing an outlier while the variation of the principal will be smaller with the removing a normal instance. This concept can be used for identifying the anomaly or outliers in our data. On the contrary, adding an outlier will also cause a larger influence on the principal directions while the variation of the principal directions will be smaller with adding a normal one. It means that we can use the incremental strategy to detect the new arriving abnormal data or outliers. In other words, we explore the variation of the principal directions with removing or adding a data point and use this information to identify outliers and detect new arriving deviated data.
C. Oversampling Principal Components Analysis
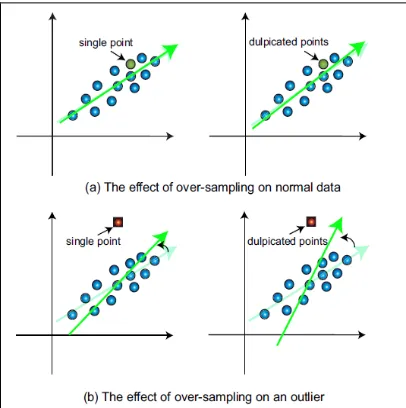
In the previous section we identify that outliers in our data and detect the new arriving outliers through the variation of the principal directions. However, the effect of “with or without” a particular data may be diminished hen the size of the data is large. On the other hand, the computation in estimating the principal directions will be heavy because we need to recompute the principal directions many times in LOO scenario. In order to overcome the first problem, we employ “over-sampling” scheme to amplify to the outlierness on each data point. For identifying an outlier via LOO strategy, we duplicate the target instance instead of removing it. That is, we duplicate the target instance many times (10% of the whole data in our experiments) and observe how much variation the principal directions vary. With this over-sampling scheme, the principal directions and mean of the data will only be affected slightly if the target instance is a normal data point shown in fig 3(a). On the contrary, the variations will be enlarged if we duplicate an outlier shown in fig: 3(b).
Fig : 3 The effect of over-sampling on an outlier and normal instances
[image:4.612.204.407.450.654.2]idea discussed in this section is more practical.
ALGORITHM 1: Over-sampling principal component analysis outlier detection for data cleaning
Input: a data matrix A Rp X n and the ratio r
Output: the suspicious outlier ranking for their data.
1. Compute outer-product Q= , the mean µ, and the first principal direction v
2. Using LOO strategy to duplicate the target instance xt and compute the adjusted mean vector and covariance matrix
:
a. ,
b. = Q+ txtT- T
3. Extract the adjusted first principal direction and compute the cosine similarity of v and . 4. Repeat the step2 and 3 until scanning all the data.
5. Ranking all instances according to their suspicious outlier scores (1- | cosine similarity|).
Where A Rp X n is the data matrix, xt is the target instance and r is the parameter of the proportion of the whole data in
duplicating xt. from the equation
= Q+ txtT- T (2)
It shows that we can keep the matrix Q in advance and need not to recompute it completely in LOO procedure. In extracting the first principal direction, we also apply the power method for fast computation. Power method [7] is an eigenvalue algorithm for computing the greatest eigenvalue and the corresponding eigenvector. Given a matrix M, this method starts with an initial normalized vector µ0, which could be an approximation to the dominant eigenvector or a nonzero random vector, then
iteratively computes the uk+1 as follows:
uk+1= (3)
The sequence {uk} converges on the assumption that there exists an largest eigenvalue of M in absolute value. From (3), we can
see that power method does not compute matrix decomposition but only uses the matrix multiplication. Based on this property, the power method can converge rapidly and make our LOO procedure faster. On the other hand, if we want to find the remaining eigenvectors, we could use definition process [7]. Note that we only use the first principal component in our experiments so we only apply the power method in estimating the first principal detection.
D. osPCA for online Anomaly Detection
In this section we present the framework of our data analysis. There are two phases in our framework, data cleaning and online anomaly detection. In the data cleaning phase, the goal is to identify the suspicious outliers. First, we over-sample each instance with LOO strategy to see the variation of the first principal direction. Here we use the absolute value of cosine similarity to measure the difference of the first principal direction and define “one minus the absolute value of cosine similarity”.
Algorithm 2: Over-sampling Principal Component Analysis for On-line Anomaly Detection
1. compute the updated mean vector and covariance matrix : a. ,
b. = Q+ txtT- T.
2. Extract the updated first principal direction and compute the cosine similarity of v and . 3. Check the cosine similarity of v and and see if it is higher the specified threshold h.
A higher suspicious outlier score implies the higher probability of being an outlier. Once we have the suspicious outlier scores for each instance, we can rank the instances and filter out the outliers in the given data according to the ranking. The over-sampling principal component analysis outlier detection algorithm (OPCAOD) for data cleaning is describing in algorithm 1. After filtering the suspicious points, we can get the pure normal data and apply the online anomaly detection which is not suitable for LOF and ABOD. Nevertheless, the quick updating of the principal directions in our proposed method can satisfy the online detecting demand. In this phase, the goal is to identify the new arriving instance to check the variation of the principal directions. However, how to determine the threshold for identifying an abnormal instance is a problem. In order to overcome this problem, we use some statistics to set the threshold. The idea is calculating the mean and standard deviation of the suspicious scores which are computed from all normal data points. Once we have the mean and standard deviation, a new arriving instance will be marked if its suspicious score is higher than the mean plus a specified multiple of the standard deviation. The over-sampling principal component analysis for on-line anomaly detection (OPCAAD) is also described in algorithm 2.
E. Online anomaly detection for practical scenario
Compared to the power method or other popular anomaly detection algorithms, the required computational costs and memory requirements are significantly reduced, and thus our method is especially preferable in online, streaming data, or large scale problems.
Fig: 4 online anomaly detection frameworks
Online anomaly detection for practical scenario for online anomaly detection applications such as spam mail filtering, one typically designs an initial classifier using the training normal data, and this classifier is updated by the newly received normal or outlier data accordingly. However, in practical scenarios, even the training normal data collected in advance can be contaminated by noise or incorrect data labeling. In order to construct a simple yet effective model for online detection, one should disregard these potentially deviated data instances from the training set of normal data. The flowchart of our online detection procedure is shown in fig (4).
III. CONCLUSION AND FUTURE WORK
satisfying the online detecting demand which is not suitable for LOF and ABOD. On the other hand, our proposed PCA based anomaly detection is suitable for the extremely unbalanced data distribution (such as network security problems). In the future, we will also study how to speed up the procedure via online learning techniques (ie., develop a quick adjusting for the principal directions directly)
IV. ACKNOWLEDGMENT
Most of all, I shall give all glory, honor and thank to my parents. They made me as I am. Then there are a few people I would like to thank, my guide Mr. D Ratna Kishore sir, who spared no effort to ensure that I have everything I needed. Finally, my friends who gave their time, love and energy.
REFERENCES
[1]. Breunig, M.M., Kriegel, H.P., Ng, R., Sander, L,: LOF: Identifying density-based local outliers. In Proc. Of the 2000 ACM SIGMOD Int. Conf. on Management of Data, Dallas, Texas (2000).
[2]. Chandola, V., Banerjee, A., Kumar, V.: Anomaly detection: a survey. ACM Computing Surveys (2009). [3]. Hawkins, D.: Identification of Outliers. Chapman and Hall, London (1980)
[4]. Huang, L., Nguyen, X., Garofalakis, M., Jordan, M.I., Joseph, A., Taft, N.: In-network pca and anomaly detection. In: Advances in Neural Information Processing Systems, vol. 19, pp. 617–624. MIT Press, Cambridge (2007)
[5]. Kriegel, H.-P., Schubert, M., Zimek, A.: Angle-based outlier detection. In: Proc. of 14th ACM SIGKDD Int. Conf. on Knowledge Discovery and Data Mining, Las Vegas, NV (2008)
[6]. Lazarevic, A., Ertoz, L., Kumar, V., Ozgur, A., Srivastava, J.: A comparative study of anomaly detection schemes in network intrusion detection. In: Proc. of the Third SIAM Conference on Data Mining (2003)
[7]. G. H. Golub, C.F. Van Loan, Matrix Computations. Johns Hopkins University Press, Baltimore Md, USA, 1983.
AUTHOR’S PROFILE
Mr.P.CHINABABU,Received his B.Tech in IT from RK college of Engineering & technology, vijayawada, which is affiliated to JNT University KAKINADA, Andhrapradesh, India and pursuing M-tech., in CSE from Aditya College of Engineering, which is affilified to JNT University KAKINADA, Andhra Pradesh ,India. He is currently M-Tech student in Aditya College of Engineering, Surampalem,AP, India. His research interests include Data mining.
Mrs.A.VANATHI ,Received her B.E in CSE from Bharadhidasan University, Trichy,T.N, India
and M.E., in CSE from Anna University Chennai, TN , India. She is currently pursuing PhD in Acharya Nagarjuna University, Guntur. She was a lecturer, Assistant Professor and currently working as an Associate professor and Head Of the Department IT ,Aditya Engineering College, Surampalem,AP, India. Her research interests include Information Security and Mobile Computing.