Technology (IJRASET)
©IJRASET 2015: All Rights are Reserved
41
Red Blood Cell Identification Using Watershed
Technique
M.MumthajBegam1,R. Geetha2 and A. Sagayaselvaraj3
1,2,3
IFET College of Engineering , Villupuram, India
Abstract--Diseases caused by any parasite can be diagnosed using the shape of RBCs and WBCs. The blood sample consists of different cells like RBCs, WBCs, and Platelets from which manual shape analysis may not be accurate. So there is a need in designing an automated system that can identify the shape of RBCs. This paper presents an approach to detect the shape of Sickle cells present in RBCs by finding the highest, lowest and mean radius of each type of cell by comparing it with standard cell size and mark the cells by a red circle for identification. The proposed approach is tested on a collected SEM blood sample images and experimental results are encouraging. The number of red blood cells contributes more to clinical diagnosis with respect to blood diseases. The aim of this research is to produce a computer vision system that can detect and estimate the number of red blood cells in the blood sample image. Watershed algorithm is a very powerful tool in image processing, and it is been used to segment and extract the red blood cells from the background and other cells. The algorithm used features such as shape of red blood cells Hough transform is introduced in this process. The result presented here is based on images with normal blood cells. The tested data consists of 10 samples and produced the accurate estimation rate closest to 96% from manual counting.
Index Terms—RBC, WBC, Platelets, SEM
I. INTRODUCTION
Technology (IJRASET)
©IJRASET 2015: All Rights are Reserved
42
A sample image of microscopic blood smear is shown in Fig 1. We have considered the gray level image as input shown in Fig 2. The highest, lowest and mean distance from centre of mass of the cell to its perimeter is calculated[11]. These parameters confirm whether the cell is circular or sickle shaped. The effectiveness of an automatic image processing method to detect normal red blood cells (RBCs) by peripheral blood smear microscope image was discussed in [10]. When single RBCs were extracted from sickle RBCs and white blood cells (WBCs) component, its images were analysed. The erythrocytes are the most numerous blood cells in the human body, and it also called red blood cells. The red blood is a blood that functioned as carry oxygen throughout our body [1]. According to American Cancer Society (2009), the normal red blood cell in our body is divided into four categories of ages, which are newborn, children, women and men. The average amount of red blood cells each category is about 4.8-7.2 million per cubic millimeter, about 3.8–5.5 million per cubic millimeter, about 4.2-5.0 million of these cells per cubic millimeter and 4.6-6.0 x 10⁶ per cubic millimeter respectively. Red blood is measured by the amount of hemoglobin in our blood. The level of hemoglobin in our blood will affect our health tremendously. We suffered fatigue and short of breath when the level of hemoglobin is too low due to not enough oxygen supply to our tissues. This so called Anemic can be relieved with a blood transfusion or with medication to increase our body's production of red blood cells [2]. The effect of having high red blood cells in our blood is it can be an indication of an undetected heart or lung problems. When any of these organs is not functioning properly, then blood oxygen levels go down. In order to normalize oxygen supply, the body increases its production of red blood cell.
The diagnosis is the process of finding out what kind of disease a certain patient has and those diagnosed must always be accurate. A wrong diagnosis may lead the situation and condition of a patient become worst and some case, patient dies due to wrong dosage of drugs given [3]. In order to overcome that weakness, some researchers have done some useful works [4-5] especially in classifying blood cells from other cells, for example, classifying white blood cells from other cells such as red blood cells and platelets [6]. Another example is classifying red blood cells from other cells such as white blood cells and platelets. Most of the researchers have concentrated the classification of white blood cells since most of the disease easy to determine by analysis the changing of white blood cells. However, by counting the red blood cells, it also provided some information about the abnormal condition in our body.
A. Objective
1) To combine three effect of Blood Cell Detection.
2) Cell Plasma Differentiation
3) Cell Size Identification
4) Red Blood Cell Detection
5) To clearly segment the images to show the cell location to distinguish it from each other.
B. Existing/Proposed System
1) Existing: Block Matching Video Compression: Recently, too much effort have been made by researchers to develop algorithms for counting of Red Blood Cells addressing the problems of splitting the clustered Red Blood Cells and show a high degree of success but still needs improvements to address the mentioned hurdles in proper way. The study made by [2], the authors mentioned that counting Red Blood Cells is not a big issue in image processing but the hurdles like clustered Red Blood Cells splitting is too important because they will affect the accuracy that’s why they did it through concavity points finding and splitting. However, they did not mention how to separate the single and clustered Red Blood Cells and identification of clusters existence while the Red Blood Cells are counted using boundaries tracing and labeling. In the study, of [3], the authors did not consider the separation and clustered Red Blood Cells splitting but did the counting. Red Blood Cells counting without solving the problem of cluster Red Blood Cells Splitting compromise on the accuracy.
Technology (IJRASET)
©IJRASET 2015: All Rights are Reserved
43
considered the Red Blood Cells as circles which are not true because Red Blood Cells morphology is not static and changed by other diseases. The approaches adopted by previous studies to combat the problem of clumped and overlapped Red Blood Cells splitting are divided into the following categories i.e. Morphological operation based includes erosion, dilation or opening closing to split the clusters of Red Blood Cells.
2) Disadvantages of Existing System a) Non Accurate
b) Complex Algorithm
c) Non efficient for real time image input
3) Proposed System: Hybrid System of Cell Detection, Cell Size Identification and RBC Tracking based on thresholding and watershed algorithm.
a) Cell plasma detection uses thresholding which detects the cells from the complex images of cells and plasma combined.
b) Size detection based on ellipse detection algorithm detects the elliptical cell structure from the blood image.
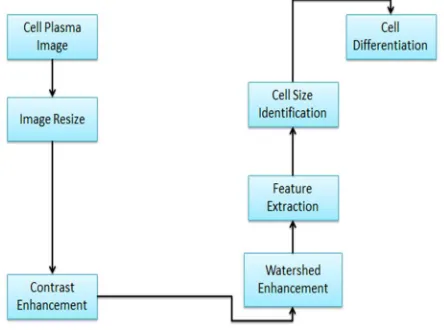
[image:4.612.211.433.309.474.2]c) The RBC detection code identifies the RBC from the image of blood cell. It can accurately track the RBC from the biological images.
Fig. 2 Block Diagram
4) Advantages of Proposed System:
a) Accurate Cell Tracking Using Thresholding
b) Cell Size Detection
c) RBC Detection
d) User friendly GUI
II. ALGORITHM DESCRIPTION
The red blood is a blood that functioned as carry oxygen throughout our body [1]. According to American Cancer Society (2009), the normal red blood cell in our body is divided into four categories of ages, which are newborn, children, women and men. The average amount of red blood cells each category is about 4.8-7.2 million per cubic millimeter, about 3.8–5.5 million per cubic millimeter, about 4.2-5.0 million of these cells per cubic millimeter and 4.6-6.0 x 10⁶ per cubic millimeter respectively. Red blood is measured by the amount of hemoglobin in our blood. The level of hemoglobin in our blood will affect our health tremendously.
Technology (IJRASET)
©IJRASET 2015: All Rights are Reserved
44
1) Watershed Algorithm: A grey-level image may be seen as a topographic relief, where the grey level of a pixel is interpreted as its altitude in the relief. A drop of water falling on a topographic relief flows along a path to finally reach a local minimum. Intuitively, the watersheds of a relief correspond to the limits of the adjacent catchment basins of the drops of water. In image processing, different types of watershed lines may be computed. In graphs, watershed lines may be defined on the nodes, on the edges, or hybrid lines on both nodes and edges. Watersheds may also be defined in the continuous domain. There are also many
different algorithms to compute watersheds. Watershed algorithm is used in image processing primarily
for segmentation purposes.
2) Watershed by flooding: The idea was introduced in 1979 by S. Beucher and C. Lantuéjoul. The basic idea consisted of placing a water source in each regional minimum in the relief, to flood the entire relief from sources, and build barriers when different water sources meet. The resulting set of barriers constitutes a watershed by flooding.
Fig-3:- Watershed Algorithm
3) Watershed by topographic distance: Intuitively, a drop of water falling on a topographic relief flows towards the "nearest" minimum. The "nearest" minimum is that minimum which lies at the end of the path of steepest descent. In terms of topography, this occurs if the point lies in the catchment basin of that minimum. The previous definition does not verify this condition.
4) Inter-pixel watershed: S. Beucher and F. Meyer introduced an algorithmic inter-pixel implementation of the watershed method,[3] given the following procedure:
a) Label each minimum with a distinct label. Initialize a set S with the labeled nodes.
b) Extract from S a node x of minimal altitude F, that is to say F(x) = min{F(y)|y∈S}. Attribute the label of x to each non-labeled node y adjacent to x, and insert y in S.
c) Repeat Step 2 until S is empty.
5) Topological watershed: Previous notions focus on catchment basins, but not to the produced separating line. The topological watershed was introduced by M. Couprie and G. Bertrand in 1997,[4] and beneficiate of the following fundamental property. A function W is a watershed of a function F if and only if W ≤ F and W preserves the contrast between the regional minima of F; where the contrast between two regional minima M1 and M2 is defined as the minimal altitude to which one must climb in order to go from M1 to M2.[5]
Different approaches may be employed to use the watershed principle for image segmentation.
Local minima of the gradient of the image may be chosen as markers, in this case an over-segmentation is produced and a second step involves region merging.
Technology (IJRASET)
©IJRASET 2015: All Rights are Reserved
45
6) Meyer's flooding algorithm: One of the most common watershed algorithms was introduced by F. Meyer in the early 90's.
The algorithm works on a gray scale image. During the successive flooding of the grey value relief, watersheds with adjacent catchment basins are constructed. This flooding process is performed on the gradient image, i.e. the basins should emerge along the edges. Normally this will lead to an over-segmentation of the image, especially for noisy image material, e.g. medical CT data. Either the image must be pre-processed or the regions must be merged on the basis of a similarity criterion afterwards.
a) A set of markers, pixels where the flooding shall start, are chosen. Each is given a different label.
b) The neighboring pixels of each marked area are inserted into a priority queue with a priority level corresponding to the gray level of the pixel.
c) The pixel with the highest priority level is extracted from the priority queue. If the neighbors of the extracted pixel that have already been labeled all have the same label, then the pixel is labeled with their label. All non-marked neighbors that are not yet in the priority queue are put into the priority queue.
d) Redo step 3 until the priority queue is empty.
The non-labeled pixels are the watershed lines.
7) Optimal spanning forest algorithms (watershed cuts)
Watersheds as optimal spanning forest have been introduced by Jean Cousty et al.[6] They establish the consistency of these watersheds: they can be equivalently defined by their “catchment basins” (through a steepest descent property) or by the “dividing lines” separating these catchment basins (through the drop of water principle). Then they prove, through an equivalence theorem, their optimality in terms of minimum spanning forests. Afterward, they introduce a linear-time algorithm to compute them. It is worthwhile to note that similar properties are not verified in other frameworks and the proposed algorithm is the most efficient existing algorithm, both in theory and practice.
An image with two markers (green), and a Minimum Spanning Forest computed on the gradient of the image.
Result of the segmentation by Minimum Spanning Forest
8) Image Thresholding Algorithm: The simplest thresholding methods replace each pixel in an image with a black pixel if the
image intensity is less than some fixed constant T (that is, ), or a white pixel if the image intensity is greater
than that constant. In the example image on the right, this results in the dark tree becoming completely black, and the white snow becoming complete white.
Technology (IJRASET)
©IJRASET 2015: All Rights are Reserved
46
Sankur (2004) categorize thresholding methods into the following six groups based on the information the algorithm manipulates(Sezgin et al., 2004):
a) Histogram shape-based methods, where, for example, the peaks, valleys and curvatures of the smoothed histogram are analyzed
b) Clustering-based methods, where the gray-level samples are clustered in two parts as background and foreground (object), or
alternately are modeled as a mixture of two Gaussians
c) Entropy-based methods result in algorithms that use the entropy of the foreground and background regions, the cross-entropy
between the original and binarized image, etc.
d) Object Attribute-based methods search a measure of similarity between the gray-level and the Binarizedimages, such as fuzzy
shape similarity, edge coincidence, etc.
e) Spatial methods [that] use higher-order probability distribution and/or correlation between pixels
f) Local methods adapt the threshold value on each pixel to the local image characteristics. In these methods, a different T is selected for each pixel in the image.
9) Multiband thresholding: Color images can also be threshold. One approach is to designate a separate threshold for each of the RGB components of the image and then combine them with an ANDoperation. This reflects the way the camera works and how the data is stored in the computer, but it does not correspond to the way that people recognize colour. Therefore, theHSL and HSV color models are more often used; note that since hue is a circular quantity it requires circular thresholding. It is also possible to use the CMYK colour model(Pham et al., 2007).
III. MODULES
Image Feature Extraction, Image Thresholding: Contrast Enhancement, Watershed Enhancement, Cell Size Identification
A. Image Input and Resizing Module
1) The input image is a cell plasma image. It will be resized to a standard size to provide input to our system of code.
2) It will standardize the image to be given as input.
B. Image Contrast Enhancement Module
Technology (IJRASET)
©IJRASET 2015: All Rights are Reserved
47
transforming the values in the intensity image.
2) It operates on small data regions (tiles), rather than the entire image. Each tile's contrast is enhanced, so that the histogram of the output region approximately matches the specified histogram.
3) It also fill all the possible holes for pixels.
C. Watershed Enhancement Module
1) Watershed computes a label matrix identifying the watershed regions of the input matrix A. A can have any dimension. The elements of L are integer values greater than or equal to 0.
2) We use it in our project to distinguish in between the cells and plasma in blood.
IV. SAMPLE CODE
function [outellipses]=mainellipsedetector(image,thresmin,thresmax)
%this code were based on the content of the research article
% "an improved computer vision method for whit blood cells detection" %erikcuevas, margarita díaz, miguelmanzanares, danielzaldivar and
%marcoperez- cisneros, computational and mathematical methods in medicine, %vol. 2013, hindawipublishing corporation
%image >>> is a rgb smear image, where the procedure it will be realized %thresmin>>> is the lower value of the threshold for the segmentation %process
%thresmax>>> is the upper value of the threshold for the segmentation %thresmin and thresmax can be obtained by any thresholding process %win_size is a value that define how thick the edge-map will be, this %number is typically 5
%outellipses>>> is a 3-dimensional matrix that stores the five points of the %best ellipses founded
%this example, can be executed using this command line >> [outellipses]=mainellipsedetector('1399_full.jpg',0,110); warning off
image1=imread(image); win_size=5;
%win_size is a value that define how thick the edge-map will be, this %number is typically 5
[ib]=imaborders(image1,win_size,thresmin,thresmax); % the edge-map is obtained vtre=-0.75; % value to reach, minimum fitness value to accept an ellipse candidate np=30; %total population
itera=50; %total number of generations bestfit=-1;
finito=0;
ellipfound=0; %total number of ellipses saved and found in the image %the method consists basically into divided the original image on sub-images %containing smaller structures, so that the search is faster.
ib1=bwlabel(ib); %the edge-map its labeled to do the search fo every structure in the image [s1,s2]=size(ib1);
Technology (IJRASET)
©IJRASET 2015: All Rights are Reserved
48
imshow(image1); for ii=1:total
emptyib=zeros(s1,s2); [a(:,2),a(:,1)]=find(ib1==ii); [taux,~]=size(a);
forjj=1:taux
emptyib(a(jj,2),a(jj,1))=1; %each label in the edge-map must be store in a single image end
clear a
[vecbordxy(:,1),vecbordxy(:,2)]=find(emptyib);
[searchspace,~]=size(vecbordxy); %the search space is defined by the points on the edge map for every structure ifsearchspace>=s1*s2*0.0001;
%devec3 corresponds to the code of differential evolution algorithm (storn& %price 1995) in this case we use the one provided by the authors on
%his web-site
%you can exchange your own optimizacion algorithm in this place %in this case we use a version of differential evolution algorithm %by storn % price (1996), with the 8 strategy described in the code %of the respective algorithm
[points,bestfit,~]=devec3('funcde',vtre,5,[1 1 1 1 1],[searchspacesearchspacesearchspacesearchspacesearchspace],emptyib,np,itera,0.8,0.8,8,1);
%the five points founded to be the best so far for differential evolution, %must be identified in de edge map
points=round(points);
p1bw=vecbordxy(points(1),:); p2bw=vecbordxy(points(2),:); p3bw=vecbordxy(points(3),:); p4bw=vecbordxy(points(4),:); p5bw=vecbordxy(points(5),:);
%this points must be switched, in the case of images the x and y axis are %opposite
p1=[p1bw(1,2),p1bw(1,1)]; p2=[p2bw(1,2),p2bw(1,1)];
V. SCREENSHOTS
Technology (IJRASET)
©IJRASET 2015: All Rights are Reserved
49
Cell Plasma Separation
Technology (IJRASET)
©IJRASET 2015: All Rights are Reserved
50
Cell Type Detection
VI. CONCLUSION
Thus we concluded the hybrid system in which the cell identification in the image is tracked. We also checked our system for size extraction of cell images. We finally concluded our result with accurate identification of Red Blood Cell from the combined cell image using ellipse detection technique.
VII. ACKNOWLEDGMENTS
I thank our HOD Mrs. R. Geetha,M.tech., (Department of Electronics and Communication Engineering) to help us for creating this paper with his sincere guidance and Technical Expertise in the field of communication. The help of my project guide Mr.A. Sagayaselvaraj ,M.E, (Ph.D).,Department of ECE, IFET College of Engineering is really immense and once again I thank him for her great motivation. I thank IFET College of Engineering to provide me such a standard educational environment so that I am able to understand the minute concepts in the field of Engineering.
REFERENCES
[1] N. National Institute of Health. (1997, 27-4-2014). Red Blood Cells Count. Available: http://www.nlm.nih.gov/medlineplus/ency/article/003644.htm Last accessed on March, 2014
[2] H. Berge, D. Taylor, S. Krishnan, and T. S. Douglas, "Improved red blood cell counting in thin blood smears," IEEE International Symposium on Biomedical Imaging: From Nano to Macro, pp. 204-207, 2011.
[3] M. Buttarello and M. Plebani, "Automated blood cell counts state of the art," American Journal of Clinical Pathology, vol. 130, pp. 104-116, 2008.
[4] M. G. OWAIS SHAIKH, NEHARIKA BHAT,ROSHAN SHETTY "AUTOMATED RED BLOOD CELLS COUNT," B.E. Synopsis Report, Department of Computer Engineering, Rizvi College of Engineering, University of Mumbai, Bandra(w), Mumbai - 400050, 2013-2014.
Technology (IJRASET)
©IJRASET 2015: All Rights are Reserved
51
[7]grietinfo.in.Available:grietinfo.in/projects/MAIN/BME2013/cd-8-project%20report_1_.pdf
[8] N. H. Mahmood and M. A. Mansor, "Red blood cells estimation using Hough transform technique," Signal & Image Processing: An International Journal (SIPIJ), vol. 3, pp. 53-64, 2012.
[9] N. Ramesh, M. E. Salama, and T. Tasdizen, "Segmentation of haematopoeitic cells in bone marrow using circle detection and splitting techniques," 9th IEEE International Symposium on Biomedical Imaging (ISBI), pp. 206-209, 2012.
[10] F. Buggenthin, C. Marr, M. Schwarzfischer, P. S. Hoppe, O. Hilsenbeck, T. Schroeder, and F. J. Theis, "An automatic method for robust and fast cell detection in bright field images from high-throughput microscopy," BMC bioinformatics, vol. 14, p. 297, 2013.
[11] K. Prasad, J. Winter, U. M. Bhat, R. V. Acharya, and G. K. Prabhu, "Image analysis approach for development of a decision support system for detection of malaria parasites in thin blood smear images," Journal of digital imaging, vol. 25, pp. 542-549, 2012.
[12] P. A. C. Amit Kumar, Prof. P. U. Tembhare, Prof. C. R. Pote, "Enhanced Identification of Malarial Infected Objects using Otsu Algorithm from Thin Smear Digital Images," International Journal of Latest Research in Science and Technology, vol.1, pp. Page No159-163 August(2012) 2012.
[13] A. LaTorre, L. Alonso-Nanclares, S. Muelas, J. Peña, and J. DeFelipe, "Segmentation of neuronal nuclei based on clump splitting and a two-step binarization of images," Journal of Expert Systems with Applications, vol. 40, pp. 6521-6530, 2013.