University of Huddersfield Repository
Suckling, Paul, Calder, Nicola, Humphreys, Paul, Fraser, King and Leung, Helen
The development and use of T2GGM: a gas modelling code for the postclosure safety assessment of
opg's proposed l&ilw deep geologic repository, Canada
Original Citation
Suckling, Paul, Calder, Nicola, Humphreys, Paul, Fraser, King and Leung, Helen (2009) The
development and use of T2GGM: a gas modelling code for the postclosure safety assessment of
opg's proposed l&ilw deep geologic repository, Canada. In: 2009 Proceedings of the ASME 12th
International Conference on Environmental Remediation and Radioactive Waste ManagementCD
ROM. ASME, New York, USA, pp. 110. ISBN 978079183865X
This version is available at http://eprints.hud.ac.uk/id/eprint/8928/
The University Repository is a digital collection of the research output of the
University, available on Open Access. Copyright and Moral Rights for the items
on this site are retained by the individual author and/or other copyright owners.
Users may access full items free of charge; copies of full text items generally
can be reproduced, displayed or performed and given to third parties in any
format or medium for personal research or study, educational or notforprofit
purposes without prior permission or charge, provided:
•
The authors, title and full bibliographic details is credited in any copy;
•
A hyperlink and/or URL is included for the original metadata page; and
•
The content is not changed in any way.
For more information, including our policy and submission procedure, please
contact the Repository Team at: [email protected].
Proceedings of the 12th International Conference on Environmental Remediation and Radioactive Waste Management ICEM ‘09/DECOM ‘09 October 11-15, 2009, Liverpool, UK
ICEM2009-16291
THE DEVELOPMENT AND USE OF T2GGM: A GAS MODELLING CODE FOR THE
POSTCLOSURE SAFETY ASSESSMENT OF OPG’S PROPOSED L&ILW DEEP
GEOLOGIC REPOSITORY, CANADA
Paul Suckling
Quintessa Ltd. Henley-on-Thames, Oxfordshire, United Kingdom
Nicola Calder
Intera Engineering Ltd. Ottawa, Ontario, Canada
Paul Humphreys
University of Huddersfield Queensgate, Huddersfield,
United Kingdom
ABSTRACT
As part of the postclosure safety assessment of Ontario Power Generation’s (OPG’s) proposed Deep Geologic Repository (DGR) for Low and Intermediate Level Waste (L&ILW) at the Bruce site, Ontario, a Gas Generation Model (GGM) has been developed and used to model the detailed generation of gas within the DGR due to corrosion and microbial degradation of the organics and metals present.
The GGM is based on a kinetic description of the various microbial and corrosion processes that lead to the generation and consumption of various gases. It takes into account the mass-balance equations for each of the species included in the model, including three forms of organic waste (cellulose, ion-exchange resins, and plastics and rubbers), four metallic waste forms and container materials (carbon and galvanised steel, passivated carbon steel, stainless steel and nickel-based alloys, and zirconium alloys), six gases (CO2, N2, O2, H2, H2S, and
CH4), five terminal electron acceptors (O2, NO3
-, Fe(III)-, SO4
2-, and CO2), five forms of biomass (aerobes, denitrifiers, iron
reducers, sulphate reducers, and methanogens), four types of corrosion product (FeOOH, FeCO3, Fe3O4, and FeS), and water.
The code includes the possibility of the limitation of both microbial and corrosion reactions by the availability of water.
The GGM has been coupled with TOUGH2 to produce T2GGM; a code that models the generation of gas in the
repository and its subsequent transport through the geosphere. T2GGM estimates the peak repository pressure, long time repository saturation and the total flux of gases from the geosphere.
The present paper describes the development of T2GGM and the numerical modelling work undertaken to calculate the generation and build-up of gas in the repository, the two-phase exchange of gas and groundwater between the repository and the surrounding rock, and between the rock and the surface environment. The results have been used to inform the safety assessment modelling.
Keywords: Gas Modelling, LLW, ILW, Repository, Postclosure Safety Assessment, TOUGH2
BACKGROUND
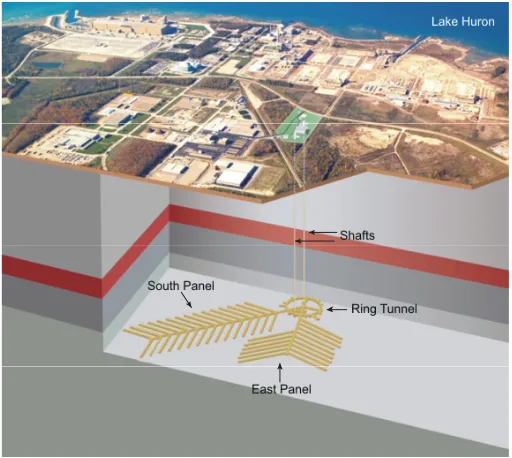
Ontario Power Generation (OPG) is proposing to build a Deep Geologic Repository (DGR) for Low and Intermediate Level Waste (L&ILW) near the existing Western Waste Management Facility (WWMF) at the Bruce site in the Municipality of Kincardine, Ontario (Figure 1). The Nuclear Waste Management Organization, on behalf of OPG, is currently preparing an Environmental Impact Statement (EIS) and Preliminary Safety Report (PSR) for the proposed repository.
Fraser King
Integrity Corrosion Consulting Ltd. Nanaimo, British Columbia,
Canada
Helen Leung
Nuclear Waste Management Organization, Toronto, Ontario,
Figure 1: The DGR Concept at the Bruce Site
A postclosure safety assessment (SA) is being undertaken to evaluate the long-term safety of the proposed facility and to support the preparation of the final EIS and PSR. The SA includes the analysis of the generation of gases in the DGR and their subsequent migration to the surface. This is being carried out using T2GGM – a coupled gas generation and two-phase flow transport code that allows for detailed representation of repository and geosphere.
Gas generation within the repository is one of the key factors in the postclosure safety of the proposed facility. Gas will be generated and consumed within the repository by various microbial and corrosion processes. The repository will interact with the geosphere through the fluxes of gas and water into and out of the repository. Following closure, the build-up of gas within the sealed repository could affect the resaturation time and lead to the release of gaseous radionuclides.
The gas modelling work presented here is described in full in technical report [1]. It forms part of a suite of related SA studies summarised in the Postclosure SA report [2].
DEVELOPMENT OF TOUGH2 AND GGM MODELS
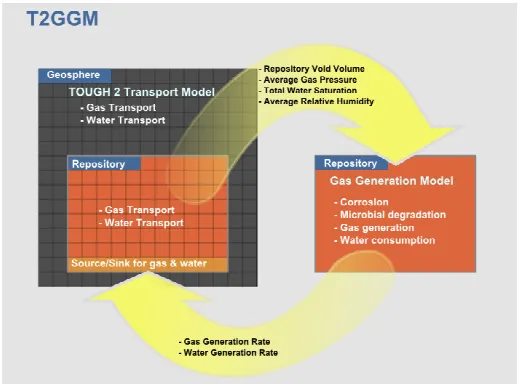
T2GGM couples a two-phase gas and water transport model implemented using TOUGH2/EOS3 [3] to a custom Gas Generation Model (GGM) (described in Annex A). Development of the GGM and TOUGH2 models has been undertaken in an iterative fashion starting from a simple uncoupled model with verification, testing and confidence building at each stage.
Initially a simple model for gas generation within the repository (GGM V0) was implemented as a spreadsheet calculation, which output gas and water generation rates that were fed into a TOUGH2 gas and water transport calculation.
The spreadsheet calculation was then re-implemented as a FORTRAN module to enable direct interfacing with TOUGH2, which is also FORTRAN based. This allowed generation and consumption of water and gas in the repository to be coupled via gas pressure, water saturation and relative humidity to the geosphere gas and water transport model. It also allowed the GGM to be developed to include additional processes, making it significantly more comprehensive. The coupled GGM and TOUGH2 codes are called T2GGM.
A standalone version of the GGM was found to be useful for testing the integrated version of the GGM (ensuring mass balance of key quantities) and investigating sensitivity of the overall model to processes and parameters. The standalone model takes only several minutes to run since the coupling with TOUGH2 is replaced by a simple geosphere response model. Using this approach it was found that several processes have only a minor impact on the overall evolution and key parameters of interest such as peak gas pressure and gas and water fluxes. These processes include: the initial stages, during which a range of terminal electron acceptors in oxidation-reduction reactions are rapidly consumed (O2, NO3-, Fe(III),
and SO42-); and the growth and death of biomass and its
recycling as organic matter capable of further degradation. This was checked using fully coupled simulations. The results presented in this paper are for the simplified GGM without these processes activated.
From a technical point of view, the challenge has been to be able to develop a coupled model of waste degradation within the repository and of gas and water generation and transport that is sufficiently detailed to capture all the key processes, that allows conceptual model and parameters uncertainties to be quantified and minimised to as great an extent as possible, while remaining computationally tractable.
A computationally efficient model was achieved through the use of a dimensionally simplified two-dimensional TOUGH2 radial model incorporating aggregate properties of the shaft, and by using the GGM to model gas generation within the whole repository. The GGM models the time dependent evolution of the repository only, which permits the use of a detailed model incorporating the key processes for each waste stream. Spatial heterogeneity in the repository is accounted for by consideration of an expected range of corrosion and microbial degradation reaction rates for each of the waste streams and using this to inform the range of calculation cases.
supplied by TOUGH2 and knowledge of the waste inventories, the GGM calculates the rate of generation (or consumption) of water and gas within the repository based on a model for corrosion and microbial degradation of the wastes. These rates are interpreted as sources for water and gas within TOUGH2’s 2-phase flow model of the repository. TOUGH2 simulates the transport of gas and water through the repository and geosphere. TOUGH2 and the GGM are able to calculate the amount of bulk gas or the amounts of the individual gas components leaving the repository respectively.
Figure 2: Coupling of Gas Transport and Generation Models
OVERVIEW OF THE GAS GENERATION MODEL
The GGM tracks the production and consumption of the key chemical species (e.g., metals, organic wastes, gases, water) in the repository, and the fluxes of the water and gases into and out of the repository. It is designed to fully conserve Fe, C and water, and to ensure that reactions are limited by the availability of water. Some elements are conservatively assumed not to be limiting and are not tracked to complete mass balance (e.g., N needed to support microbial reactions).
The organic and metallic wastes are classified into a number of waste streams. This allows the degradation/corrosion of each waste stream to be modelled independently and assigned different reaction rates. Organic wastes are classified into three groups: cellulosic wastes, ion-exchange resins, and plastics and rubbers. Metallic wastes are classified into four groups: carbon and galvanised steels, passivated carbon steels, stainless steels and nickel alloys, and zirconium alloys.
The GGM includes four key mechanisms for the generation of gas and consumption of water:
1. The microbial degradation of organic wastes;
2. Methanogenesis via the microbial hydrogen mechanism;
3. The corrosion of metallic wastes; and
4. The CO2 enhanced corrosion of metallic wastes and
formation of siderite (FeCO3).
These processes may occur in either the saturated (water submerged) or vapour phases. Gases are modelled as partitioning between the saturated and vapour phases according to Henry’s Law. The relative humidity of the vapour phase is calculated by TOUGH2 and provided as an input to the model (Figure 2). Microbial activity is expected to have completely ceased below a relative humidity threshold of 0.6. Since the relative humidity has remained sufficiently high (at 100% for most simulations), it has not been necessary to model the cessation of microbial activity. Annex A describes the representation of these processes in the GGM in more detail.
OVERVIEW OF THE GAS TRANSPORT MODEL
The model domain for the detailed two-phase flow and transport modelling implemented in TOUGH2 encompasses the repository and a several kilometre radius around the repository. This allows the modelling to focus on the impact of the repository on gas flow and transport and to effectively represent the relatively small-scale features of the repository design such as shafts and shaft seals.
One effect of this limited domain is to require that regional flow processes be incorporated as boundary conditions. Regional flow modelling is being undertaken to support the Phase I site Geosynthesis [4]. Results of this modelling, and indications from site characterisation, show that regional gradients and flow within the deep and intermediate bedrock groundwater zones are extremely low, and that transport within these zones is likely to be diffusion dominated. Consequently, the domain selected is appropriate for modelling transport in the vicinity of the repository with most vertical boundary conditions specified as zero-flow.
The approach to modelling two-phase flow and transport consists of a two dimensional radial and vertical axisymmetric grid (2DR) used to represent the repository and geosphere. The main and vent shafts have been combined to form a single shaft with properties representing the aggregate of both shafts. The conceptualisation is based on the 2DR detailed groundwater flow representation, presented in Avis et al. [5], with modifications to alleviate numeric problems with the two-phase flow model. The conceptualisation of the repository and shaft is shown in Figure 3. Mass flows are calculated using an area equivalent to a 90o angle as shown.
domain and relatively shallow dip of formations at the Bruce site. See Table 1 and Figure 4.
Table 1: Geological Units and Model IDs
Age Stratigraphic Unit
Hydro-strati-graphic unit Model ID
Quaternary Various Surficial Not used
Devonian Various Shallow Not used
Upper Silurian Salina F SFR
Upper Silurian Salina E
Upper Silurian Salina D SDER
Upper Silurian Salina C
Upper Silurian Salina B
Upper Silurian Salina B Anhydrite
SBBCR
Upper Silurian Salina A2
Carbonate SA22R
Upper Silurian Salina A2 Evaporite SA21R
Upper Silurian Salina A1 Carbonate Upper Silurian Salina A1 Evaporite
SA1R
Upper Silurian Salina A0
Middle Silurian Guelph SDB2R
Middle Silurian Goat Island
Middle Silurian Gasport
Middle Silurian Lions Head
Middle Silurian Fossil Hill
SDB1R
Lower Silurian Cabot Head CaboR
Lower Silurian Manitoulin
Intermediate
ManiR
Upper Ordovician Queenston QueeR
Upper Ordovician Georgian Bay
Upper Ordovician Blue Mountain OSAR
Middle
Ordovician Collingwood
Middle
Ordovician Cobourg
CobR
Middle
Ordovician Sherman Fall SherR
Middle
Ordovician Kirkfield Middle
Ordovician Coboconk
Middle
Ordovician Gull River
OLAR
Middle
Ordovician Shadow Lake ShadR
Cambrian Cambrian
Deep
Not used
Figure 3: Conceptual illustration of the repository and shaft of the 2DR model.
Figure 4: Geologic layering in the gas transport model
CALCULATION CASES
Calculation cases were derived for a Normal Evolution Scenario and for a Disruptive Scenario. The Normal Evolution Scenario describes the expected long-term evolution of the repository and site following closure. The Disruptive Scenario considered is based on severe shaft seal failure, and considers the unlikely, “what of” case that the performance of the sealed shaft is very poor. The associated models are expected to capture most relevant aspects of overall system performance for both the Normal Evolution Scenario and possible Disruptive Scenarios.
Normal Evolution Scenario Cases
Detailed models were simulated for a base case (BC) set of parameters and initial conditions that approximate the Normal Evolution Scenario with the exception that glaciation cycle related impacts were not assessed. A number of calculation cases addressing sensitivity to Normal Evolution Scenario assumptions were also simulated, such as alternative geosphere boundary and initial conditions, engineered barrier system performance, and geosphere parameters.
Table 2 describes the cases considered for the Normal Evolution Scenario. The modifier, -UG- on the case name, is used to indicate cases that are based on an “updated geosphere”. Preliminary site characterisation information from more recent boreholes indicate that permeability in the deeper sediments may be significantly lower than inferred from the original boreholes. A full synthesis of the latest site information is not yet available, so the UG cases include lower permeabilities as an approximate indicator of the implications of the new site information.
The BC is characterized as follows, with the geologic layering described in Table 1 and Figure 4:
• constant present-day climate conditions, no change in
boundary condition during the simulation period;
• 1 000 000 year simulation period;
• rock permeability of approx. 2x10-18 m2 and porosity
of approx. 0.02 in the Ordovician at the repository horizon, and air-entry pressures of 50 MPa for the Inner EDZ;
• rockfall extends 20 m above repository and 30 m
above central access and ring tunnels;
• EDZ zone with increased permeability (K) and
porosity surrounding shaft and repository elements1;
• removal of shaft inner EDZ where concrete bulkheads
are to be installed;
• higher permeability of concrete bulkheads in shallow
aquifer zone due to presumed partial degradation;
1 The shaft EDZ is described as two zones (Inner and Outer) while a
single EDZ zone is defined for the repository and tunnels. All EDZ zones are isotropic and are parameterized with hydraulic conductivity calculated as a multiple on the associated rock mass vertical hydraulic conductivity
Table 2: Gas modelling cases for the Normal Evolution Scenario
Case ID Case Description
NE-BC-T Base case (BC) parameters, as described in the text.
NE-GG1-T NE-BC except increased gas generation achieved by increasing the inventory of metals in the repository by approximately 27%, and by increasing most corrosion and degradation rates by an order of magnitude. NE-GG2-T NE-BC except reduced degradation rates (an
order of magnitude less) and a lower hydrogen consumption rate (100x less). NE-EDZ-T NE-BC except permeability for shaft inner
EDZ assumed to be four orders of magnitude greater than the rock mass, and permeability for shaft outer EDZ assumed to be two orders of magnitude greater than the rock mass. Interruption of shaft inner EDZ by concrete bulkheads and asphalt waterstops is assumed to be ineffective. Reduced 1/α
values for the shaft EDZ calculated using the Davies relationship [6], which models the air-entry pressures as inversely correlated with permeability.
NE-UG-BC-T NE-BC with updated geosphere model. NE-UG-EDZ-T NE-UG-BC with the same adjustments to the
EDZ as NE-EDZ.
NE-UG-RD1-T NE-UG-BC except access tunnels and ring tunnels are filled with low permeability concrete.
NE-UG-GT-T NE-UG-BC except initial gas saturations in Ordovician sediments of 10%
• 140 m hydraulic head fixed boundary at the bottom of
the modelled system (the top of the Cambrian geological unit);
• 0 m fixed head boundary at the top of the upper
bedrock unit (top of Salina F geologic unit for the detailed gas model);
• no flow boundaries on all vertical model boundaries; • no horizontal gradient in the more permeable Silurian
units (due to the limitations of a 2D radial model);
• constant density water; • single bulk gas of air;
• initial gas saturation 98.3% in the repository (based
on initial water content of waste), 50% in shaft, and 0% in rock mass;
• initial inventory of metal mass is 5.8 x 10⁷ kg and of
organic mass is 2.2 x 10⁷ kg;
• initial repository void volume of 3.3 x 10⁵ m3 (based
on emplacement rooms, access tunnels and ring tunnels); and
Disruptive Scenario Cases
Three calculation cases (Table 3) were defined to simulate a “what if” Disruptive Scenario that simulate improper repository closure or other unexpected events that lead to very poor shaft seal performance (the Severe Shaft Seal Failure Scenario). In the SF-ES1 case, all shaft and seal materials are assigned an extremely high hydraulic conductivity of 10-7 m/s, and the shaft inner EDZ permeability is assumed to be four orders of magnitude greater than for rock mass. Concrete bulkheads, as well as the asphalt waterstops, are not keyed into the inner EDZ, resulting in a continuous flow path up the shaft inner EDZ. As well, air-entry pressures of the EDZ are reduced consistent with the increased permeabilities. The SF-UG-ES1 case simulates the same sealing failure within the updated geosphere system. The SF-US case assumes that the seal failure zone is restricted to the upper rock formations. Failure of the seals is assumed to occur at time zero for all three cases.
Table 3: Gas modelling cases for the Severe Shaft Seal Failure Scenario
Case ID Case Description
SF-ES1-T As NE-BC but with hydraulic properties of all seals and shaft inner EDZ set to extreme values, and seals not keyed into shaft EDZ. SF-UG-ES1-T SF-ES1 with updated geosphere model. SF-US-T As SF-ES1 but with failure only for the seal
system above the Queenston shale.
RESULTS
Normal Evolution Scenario
The following general gas and water processes describe the main results for the Normal Evolution Scenario after closure and sealing of the shafts.
1. Oxygen within the repository is consumed and conditions become anaerobic within several years. 2. Shaft becomes fully saturated with water, and initial
gas in the shaft dissolves into the surrounding water. 3. Moisture initially present in the wastes, plus water that
seeps into the repository from the surrounding rock and the shaft, support the anaerobic corrosion of metals and the degradation of organic wastes, resulting in generation of H2, CO2 and CH4 gases. The gas
pressure in the repository rises.
4. There is a pressure balance between the water seepage into the repository and the gas generation within the repository. For the base-case geosphere, the water inflow rate is enough to cause partial repository resaturation on a time scale of 1000 years. Figure 5 and Figure 6 show the average repository water saturation for the NE-BC and NE-UG-BC geosphere cases as a function of time. As gas generation continues and increases the pressures within the repository, water is pushed out of the repository,
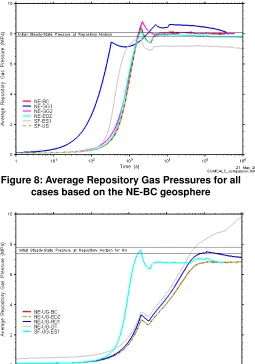
primarily into the rock mass below it. Figure 8 and Figure 9 show the average repository gas pressures for the NE-BC and NE-UG-BC geosphere cases. The repository becomes mostly unsaturated. Once repository gas pressures decrease such that they are less than the pressure in the geosphere, water begins to slowly saturate the repository once again. For the updated geosphere (UG), the very low permeability of the rock delays significant water saturation of the repository until after 200 000 years.
5. For most cases considered, with either base-case or updated-geosphere, the peak repository gas pressure is in the range 7 to 10 MPa, which is comparable to the environmental head at the repository horizon of around 7.5 MPa, and much less than the lithostatic pressure of 17 MPa. See Figure 8. For the updated geosphere (UG), the gas pressures increase much more slowly than for the base-case geosphere. See Figure 9. 6. As pressures in the repository develop, small amounts
of gas are pushed out into the shaft and the rock mass. The high capillary pressures in the rock mass and bentonite seals ensure leakage of gas out of the repository is slow. Gas saturations in the rock remain very small within a few metres from the repository, with no gas present in the rock beyond a few metres. In the NE-EDZ case, which defines a permeable pathway through the shaft EDZ, some gas permeates up through the EDZ. Some dissolved gas also reaches the top of the Intermediate Groundwater Zone, in small amounts and at long times. See Figure 7. Note the different radial and elevation scales at 0 years.
7. Methane is generally the dominant gas throughout the evolution of the repository, due to its production from anaerobic degradation of organics, and the consumption of hydrogen and carbon dioxide via the microbial methanogenic reaction. See Figure 10. The balance of the initial inventories of metallic and organic wastes results in the repository atmosphere containing small levels of either hydrogen or carbon dioxide.
8. The repository remains largely unsaturated over the 1 million years evaluated in the Normal Evolution Scenario. Slow gas dissolution and permeation allow eventual resaturation on very long time scales.
Figure 5: Average Repository Water Saturation for all cases based on the NE-BC geosphere
[image:8.612.39.284.71.244.2]Figure 6: Average Repository Water Saturation for all cases based on the NE-UG-BC geosphere
[image:8.612.325.583.73.247.2]Figure 7: Dissolved gas concentrations at 0, 2000, 100 000 and 600 000 years for the NE-BC.
[image:8.612.327.582.76.440.2]Figure 8: Average Repository Gas Pressures for all cases based on the NE-BC geosphere
[image:8.612.37.291.76.475.2]Figure 9: Average Repository Gas Pressures for all cases based on the NE-UG-BC geosphere
[image:8.612.323.586.508.677.2]Severe Shaft Seal Failure Scenario
Similar processes occur in the Severe Shaft Seal Failure Scenario. The main difference is that (as with the NE-EDZ case), gas reaches the top of the Intermediate Groundwater Zone. The SF-US case, with shaft failure only in the upper 400 m of Devonian and Silurian rocks, illustrates the effectiveness of the Ordovician sequence at limiting the transport of gas.
CONCLUSIONS
A Gas Generation Model has been successfully developed, integrated with a TOUGH2 gas transport model and used in the V1 Postclosure Safety Assessment of OPG’s proposed DGR. Results from the detailed modelling have provided input to the assessment-level modelling [2]. They have been used to verify mathematically less complex assessment-level models of gas flow and transport and to inform:
• the water level in the repository with time;
• the relative proportions of CO2 and CH4 and hence
partitioning of gaseous C-14 between CO2 and CH4;
• the partitioning of radioactive gases between gas and
groundwater in the repository;
• the release rates of radioactive gas entrained in bulk
gas to the shaft and geosphere; and
• the bulk gas travel time from the repository to the
ground surface via the shafts and geosphere.
Several lessons have been learnt through the development of T2GGM. Firstly, the iterative process through which T2GGM was developed has been important for allowing an effective coupled model for gas and water generation and transport to be developed applicable to the DGR. Secondly, reviewing and testing the sensitivity of the GGM to parameters and processes have also helped guide its development. As a result, certain processes, such as the consumption of the terminal electron acceptors during the initial stages and the recycling of biomass as organic matter capable of further degradation were found to have minimal impact on the overall evolution and key parameters and so have been excluded in the model used for the calculations reported in this paper.
Development of T2GGM is ongoing. The sensitivity results have highlighted opportunities for reducing uncertainties further through future model development and through the use of additional site characterisation data. There is scope for improving the modelling of: variability in the reaction rates and gas generation behaviour at zero and complete water saturation. The introduction of variability in reaction rates is likely to smooth transitions and mitigate extremes of flux and pressure, while introducing more realism into the behaviour of the model in the limit of zero saturation is likely to reduce gas generation rates. The current model and results are expected to be conservative in both these respects. Other issues identified, which are not expected to have a large impact on results, but
would improve the transparency of model results are the use of methane or a combination of gases as the bulk gas instead of air; and differentiating between uncontaminated and contaminated gases. Site characterisation data will reduce the uncertainty associated with geosphere permeability, initial gas pressure and initial gas saturations parameters, in particular for the Silurian units.
ACKNOWLEDGMENTS
The work described in this paper was undertaken as part of the postclosure safety assessment of Ontario Power Generation’s proposed Deep Geologic Repository for Low and Intermediate Level Waste at the Bruce site, Ontario. The authors acknowledge the technical contribution of their colleagues Paul Gierszewski and Kelly Sedor at NWMO, John Avis and Robert Walsh at Intera and Richard Little at Quintessa.
REFERENCES
[1] Calder, N., Avis, J., Humphreys, P., King, F., Suckling, P., and Walsh, R., 2009, “Postclosure Safety Assessment (V1): Gas Modelling”, NWMO DGR-TR-2009-07, Nuclear Waste Management Organisation (NWMO), Toronto, Canada.
[2] Quintessa, Intera, and SENES, 2009, “Postclosure Safety Assessment (V1) Report”, NWMO DGR-TR-2009-01, Nuclear Waste Management Organization (NWMO), Toronto, Canada.
[3] Pruess, K., Oldenburg, C., and Moridis, G., 1999, “TOUGH2 User’s Guide, Version 2.0”, LBNL-43134, Earth Sciences Division, Lawrence Berkeley National Laboratory, Berkeley, California.
[4] Sykes, J. F., Sykes, E. A., Normani, S. D., Yin, Y., and Park, Y.-J., 2008, “Phase I Hydrogeologic Modelling.”, OPG Report 00216-REP-01300-00009-R00, University of Waterloo, Toronto, Canada.
[5] Avis, J., Calder, N., and Walsh, R., 2009, “Postclosure Safety Assessment (V1b): Groundwater Modelling.”, NWMO DGR-TR-2009-06, Nuclear Waste Management Organization (NWMO), Toronto, Canada.
[6] Davies, P. B., 1991, “Evaluation of the role of threshold pressure in controlling flow of waste-generated gas into bedded salt at the Waste Isolation Pilot Plant (WIPP).”, Sandia Report SAND 90-3246, Sandia National Laboratories, Albuquerque, USA.
ANNEX A
GAS GENERATION MODEL
A simplified version of the complete Gas Generation Model (GGM) is presented here. The full GGM additionally includes oxidation-reduction reactions for the consumption of O2, NO3-, Fe(III), and SO42- terminal electron acceptors and a
model for biomass growth, death and recycling as an additional source of organic waste, as well as complete supporting references.
The GGM includes four key mechanisms for the generation of gas and consumption of water:
1. The microbial degradation of organic wastes;
2. Methanogenesis via the microbial hydrogen mechanism;
3. The corrosion of metallic wastes; and
4. The CO2 enhanced corrosion of metallic wastes and
formation of siderite (FeCO3).
These processes may occur in either the saturated (water submerged) or vapour phases. Gases are modelled as partitioning between the saturated and vapour phases according to Henry’s Law. Microbial activity is expected to have ceased below a relative humidity threshold of 0.6. Since the relative humidity has remained sufficiently high (at 100% for most simulations), it has not been necessary to model the cessation of microbial activity.
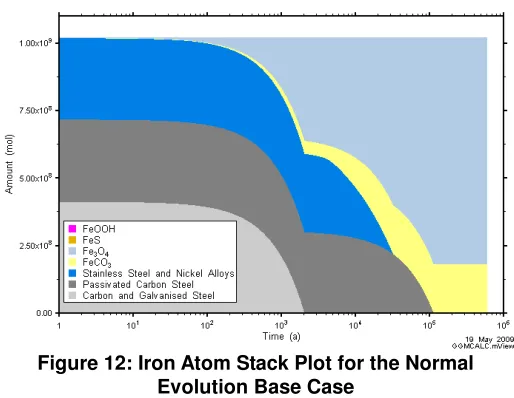
[image:10.612.320.577.128.327.2]Figure 11 and Figure 12 show how the GGM models the exchange of carbon and iron atoms between the various waste streams, corrosion products and gases for the Normal Evolution Base Case.
Figure 11: Carbon Atom Stack Plot for the Normal Evolution Base Case
Figure 12: Iron Atom Stack Plot for the Normal Evolution Base Case
MICROBIAL DEGRADATION OF ORGANIC WASTES
Cellulosic wastes are modelled as cellulose which degrade in the presence of water according to the following reaction:
C6H10O5 + H2O → 3CO2 + 3CH4 (1)
The limiting reaction rate is that for cellulose hydrolysis.
Ion-exchange resins are modelled as styrene that has degraded from polystyrene, which degrade according to the following reaction:
C8H8 + 6H2O → 3CO2 +5CH4 (2)
The limiting reaction rate is that for styrene hydrolysis. The functional groups on the resins are an appreciable fraction of the resin mass, but do not contain carbon, and so do not contribute to the gas generation.
Plastics and rubbers represent a heterogeneous mix of materials such as PVC, polyethylene, neoprene, nitrile and latex. In order to assess the impact of potential plastic and rubber degradation on the overall gas generation these components are modelled in the same manner as ion-exchange resins. The degradation of polymeric organic substrates is modelled as being first order with respect to their amounts.
METHANOGENESIS VIA THE MICROBIAL HYDROGEN MECHANISM
[image:10.612.35.295.490.681.2]be consumed anywhere in the system via the methanogenic reaction:
4H2 + CO2→ CH4 + 2H2O (3)
provided that there is sufficient humidity to support microbial processes. The minimum relative humidity required for microbial activity is approximately 0.6. It has been found in the cases analysed here that the relative humidity is almost always above this limit. The rate for this reaction is modelled as being first order with respect to CO2 concentration, but limited by the
availability of hydrogen.
CORROSION OF METALLIC WASTES
Corrosion of metallic wastes and container materials occurs within the saturated (water submerged) and vapour phases. Aqueous corrosion processes are possible in the vapour phase provided the relative humidity exceeds a threshold value of 0.6.
The inventory of carbon and galvanised steels in the repository will comprise various carbon steel wastes, as well as carbon and galvanised steel waste containers. Galvanised and carbon steels are treated as a single metallic source, represented by the corrosion of Fe as carbon steel (C-steel). The initial presence of ferric corrosion products (rust) due to corrosion in air is neglected – all steel is conservatively assumed available for anaerobic corrosion.
The overall reaction for the anaerobic corrosion of C-steel is given below:
3Fe + 4H2O → Fe3O4 + 4H2 (4)
The reaction proceeds at a rate determined by the C-steel corrosion rate.
Passivated carbon steel comprises metallic waste forms grouted in cementitious materials and structural steel (rebar, rails, etc.) in contact with concrete. These materials are treated separately from the plain carbon and galvanised steel inventories because of the effect of the cementitious material on the corrosion rate. Although the rate of corrosion of passivated carbon steel is lower, the mechanism is treated in exactly the same fashion as for the plain carbon and galvanised steel.
Stainless steels and nickel alloys are present as container materials and waste from steam generators and end fittings from pressure tubes, as well as miscellaneous waste forms. These materials contain Fe, Ni, Cr, Mo, and other minor alloying elements, in amounts dependent on the composition of the particular alloy.
For simplicity, the corrosion of the passive materials is treated in the same manner as carbon steel (i.e., Eqn 4). The
passive materials and stainless steels/nickel alloys are modelled as 100% Fe and as fully reacting at a slower rate based on the effective corrosion rate of each type of metal.
Zirconium alloy waste comprises pressure tubes and other components of the decommissioned reactors. Typically these alloys contain small amounts of Nb, which is approximated as corroding similar to Zr. The corrosion of zirconium alloys is given by the following reaction:
Zr + 2H2O → ZrO2 + 2H2 (5)
CO2 ENHANCED CORROSION OF METALLIC WASTES
Carbon steel undergoes accelerated corrosion in the presence of high CO2 partial pressures. The enhanced corrosion
rate is primarily a consequence of the decrease in pH that accompanies the dissolution of CO2 in water to form carbonic
acid (H2CO3). However, because of the high HCO3
-concentration, the stable corrosion product is siderite (FeCO3)
rather than Fe3O4. The corrosion rates for metallic wastes
undergoing CO2 enhanced corrosion are taken to be a function
of the CO2 partial pressure, with the overall corrosion reaction
given by the following reaction:
Fe + H2CO3→ FeCO3 + H2 (6)
Although the pH of the environment is not specifically calculated within the model, the use of an enhanced corrosion rate in the presence of CO2 implicitly takes into account the
acidification resulting from the dissolution of CO2 in the
aqueous phase. In terms of the model, the rate of reaction is treated as a multiplier of the anaerobic corrosion rate. Therefore, depending upon the partial pressure of CO2, the
anaerobic corrosion rate is enhanced by an appropriate factor:
1 + (PCO2/RCO2)q (7)
where PCO2 is the partial pressure of CO2, RCO2 is a reference
partial pressure of CO2 and q is the reaction order with respect
to the partial pressure of CO2 and has a value of 0.67. If there
is no CO2 present, the factor is 1. The relative amounts of
Fe3O4 and FeCO3 formed are determined by the values of the
respective rate constants, which, in the case of FeCO3, is the
enhanced additional corrosion rate due to the partial pressure of CO2.
In addition to the carbon and galvanised steels, the stainless steels and nickel alloys are also modelled as undergoing enhanced CO2 corrosion and forming carbonate-containing
corrosion products based on the experience of using these materials in CO2-containing environments in the oil and gas