Comparing SLIM, SPAR-H and Bayesian Network
Methodologies
Eduardo Calixto1, Gilson Brito Alves Lima2, Paulo Renato Alves Firmino3 1Energy Planning Engineer (Coppe), Rio de Janeiro, Brasil
2Production Engineer Department, Fluminense Federal University (Uff), Rio de Janeiro, Brasil 3Rural University of Pernambuco, Recife, Brasil
Email: [email protected]
Received March 7, 2013; revised April 5, 2013; accepted April 19,2013
Copyright © 2013 Eduardo Calixto et al. This is an open access article distributed under the Creative Commons Attribution License, which permits unrestricted use, distribution, and reproduction in any medium, provided the original work is properly cited.
ABSTRACT
Human factors always affect maintenance performance, and in some cases, it’s critical to systems availability and reli- ability. Despite such importance, in so many cases, there’s no human reliability method applied to analyze mainte- nance tasks in order to understand better human factors influence in maintenance performance. There are several human analysis methodologies and regarding human factors, SLIM (Successes Likelihood Methods), SPAR-H (Standardized Plant Analysis Risk-Human Reliability Analysis Method) and Bayesian Net take into account such factors and may be a good approach to minimize human error. In order to propose a human reliability methodology to analyze maintenance tasks taking into account human factors, a case study about turbine star up tasks will be carried out. Therefore, different human reliability methods will be performed based on specialist opinion. Finally, the human error probability as well as drawbacks and advantages from different methods will be discussed to get a final conclusion.
Keywords: Human Reliability Analysis; Human Performance Factor; Human Error Probability
1. Introduction
In 1958, Williams suggested to consider Human Reliabil-ity in system reliabilReliabil-ity analysis. Further in 1960, some reliability studies have shown that part of equipment fail- ures had influence for human actions and in 1972, IEEE published a report about human reliability.
In 1975, Swain and Guttmann in order to solve some human failure in Atomic Reactors operation proposed the first Human Reliability approach. The THERP (Tech- nique for Human Error Prediction) is a method to predict human error probabilities and to evaluate the degradation of a man-machine system likely to be caused by human errors alone or in connection with equipment functioning, operational procedures and practices, or other system and human characteristics that influence system behavior [1].
From seventies and decades on, several methodologies were proposed and published by U.S Nuclear Regulatory Commission (USNRC) and other industries and Gov- ernmental Organizations.
Definitely, the Human reliability methods develop- ments were three stages time. The first on last twenty years (1970-1990) is known as First Human Reliability Methods Generation, which focuses on human error
probabilities and operational human error.
The Second phase, the next ten years approximately (1990-2005) is known as second Human Reliability Methods Generation focus in Human performance Factor and cognitive processes. Human performance factors are internal or external and in general are everything that take influence in human performance like workload, stress, sociological issues, psychological issues, illness, etc.
Finally, third phase stated in 2005 until today and is represented for methods which focus on human per-formance factors relations and dependencies. That is Third Human Reliability Methods Generation.
No matter aspects regarded in Human Reliability Me- thods, nowadays they are applied by different industries in order to reduce accidents, and cost of human error in operation and maintenance activities.
The MHIDAS data reports that from 247 accidents in refinery, 21.86% is related to human failure [2].
In pipeline enterprises, 41% of system failures have human error as root cause. Operation is responsible for 22% and maintenance is responsible for 59% [3].
Actually, there are several ways of aggregating several experts’ opinions: they can estimate alone, with their opi- nions then aggregated mathematically; or they can esti- mate alone but have limited discussions for clarification purposes; or they can meet as a group and discuss their estimates until they reach a consensus [4]. Thus the cases options are:
Aggregated Individual Method; this method entails that the experts do not meet but make estimates indi- vidually. These estimates are then aggregated statis- tically by taking the geometric mean of all the indi- vidual estimates for each task.
Delphi Method; experts make their assessments indi- vidually and then all the assessments are shown to all the experts.
Nominal Group Technique; this method is similar to the Delphi Method, but after the group discussion, each expert makes his or her own assessment. These assessments are then statistically aggregated.
Consensus Group Method; in this method, each member contributes to the discussion, but the group as a whole must then arrive at an estimate upon which all members of the group agree.
In Brazil OIL and gas industry, there’s low quantity of data about human error and mostly specialist opinion is required. Many of Human Reliability analysis in last ten years were applied in drilling projects and Bayesian Network, third Generation Human Reliability Method, is the main Human Reliability Methods. In order to obtain human failures data, aggregated individual methods were applied in most of cases. Thus, specialist opinion elicita- tion based in Bayes Methods.
In order to increase Human reliability analysis in Bra- zilian Oil & Gas downstream applications (project, maintenance, building and operational), Human Reliabil- ity Methods case study of compressor startup were car- ried out. The Consensus-Group Method to collect spe- cialist opinion about human failures probability and in addition, Second and Third Human Reliability Methods Generation were applied.
2. Human Reliability Concepts
First, confirm that you have the correct template for your Human reliability is probability of human carried out specific tasks with satisfactory performance. That con- cept can be applied to different tasks like equipment re- pair, equipment or system operation, safety action, anal- ysis and all kind of human action which takes influence in system performance. Thus, came out the main ques- tions that Human Reliability Analysis will try to answer: What can be wrong?
Which are the Human failure consequences?
Which Human performance factors take influence in human reliability?
What is necessary to improve human reliability to avoid or prevent human error?
In order to answer such question an appropriate meth- ods must be applied and it’s depends on:
Human Analysis objectives, it means, is applied to investigate incident, to improve maintenance proce- dures, to improve operational steps.
The second critical point is which human failures data are available to performance analysis. To perform HRA is necessary specialist opinion or to use human failure data available.
The last and one of most critical issue is time to per- form analysis, because depends on methodology, is required specialist and software as main resources. Time is always critical issue because human reliabil- ity analysis can last for hours or days.
In order to decide which HRA methods to apply, re- garding three critical issues above, is necessary to know about such methods their objectives and limitation. De-pends on HRA method, the focus is on human error probability prediction, understand human error in cogni- tive process or understand human performance factors influence on human error. By definition, human error can be:
Omission Error happens when one action is not per- formed due to lapse or misperception. As instance, in preventive incident action, omission error is misper- ception of alarm and not performs action required. Equipment degradation due repair is omission error when due lapse, steps of procedures are not per- formed.
Commission Error happens when action is performed wrongly due to wrong quantity or quality of action or mistake in select or procedure sequence. As instance, in preventive incident action, commission error is se- lect wrong command or make mistake in sequence of actions required. Equipment degradation due repair is commission error when repair is performed wrongly. Intentional Error happens when action is performed
or procedure steps are not followed with awareness about consequences. As instance, in preventive inci- dent action, that happen when operator do not follow safety procedure completely to reestablish system faster. Equipment degradation would occur when in- tentional wrong action is performed during repairs like put some tools into equipment intentionally be- fore close equipment to cause some damage.
Actually, so many factors influence in human error like Human performance factors and human behavior. Internal human performances factors depend on each individual characteristic and they are:
Psychological: Stress, over psychological workload, depression, demotivation, not concentrated.
Such factors may be monitored in order to guarantee that employees will be in better physical and psycholo- gical shape to performed critical actions.
External human performances factor depends on company and society and they are:
Technological: procedures, equipment, work condi- tions.
Social: bad social conditions, bad acceptance in group.
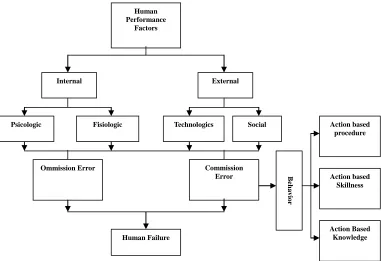
By this way, there must be some social issues that company has not control and ways to interfere and its take some influence in employees behavior. By the other way round, technological issues depends on companies and as better as such conditions is expected better em- ployees performance. Figure 1 show HRA factors which take influence in Human error.
Behavior in action, it means maintenance, operation or preventive incident sequence action, are performed based in procedure, skill and knowledge.
When Action based in procedure is carried out, pro- cedure has high influence in action performance mainly when employees have not high experience in execute task.
When action based in skill is carried out, human per- formance has high influence by practical experience in specific task and time to perform that [5].
When action based knowledge is carried out human performance have high influence by time and task com- plexity which require time enough to information be processed and implemented.
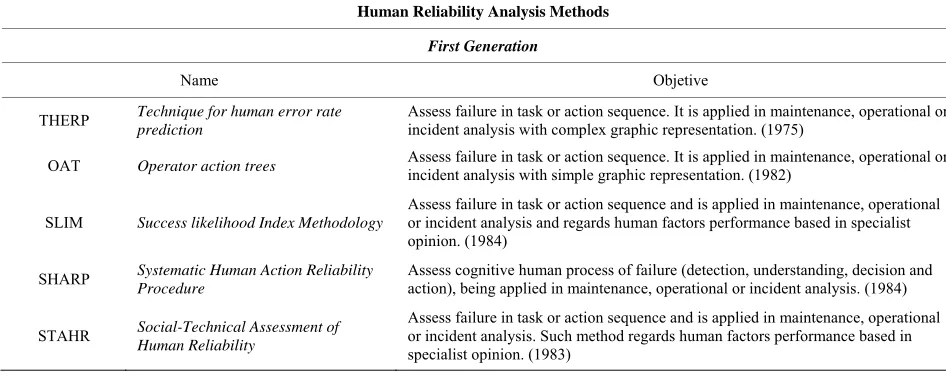
In order to perform HRA is also necessary to know HRA methods feature. The Table 1 focus on first HRA methods generation which main objective is defines se- quence of action and human error probability.
The Table 2 gives examples of second and third HRA Methods Generation which main objective is human cognitive process and human’s factor dependency re- spectively.
Actually, depends on HRA objective and problem characteristic, is advisable to implement the most appro- priated method in order to be succeed. Whenever is it possible to apply more than one method and compare results is great because it gives you a chance to certify results about which human performance factor take more influence in human error.
The next topics will explain different HRA methods that will be applied further to analyses human error dur- ing a turbine start up task.
3. SPAH-R Method
In support of the Accident Sequence Precursor Program (ASP), the U.S. Nuclear Regulatory Commission (NRC), in conjunction with the Idaho National Laboratory (INL), in 1994 developed the Accident Sequence Precursor Standardized Plant Analysis Risk Model (ASP/SPAR) human reliability analysis (HRA) method, which was used in the development of nuclear power plant (NPP) models. Based on experience gained in field testing, this method was updated in 1999 and renamed SPAR-H,
Human Failure
Ommission Error Commission
Error Human
Performance Factors
Internal External
Psicologic Fisiologic Technologics Social Action based
procedure
Action based Skillness
Action Based Knowledge
Be
h
a
v
[image:3.595.108.489.457.718.2]ior
Table 1. First generation. Source: Calixto, 2011.
Human Reliability Analysis Methods
First Generation
Name Objetive
THERP Technique for human error rate
prediction
Assess failure in task or action sequence. It is applied in maintenance, operational or incident analysis with complex graphic representation. (1975)
OAT Operator action trees Assess failure in task or action sequence. It is applied in maintenance, operational or incident analysis with simple graphic representation. (1982)
SLIM Success likelihood Index Methodology
Assess failure in task or action sequence and is applied in maintenance, operational or incident analysis and regards human factors performance based in specialist opinion. (1984)
SHARP Systematic Human Action Reliability
Procedure
Assess cognitive human process of failure (detection, understanding, decision and action), being applied in maintenance, operational or incident analysis. (1984)
STAHR Social-Technical Assessment of
Human Reliability
[image:4.595.56.529.105.293.2]Assess failure in task or action sequence and is applied in maintenance, operational or incident analysis. Such method regards human factors performance based in specialist opinion. (1983)
Table 2. Second generation. Source: Calixto, 2011.
Human Reliability Analysis Methods
Second Generation
Name Objective
ATHEANA A Technique for Human
Error Analysis
Assess cognitive human process of failure (detection, understanding, decision and action), being applied in maintenance, operational or incident analysis. (1996)
CREAM Cognitive Reliability and Error Analysis Method Assess cognitive human process of failure (detection, understanding, decision and action), being applied in maintenance, operational or incident analysis. (1998)
Third Generation
Name Objective
Redes Bayesianas Assess failure in task or action sequence and is applied in maintenance, operational or incident analysis and regards human factors performance based in specialist opinion. In addition such methods regards human factors performance dependency.(2005)
Standardized Plant Analysis Risk-Human Reliability Analysis method [6].
The main objective is to define human failure prob-ability regarding human performance factor influence. Such methodology requires specialist opinion in order to define human factors influence that follows standard file with values. The PSF (performance factors, will com-prise HEP (Human Error Probability) in Equation (1) as shown below.
The SPAR-H method is straightforward, easy to apply, and is based on a human information processing model of human performance and results from human perform-ance studies available in the behavioral sciences litera-ture [6].
4. SLIM Method
In 80 ages, The U.S. Nuclear Regulatory Commission has embarked upon a multiyear research program to in-vestigate different methods for using expert judgments to
estimate human error probabilities in nuclear power plants. One of the methods investigated, derived from multi-attribute utility theory, is the Success Likelihood Index Methodology implemented through Multi-Attrib- ute Utility Decomposition (SLIM-MAUD).
Brookhaven National Laboratory (BNL) developed and evaluated one method of obtaining human reliability estimates from expert judges—the Success Likelihood Index Methodology (SLIM). SLIM comprises a set of procedures based on Multi-Attribute Utility Theory for eliciting and organizing estimates by experts of the pro- bability of success or failure of specific human actions in nuclear power plants.
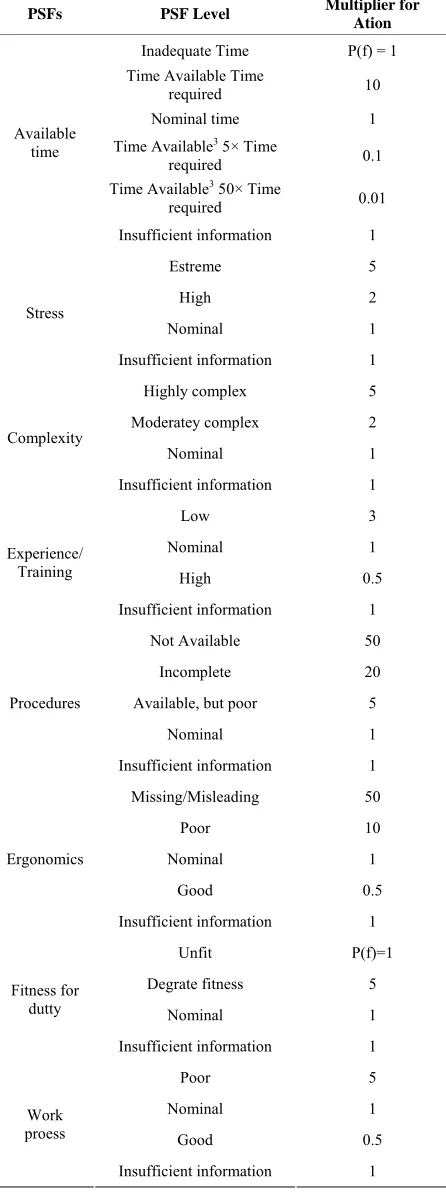
Table 3. PSF values. Source: NUREG, CR-6883.
PSFs PSF Level Multiplier for Ation
Inadequate Time P(f) = 1 Time Available Time
required 10
Nominal time 1
Time Available3 5× Time
required 0.1
Time Available3 50× Time
required 0.01
Available time
Insufficient information 1
Estreme 5
High 2
Nominal 1 Stress
Insufficient information 1
Highly complex 5
Moderatey complex 2
Nominal 1 Complexity
Insufficient information 1
Low 3
Nominal 1
High 0.5 Experience/
Training
Insufficient information 1
Not Available 50
Incomplete 20
Available, but poor 5
Nominal 1 Procedures
Insufficient information 1
Missing/Misleading 50
Poor 10
Nominal 1
Good 0.5 Ergonomics
Insufficient information 1
Unfit P(f)=1
Degrate fitness 5
Nominal 1 Fitness for
dutty
Insufficient information 1
Poor 5
Nominal 1
Good 0.5 Work
proess
Insufficient information 1
dures for applying the resultant SLIM-MAUD method- ology were developed [7].
Following a description of the method [7], the SLIM methods steps are:
1) Constitution of the group of experts and first ap- proach to the case of analysis.
2) Definition and selection of the Performance shaping factors for the case of analysis.
3) Assignment of weighting factors for each PSF. 4) Scoring of each PSF.
5) Calculation of the success likelihood index. 6) Conversion of the SLI in HEP.
The first step requires knowing what is being assessed and which employee have a good idea about problem in order to identify PSF and which one take more influence in such human error in activity.
Further, once the right group to carry out analysis, is defined which human performance factors take into ac- count it weight which vary from 0% to 100%. As doing so, it necessary to score each PSF per each task and mostly scores vary from 1 to 9, depends on PSF charac- teristics. In cases of PSF’s high performance required, for example training level, the best score is 9. By the other way round, in cases of lower PSF’s performance required, for example stress, the best score is 1 (Table 3).
Is advisable to make up one table which describes tasks and PSFs to be easier to understand and calculate HEP. Table 4 below describes PSFs regarded to be as-sessed in SLIM method with specialist opinion about PSFs level.
[image:5.595.307.537.509.609.2]After define score for PSF and its weights is necessary to calculate SLIM multiplying scores per weights and adds values to have one slim per task as shown in Table 5.
Table 5 was considered as weights for each PSF:
Table 4. Slim table.
Score Table
Task Procedure Training Supervision
Task 1 6 8 9
Task 2 7 8 9
Task 3 6 9 9
[image:5.595.308.538.638.735.2]Task 4 9 8 9
Table 5. Slim table with scores and weighs.
Score Table
Task Procedure Training Supervision SLIM
Task 1 6 × 0.5 8 × 0.3 9 × 0.2 7.2
Task 2 7 × 0.5 8 × 0.3 9 × 0.2 7.7
Task 3 6 × 0.5 9 × 0.3 9 × 0.2 7.5
20% for Supervision; 50% for procedure; 20% Training.
After calculate slim is necessary to calculate HEP us- ing Equation (2) below.
LogP = aSLI + b (2) In order to define “a” and “b” values, is necessary to know two values of HEP that in equation is P and SLI to solve equation. Thus, with HEP calculated for each task is necessary to calculate final HEP that will be the sums of all HEPs.
5. Bayesian Network Method
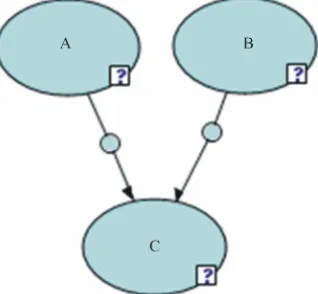
The Network Bayesian methodology was developed in 80 ages to make easier prediction in Artificial Intelli- gence analysis [8]. It can be defined as graphic frame- works which represents arguments in uncertain domain [9]. Such framework are unicycle Graphs cause it cannot make up closed cycles and have only one direction. The node represents random variables and arcs represent di- rect dependency between variables relations. The arcs direction represents cause effect relation between vari- ables [8]. In figure below the network Bayesian is repre- sented being node C, consequence from cause A and B.
In Figure 2, node A and B are sons of C and node C is called ancestral of A and B, in other words, C is called father of A and B. In Human Reliability analysis, the Nodes A and B represents Performance human factor and node C represents Human error probability conditioned to human performance factors A and B. As usual, The Human Performance factor represented by nodes A and B can be internal (Stress, over workload, depression, de- motivation, health conditions, deceases) or external (pro- cedures, equipment, work conditions, bad social condi- tions, bad acceptance in group).
[image:6.595.94.253.568.715.2]Into each node there’s conditional PDF (probability density function) which represent variables values along time when random variable represent such event when
Figure 2. Bayesian network. Author: Calixto, 2011.
it’s not there’s a constant conditional probability value. The Equation (3) below shows Bayes equation.
P B A
P A
P A B
P B
(3)
The methodology Bayesian belief networks (BBN) provides a greater flexibility as not it only allows for a more realistic representation of the dynamic nature of man-system, but also allows for representation of the relationship of dependence among the events and per- formance shaping factors [10].
6. Maintenance Case Study
The maintenance case study analyzes human failure in sequence procedure to star up a turbine after maintenance. The startup is considered maintenance group task and require for steps:
STEP 1—Close Vapor Valve; STEP 2—Close Suction Valve; STEP 3—Open Suction Valve; STEP 4—Open Vapor Valve.
In case of failure in startup sequence tasks the Turbine shut down and may have damage that last from 2 h to 1 month to be fixed. The turbine shutdown does not cause any damage to other System but the monetary conse- quence to use private electric energy varies from U$ 1.25000 to U$ 450.00000 respectively.
The stat up procedure was carried out for one inexpe- rience employee and his supervisor checked out his steps realizing that sequence was proceeded wrongly having time to be corrected for supervisor. Further, the failure was assessed and was implemented improvement in pro- cedure that was not clear enough.
In order to find out how much loss of money is ex- pected in case of start up turbine failure was carried out HRA to define human failure probability before and after improvement.
Consensus-Group Method were applied to define scores values, by this way, each member contributed to the discussion and define values scores.
The main objective of case study is defining human error probability and furthermore, compares different HRA methods in order to implement in operational rou- tine to assessment of human failure. As doing so three methods (SPAH, SLIM and Bayesian Network) will be carried out and compared.
6.1. SPAR-H
The template is designed so that author affiliations are Identify the Headings
erators estimate human probability values to human fail- ures in tasks 1 to 4. As doing so, the operator opinion was considered to describe PSFs composite too. In gen- eral SPAR-H method is used to assess a complete activ- ity but in this case the Equation (3) below was applied to define Human Error Probability.
compositecomposite
NHEP PSF HEPNHEP PSF 1 1
(3) The Table 6 below shows PSFs composite values for each task.
By this way, is possible to observe that PSFs had same values, because tasks is very similar and is considered that are affected the same way by PSFs.
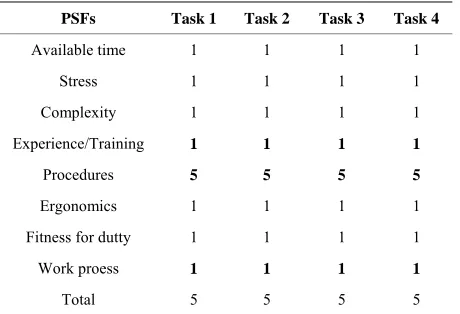
[image:7.595.308.537.430.607.2]As doing so, the availability time was considered ade-quate, nominal stress level, nominal complexity, poor procedure, nominal ergonomics, nominal fitness for duty and nominal work process. Nominal qualification means that such PSFs are under good conditions and have low influence in failure. The Table 7 shows Human Error probabilities. HEP1 regards specialist opinion about task human error probability. The SPAR-H procedures sug- gest to use 0.1 to HEP in commission error and 0.001 to omission error. In this case, was considered specialist opinion and for each task was defined HEP that is stated in HEP1 column. Further, the column HEP2 de fine HEP regarding PSFs influence applying Equation (3) and final Human error probability is 56%.
Table 6. PSFs composite (before improvement).
PSFs Task 1 Task 2 Task 3 Task 4
Available time 1 1 1 1
Stress 1 1 1 1
Complexity 1 1 1 1
Experience/Training 1 1 1 1
Procedures 5 5 5 5
Ergonomics 1 1 1 1
Fitness for dutty 1 1 1 1
Work proess 1 1 1 1
[image:7.595.59.289.454.611.2]Total 5 5 5 5
Table 7. PSFs composite (before improvement).
HEP2 HEP1
Open Vapor Valve—Task 1 0.357143 0.1
Open Suction Valve—Task 2 0.0005 0.0001
Close Suction Valve—Task 3 0.208333 0.05
Open Vapor Valve—Task 4 0.0005 0.0001
Total 0.566476
In order to reduce Human Error Probability, were pro- posed improvement in procedure to makes it clearest. As doing so, the new values to PSFs are shown in Table 8 below.
By the human reliability point of view, regarding spe- cialist opinion, all PSFs are nominal after procedure im- provements having high influence in final Human Error Probability as show in Table 9. Thus, the final Human Error probability is now 15.02%.
Regarding 56% of Human Error Probability the ex- pected cost of human failure vary from U$ 700.00 to U$ 252.00000 in optimist and pessimist terms respectively.
After improvement, regarding 15% of Human Error Probability the expected cost of human failure vary from U$ 187.00 to U$ 67.50000. The reduction in cost vary from U$ 513.00 to U$ 184.50000.
The group of specialist which carried out the SPAR-H analysis regarded about method that:
SPAR-H is easy to be implemented;
The omission and commission Human Error Prob-ability must represent turbine case study and specialist opinion must be regarded to define it;
It’s possible in some cases to be other human per- formance factor that is not considered in SPAR-H pro- cedure and in this case some of human performance fac- tor in procedure would be take place.
Table 8. PSFs composite (after improvement).
PSFs Task 1 Task 2 Task 3 Task 4
Available time 1 1 1 1
Stress 1 1 1 1
Complexity 1 1 1 1
Experience/Training 1 1 1 1
Procedures 1 1 1 1
Ergonomics 1 1 1 1
Fitness for dutty 1 1 1 1
Work proess 1 1 1 1
Total 1 1 1 1
Table 9. PSFs composite (after improvement).
HEP2 HEP1
Open Vapor Valve—Task 1 0.1 0.1
Open Suction Valve—Task 2 0.0001 0.0001
Close Suction Valve—Task 3 0.05 0.05
Open Vapor Valve—Task 4 0.0001 0.0001
[image:7.595.59.290.639.737.2]6.2. SLIM Case Study Application
The second method is SLIM and such procedure in ap- plied to Turbine Case. Thus, the first step was to define PSFs regarding specialist opinion and in this case is pro-cedure, training and supervision was defined. The next step is to give score importance in terms of lever of com-pliance to each PSF for each task. In this case scores vary from 1 to 9, and 9 means the highest compliance. Table 10 shows PSF scores based in specialist opinion. In this case the score are the same for all tasks because it simi-larity.
The next step is necessary to define importance for each PSFs varying from 0% to 100%. Total importance sums of all scores must be 100%. Thus the Table 11 shows importance to each PSF.
The next step is defined SLI, multiplying Scores per each PSFs values as shown in Table 12.
The next step is necessary to define HEP for each task and after to total start up activity. Thus, is necessary to define variables values for Equation (4).
LogP = aSLI + b (4) In order to define “a” and “b” parameters, is necessary to have P (HEP) value that can be considered by specialist
Table 10. Scores values (before improvement).
Score Table
PF rate Procedure Trainning Supervision
Open Vapor Valve—Task 1 6 8 9
Open Suction Valve—Task 2 6 8 9
Close Suction Valve—Task 3 6 8 9
Open Vapor Valve—Task 4 6 8 9
Table 11. Importance values (before improvement).
PSFs Importance
Procedure 50%
Trainning 30%
Supervision 20%
Total 100%
Table 12. SLI values (before improvement).
SLI Table
Tasks Procedure Trainning Supervision SLI
Open Vapor Valve—Task 1 3 2.4 1.8 7.2
Open Suction Valve—Task 2 3 2.4 1.8 7.2
Close Suction Valve—Task 3 3 2.4 1.8 7.2
Open Vapor Valve—Task 4 3 2.4 1.8 7.2
opinion. As doing so, regarding 0.1 and 0.0001 for task one and two respectively. The final equation will enable to calculate HEP for each task, thus Equation (5) will be:
0.24 SLI 0.18
HEP 10 (5) The final step is applying SLI value for each task in Equation (5). The Table 13 below shows the final Hu-man Error probability.
By analyst point of view, procedure is the PSFs which take more influence in human error probability. As doing so, after procedure improvement is expected that final probability reduce to 10%. The new expected score to procedure value is 9 as show in Tables 14 and 15.
The next steps are modifying importance values and in this case procedure importance will reduce due to not take more high influence in Turbine start up.
The new SLI value is show in Table 16 below regard- ing new scores and importance values.
The final step is defining new HEP for each task and after to total start up activity regarding procedure improve- ment. Thus, is necessary to define again variables values for equation below.
LogP = aSLI + b
Table 13. SLI values (before improvement).
aSLI + b Tasks
(−0.024*SLI) + 0.18
0.24 SLI 0.18
10
Open Vapor Valve—Task 1 −1 0.10 Open Suction Valve—Task 2 −1 0.10 Close Suction Valve—Task 3 −1 0.10 Open Vapor Valve—Task 4 −1 0.10
Total 40%
Table 14. Scores values (after improvement).
Score Table
PF rate Procedure Trainning Supervision Open Vapor Valve—Task 1 9 8 9 Open Suction Valve—Task 2 9 8 9 Close Suction Valve—Task 3 9 8 9 Open Vapor Valve—Task 4 9 8 9
Table 15. Importance values (after improvement).
PSFs Importance
Procedure 0.1 Trainning 0.5 Supervision 0.4
Table 16. SLI values (after improvement).
SLI Table
Tasks Procedure Trainning Supervision SLI Open Vapor Valve—Task 1 0.9 4 3.6 8.5 Open Suction Valve—Task 2 0.9 4 3.6 8.5 Close Suction Valve—Task 3 0.9 4 3.6 8.5 Open Vapor Valve—Task 4 0.9 4 3.6 8.5
In order to define new “a” and “b” parameters, is nec- essary to have P (HEP) value that can be considered by specialist opinion after procedure improvement. As doing so, regarding 0.01 and 0.0001 for task one and two re- spectively. The final equation will enable to calculate HEP for each task, thus Equation (7) will be:
3 SLI 27.18
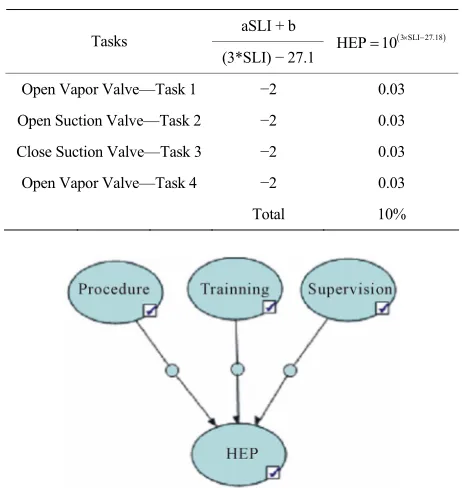
HEP 10 (7) The final step is again applying new SLI values for each task in Equation (7). The Table 17 below shows the final Human Error probability.
Regarding 40% of Human Error Probability the ex- pected cost of human failure vary from U$ 500.00 to U$ 180.00000 in optimist and pessimist terms respectively.
After improvement, regarding 10% of Human Error Probability the expected cost of human failure vary from U$ 125.00 to U$ 45.00000. The reduction in cost varies from U$ 375.00 to U$ 135.00000.
The group of specialist which carried out the SLIM analysis regarded about method that:
SLIM is not easy to be implemented because be- yond specialist opinion requires mathematics treatments;
The specialist opinion takes high influence in HEP value;
6.3. Bayesian Network Case Application
The final method is from Third Human Reliability Gen- eration and the advantage is to consider PSFs conditional probability related with human error probability.
Thus, regarding as main PSFs, procedure, supervision and training, the Bayesian Network is represented as Fig-ure 3.
Thus, HEP = P(C = 1). In general, P(ST = 1).Thus:
1 1 1
1 2 3
0 0 0
1 2 3
HEP P T P P P S
P ST 1 T , P ,S
i j k
i j
i j k
k
where:
ST = human error in start up turbine = (ST = 1) T = good training (Ti = 0)
T = bad training (Ti = 1)
P = Good procedure (Pi = 0)
P = Bad procedure (Pi= 1)
Table 17. SLI values (after improvement).
aSLI + b Tasks
(3*SLI) − 27.1
3 SLI 27.18
HEP 10
Open Vapor Valve—Task 1 −2 0.03 Open Suction Valve—Task 2 −2 0.03 Close Suction Valve—Task 3 −2 0.03 Open Vapor Valve—Task 4 −2 0.03
Total 10%
Figure 3. Start up turbine Bayesian network. Author: Ca- lixto, 2011.
S = good Supervision (Si = 0)
S = bad Supervision (Si = 1)
Thus,
P ST T, P,S P T P P P S
P ST T, P,S P T P P P S
P ST T, ,S P T P P P S
P ST T, P,S P T P P P S
P ST T, P,S P T P P P S P
HEP P ST T, P,S P T P P P S
P ST T, P,S P T P P P S
P ST T, P,S P T P P P S
In order to calculate HEP is necessary to get specialist opinion to define probability value as shows in question-naire below.
Specialist Opinion Questionnaire:
1) What is the probability to failure in start up turbine if procedure is not good? (Optimist = 60% and Pessimist = 90%)
2) What is the probability to failure in start up turbine if supervision is not good? (Optimist = 20% and Pessi- mist = 40%)
[image:9.595.62.284.100.196.2] [image:9.595.309.537.100.341.2]if training is not good? (Optimist = 40% and Pessimist = 60%)
4) What is the probability to failure in start up turbine if training, procedure and supervision are not good? (Op-timist = 90% and Pessimist = 100%)
5) What is the probability to failure in start up turbine if procedure and supervision are not good and training is good? (Optimist = 80% and Pessimist = 90%)
6) What is the probability to failure in start up turbine if procedure and training are not good and supervision is good? (Optimist = 80% and Pessimist = 90%)
7) What is the probability to failure in start up turbine if procedure is not good and supervision and training is good? (Optimist = 60% and Pessimist = 70%).
8) What is the probability to failure in start up turbine if supervision and training are not good and procedure is good? (Optimist = 20% and Pessimist = 30%)
9) What is the probability to failure in start up turbine if supervision is not good and procedure and training is good? (Optimist = 10% and Pessimist = 20%)
10) What is the probability to failure in start up turbine if training is not good and procedure and supervision is good? (Optimist = 1% and Pessimist = 0%)
11) What is the probability to failure in start up turbine if supervision procedure and training are good? (Optimist = 0% and Pessimist = 0%).
This questionnaire comes from conditional probability equation and input probability values in Bayesian method the result.
[image:10.595.79.267.481.718.2]Applying such values, in E&P Office software and performing simulation, the Human Error Probability is 44% as shown in Figure 4.
Figure 4. Bayesian network results (before improvement).
After implementing procedure improvement specialist believe that failure in start up turbine due to procedure goes down from 60% to 10%. That reduces the startup failure from 46% to 13% as shown in Figure 5.
Regarding 44% of Human Error Probability the ex-pected cost of human failure vary from U$ 575.00 to U$ 207.00000 in optimist and pessimist terms respectively.
After improvement, regarding 13% of Human Error Probability the expected cost of human failure vary from U$ 162.50 to U$ 58.50000. The reduction in cost varies from U$ 412.50 to U$ 148.50000.
The group of specialist which carried out the Network Bayesian analysis regarded about method that:
Bayesian Network is not easy to be implemented cause mathematics treatments and questionnaire;
The specialist opinion takes high influence in HEP value;
To have one software make easier to calculate final HEP, without software is not enable to perform such ana- lysis.
7. Conclusions
Based on different Human reliability methods results, it is clear that the final HEP is similar for all methods. In this case, both methods had similar results regarding the same human performance factors as well as group of spe- cialist opinion.
The specialist opinion has high influence in all meth- ods results. Despite similar results, the Bayesian Network method is harder to be applied and to obtain the reliable answer from specialist due to complexity of such method. As much as the number of performance factors, harder will be to specialist answer precisely the questionnaire.
The second harder Human reliability method to be ap-
[image:10.595.319.525.512.717.2]plied is SLIM due to complexity of math involved to define the final Human error probability.
The simplest method to be applied is the SPAR-H. By the other way round, it is necessary to check if human performance factor that is being taken into account in human reliability analysis is related on Table 3. No mat- ter the complexity, both methods are consistent and got similar results.
The expected cost is also an important result to show the consequence of human error economically. Depends on Human reliability analysis objective, different sensi- tivity analysis based on human error probability can be carried out, for example risk analysis.
The future of this research is to apply such human re- liability methods to analyze other maintenance tasks in order to validate the results that both methods have simi- lar HEP result and SPAR-H is the simplest method among those methods proposed in this paper.
REFERENCES
[1] A. D. Swain and H. E. Guttmann, “Handbook of Human Reliability Analysis with Emphasis on Nuclear Power Plant Applications,” Draft, NUREG/CR-1278, 1980. [2] V. A. Silva, “O Planejamento de Emergências em
Refi-narias de Petróleo Brasileiras: Um Estudo dos Planos de Refinarias Brasileiras e uma Análise de Acidentes em Re- finarias no Mundo e a Apresentação de uma Proposta de Relação de Canários Acidentais para Planejamento,” Dis- sertação (Mestrado em Sistemas de Gestão) Universidade Federal Fluminense, Niterói, 2003.
[3] L. J. Bellamy, T. A. W. Geyer and J. A. Astley, “Evalua- tion of the Human Contribution to Pipework and In-Line Equipment Failure Frequencies,” Health and Safety, London, 1989.
[4] M. Grozdanovic, “Usage of Human Reliability Quantifi- cation Methods,” International Journal of Occupational Safety and Ergonomics (JOSE), Vol. 11, No. 2, 2005, pp. 153-159.
[5] A. D. Swain and H. E. Guttmann, “Handbook of Human Reliability Analysis with Emphasis on Nuclear Power Plant Applications,” US Nuclear Regulatory Commission, Washington DC, 1983.
[6] “The SPAR-H Human. Reliability Analysis Method,” NUREG/CR-6883, INL/EXT-05-00509, Idaho National Laboratory, US Nuclear Regulatory Commission, Wash- ington DC, 2005.
[7] D. E. Embrey, P. Humphreys, E. A. Rosa, B. Kirwan and K. Rea, “SLIM-MAUD: An Approach to Assessing Hu- man Error Probabilities Using Structured Expert Judg- ment, Volume 2: Detailed Analysis of the Technical Is- sues,” NUREG/CR-3518, Brookhaven National Labora-tory, Upton, 1984.
[8] R. da C. L. Menezes, “Uma Metodologia para Avaliação da Confiabilidade Humana em Atividades de Substituição de Cadeias de Isoladores em Linhas de Transmissão,” Dissertação de Mestrado, UFPE, Recife, 2005.
[9] K. B. Korb and A. E. Nicholson, “Bayesian Artificial In- telligence,” Chapman & Hall/CRC,Boca Raton, 2003. [10] D. E. Lopez, “Análise da Confiabilidade Humana via Re-