International Journal of Emerging Technology and Advanced Engineering
Website: www.ijetae.com (ISSN 2250-2459,ISO 9001:2008 Certified Journal, Volume 4, Issue 1, January 2014)
494
Power System’s Voltage Stability Improvement Using Static
Var Compensator
Matthew Simeon
1, Wara S. Tita
2, Adejumobi A. Isaiah
3,
Ajisegiri E. S. A.
4, Olanipekun A. Joseph
5 1,2,3,4,5Federal University of Agriculture, Abeokuta
Abstract— In alternating current systems, voltage
fluctuation is a common phenomenon. Most of the voltage fluctuation problems result from the changes in the system’s reactive power resulting from excessive supply or consumption of reactive power by the elements of the system and the variation in the consumers’ loads. In this paper, the effect of Static Var Compensator (SVC) in stabilizing power system’s voltage through effective reactive power compensation was investigated. Power flow equations involving voltage drop with/without SVC were developed. SVC modeling equations were also developed and used to determine its parameters. Based on the SVC parameters, SIMULINK blocks were used to implement the phase controlled Thyristor–Controlled-Reactor Fixed-Capacitor (TCR-FC) SVC. The Nigerian 28-bus power system used for the study was also modeled using SIMULINK/MATLAB. The 28-bus system was first simulated without SVC and then with two SVCs located at different buses to obtain the bus voltages in both cases. From the bus voltages the total voltage drops for the system with and without SVC were estimated and compared. The compared results clearly showed that, the system’s voltage drop was reduced by 33.78% indicating a significant improvement in the system’s voltage stability when SVCs were applied.
Keywords—Reactive Power, SIMULINK, Static Var
Compensator, Voltage Drop,Voltage Stability
I. INTRODUCTION
Power systems suffer greatly from voltage instability especially due to excessive consumption or injection of reactive power by the system elements and the consumers’ loads.
The voltage instability caused by the variation in the reactive power requirement of the system’s elements and the consumers’ loads either result in excessive high or low voltage which may cause damage to the system and the consumer’s load since the system elements and the consumers’ loads are design to operate within a specific voltage range.
The system’s voltage goes high if there is excessive injection of reactive power by the system elements or the consumers’ loads, but goes low if there is excessive consumption of reactive power by the system elements or the consumers’ loads.
As a result the system’s reactive power needs to be continuously adjusted through effective reactive power compensation if the variation in the system’s voltage must be kept within the allowable range [6]. To achieve this several methods have been used. The traditional methods used include [7]: reconfiguration of system structure, generator excitation regulation, synchronous generator, changing the voltage by transformer tap to adjust the power flow in the grid, series compensation capacitor, switching in/out the shunt reactor or shunt capacitor.
With these methods the desired objectives were not effectively achieved with wear and tear in the mechanical components and slow response being the major problems. However, extensive research works were carried out recently leading to the discovery of FACTS devices which have been mainly used for solving various power system steady state control problems such as, voltage regulation, power flow control, and transfer capability enhancement with near-instantaneous response [1]. These FACTS devices include: Static VAR Compensator (SVC), Controlled Series Capacitor (TCSC), Thyristor-Controlled Phase Shifter (TCPS), Static Synchronous Compensator (STATCOM), Static Synchronous Series Compensator (SSSC), Unified Power Flow Controller (UPFC), Interline Power Flow Controller (IPFC),
All the FACTS devices exhibit near instantaneous response to system changes and are made up of solid semi-conductor component thereby eliminating the problems of mechanical wear and tear. However, this paper seeks to study the effect of the Static Var Compensator in stabilizing power system’s voltage using the Nigerian 28-bus 330kV power system for the study and SIMULINK/MALAB as the simulation environment.
II. THE STATIC VAR COMPENSATOR
International Journal of Emerging Technology and Advanced Engineering
Website: www.ijetae.com (ISSN 2250-2459,ISO 9001:2008 Certified Journal, Volume 4, Issue 1, January 2014)
495
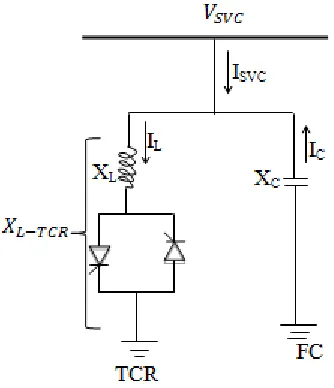
In its simple form, SVC is connected as [image:2.612.76.243.247.441.2]Thyristor-Controlled-Reactor Fixed Capacitor (TCR-FC) configuration as shown in Figure 1 with its equivalent circuit in Figure 2. Its major components include coupling transformer, thyristor valves, reactors, and capacitors (for harmonic filtering through tuning) [3].
Figure 1: Functional diagram of a TCR-FC SVC [5]
Figure 2: Equivalent circuit of the SVC [5]
III. THE POWER SYSTEM UNDER STUDY
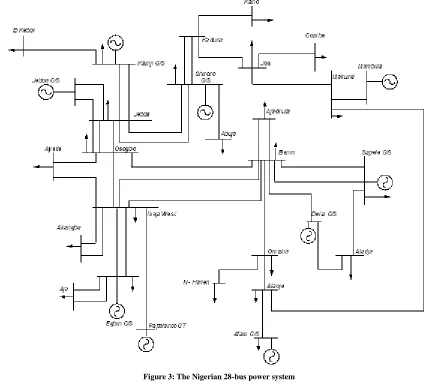
Figure 3, shows the Nigerian 330kV, 28-bus power system under study. It consists of twenty-eight (28) buses, nine (9) generation stations, and fifty-two (52) transmission lines.
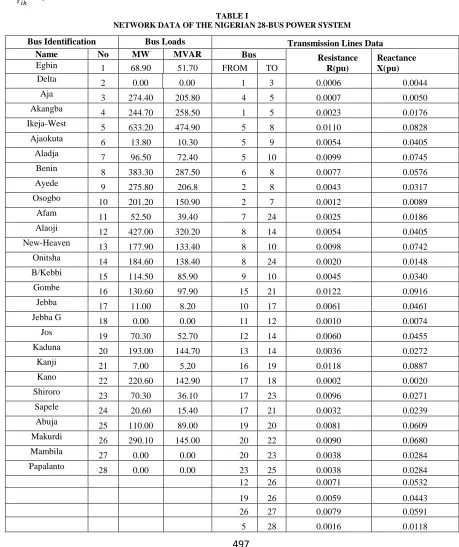
The relevant Data of the PHCN network as obtained from PHCN Control Centre, Oshogbo is as shown in Table I.
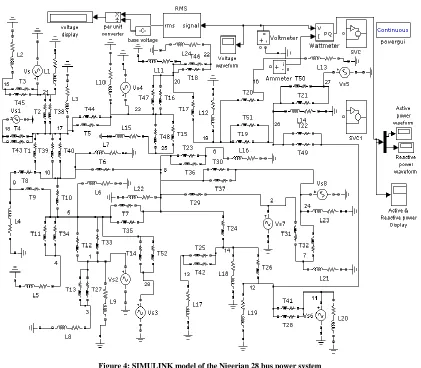
A. SIMULINK Model of the Nigerian 28-Bus Power System under Study
Using Figure 3 and Table I, the SIMULINK model of the single line diagram of the Nigerian 330kV, 28-bus power system used for the study was obtained as shown in Figure 4. Each generation station was modeled as a voltage source and each transmission line represented by its equivalent resistance and reactance.
In the model, measurement apparatus (voltmeter, ammeter and wattmeter) and the modeled SVC were incorporated.
B. Bus Voltage and Voltage drop Equations
[image:2.612.347.542.370.462.2]Consider a transmission line between any two given buses i and k extracted from the Nigerian 28-bus power system of Figure 4 and represented as shown in Figure 5.
Figure 5: Transmission Line Model extracted from the Nigerian 28-Bus Power System
The symbols used in the transmission line model of Figure 5 are defined as follows
= complex voltage at bus i
= complex power at bus k
= resistance of the transmission line between buses i
and k
= reactance of the transmission line between buses i
and k
=complex current flowing from buses i to k
= impedance of the transmission line between buses i
and k
From Figure 5, the voltage drop ( ) between buses i and k can be expressed as:
(1)
[image:2.612.118.224.473.635.2]International Journal of Emerging Technology and Advanced Engineering
Website: www.ijetae.com (ISSN 2250-2459,ISO 9001:2008 Certified Journal, Volume 4, Issue 1, January 2014)
[image:3.612.87.517.148.532.2]496
Figure 3: The Nigerian 28-bus power system
Source: (National Control Centre, Power Holding Company of Nigerian, 2012)
(2)
Where: =
Equation (2) can be expressed in admittance form as:
(3)
Where:
and is defined as the admittance of the
transmission line.
Now, the complex power ( ) flowing from bus i to k is
given by [4]:
(4)
Expressing the complex power of equation (4) in real power (P) and reactive (Q) power form gives;
(5)
Taking the conjugate of equation (5) yields;
(6)
From (6),
(7)
International Journal of Emerging Technology and Advanced Engineering
Website: www.ijetae.com (ISSN 2250-2459,ISO 9001:2008 Certified Journal, Volume 4, Issue 1, January 2014)
497
(8)From equation (8),
(9)
[image:4.612.74.533.192.739.2]From equation (9), it could be seen that by adjusting the system’s reactive power at bus k while keeping the voltage at bus i constant, the voltage between buses i and k can be regulated to minimizing the system’s total voltage drop.
TABLE I
NETWORK DATA OF THE NIGERIAN 28-BUS POWER SYSTEM
Bus Identification Bus Loads Transmission Lines Data
Name No MW MVAR Bus Resistance
R(pu)
Reactance X(pu)
Egbin 1 68.90 51.70 FROM TO
Delta 2 0.00 0.00 1 3 0.0006 0.0044
Aja 3 274.40 205.80 4 5 0.0007 0.0050
Akangba 4 244.70 258.50 1 5 0.0023 0.0176
Ikeja-West 5 633.20 474.90 5 8 0.0110 0.0828
Ajaokuta 6 13.80 10.30 5 9 0.0054 0.0405
Aladja 7 96.50 72.40 5 10 0.0099 0.0745
Benin 8 383.30 287.50 6 8 0.0077 0.0576
Ayede 9 275.80 206.8 2 8 0.0043 0.0317
Osogbo 10 201.20 150.90 2 7 0.0012 0.0089
Afam 11 52.50 39.40 7 24 0.0025 0.0186
Alaoji 12 427.00 320.20 8 14 0.0054 0.0405
New-Heaven 13 177.90 133.40 8 10 0.0098 0.0742
Onitsha
14 184.60 138.40 8 24 0.0020 0.0148 B/Kebbi 15 114.50 85.90 9 10 0.0045 0.0340
Gombe 16 130.60 97.90 15 21 0.0122 0.0916
Jebba
17 11.00 8.20 10 17 0.0061 0.0461 Jebba G 18 0.00 0.00 11 12 0.0010 0.0074
Jos 19 70.30 52.70 12 14 0.0060 0.0455
Kaduna 20 193.00 144.70 13 14 0.0036 0.0272
Kanji 21 7.00 5.20 16 19 0.0118 0.0887
Kano 22 220.60 142.90 17 18 0.0002 0.0020
Shiroro 23 70.30 36.10 17 23 0.0096 0.0271
Sapele 24 20.60 15.40 17 21 0.0032 0.0239
Abuja
25 110.00 89.00 19 20 0.0081 0.0609 Makurdi 26 290.10 145.00 20 22 0.0090 0.0680
Mambila 27 0.00 0.00 20 23 0.0038 0.0284
Papalanto 28 0.00 0.00 23 25 0.0038 0.0284
12 26 0.0071 0.0532
19 26 0.0059 0.0443
26 27 0.0079 0.0591
International Journal of Emerging Technology and Advanced Engineering
Website: www.ijetae.com (ISSN 2250-2459,ISO 9001:2008 Certified Journal, Volume 4, Issue 1, January 2014)
[image:5.612.96.517.132.500.2]498
Figure 4: SIMULINK model of the Nigerian 28 bus power system
1) Modeling of the Static Var Compensator:The TCR-FC functional diagram and its equivalent circuit are as shown in Figures 1 and 2 respectively.
Figure 1 shows that one branch of the SVC is purely inductive while the other branch is purely capacitive. As a result the SVC consumes no active power. It either consumes (inductive) reactive power to reduce the system’s voltage or injects reactive power to increase the system’s voltage. Since the reactor consumes reactive power, the reactor current (IL) is positive while the capacitor which
inject reactive power into the system has its current (IC) to
be negative. Thus the SVC current (ISVC) at maximum var
could be expressed as follows:
(10)
Where:
(11)
(12)
Capacitive reactance of the SVC
Inductive reactance of the SVC
C = Capacitance of the fixed capacitance of the SVC
f = Frequency of the system
= Bus Voltage magnitude
From figure 1(b), assuming that no real power is consumed by the SVC (i.e. PSVC = 0) then:
International Journal of Emerging Technology and Advanced Engineering
Website: www.ijetae.com (ISSN 2250-2459,ISO 9001:2008 Certified Journal, Volume 4, Issue 1, January 2014)
499
By comparing equations (10) and (13) we have:(14)
Combining equations (11), (12) and (14), we have:
( ) (15)
( ) (16)
. (17)
The SVC controller was designed in such a way that the TCR is switched off when the bus voltage becomes lower than the reference voltage and vice-versa. As a result, at maximum var absorption the FC and the TCR are in operation and as such;
(18)
And at minimum var absorption , so that;
(19)
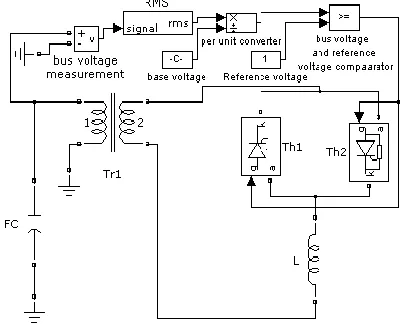
2) SIMULINK Model of the Static Var Compensator: The TCR-FC Static Var Compensator of Figure 1(a) was modeled using SIMULINK blocks as shown in Figure 5, where:
[image:6.612.342.547.441.574.2]FC = Fixed Capacitor; L = Reactor; Tr1 = Step down Transformer; Th = thyristor.
Figure 5: SIMULINK Model of SVC and its Controller
3) The Static Var Compensator Parameters and the System’s Voltage: The SVC controller was designed in such a way that the Thyristor valve is phase controlled and operates only when the voltage of the bus to which the SVC is applied becomes higher than the base voltage.
By so doing, the bus voltage is being regulated near or at the base voltage.
Assuming that the SVC is applied at bus k, then equation (1) becomes;
(20)
Comparing equations (17) and (20) gives;
√
(21)
Equation (20) shows that if is kept constant, then by keeping the bus ( ) near or at the base voltage, the
voltage drop is minimized and hence the system’s voltage stabilized.
IV. SIMULATION RESULTS AND DISCUSSION
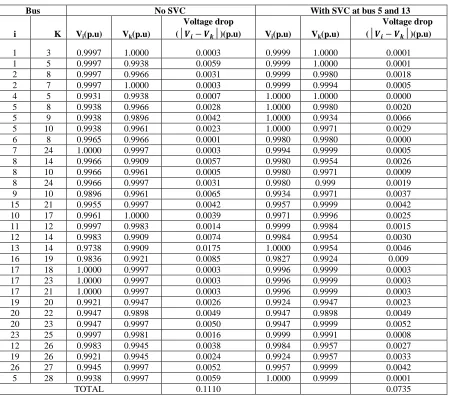
Table 2 shows the bus voltages and the voltage drops without/with SVC
A. Comparison Between the Voltage Drops without/with SVC
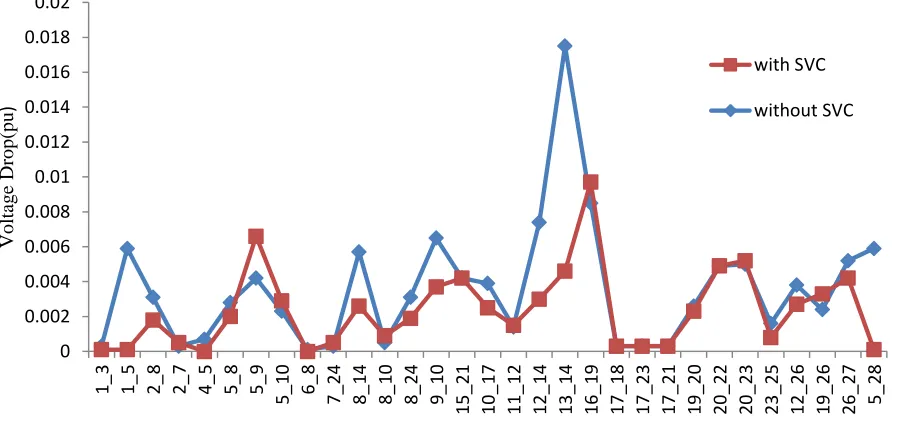
To appreciate the effect of SVC on the power system’s voltage, the system’s voltage drops without/with SVC were compared using the data from Table 2 as shown in Figure 6 and 7.
Figure 7: Bar Chart Showing the Total Voltage drops with/without SVC
[image:6.612.67.270.476.638.2]International Journal of Emerging Technology and Advanced Engineering
Website: www.ijetae.com (ISSN 2250-2459,ISO 9001:2008 Certified Journal, Volume 4, Issue 1, January 2014)
[image:7.612.83.533.155.552.2]500
TABLE II
BUS VOLTAGES AND VOLTAGE DROPS OF THE 28-BUS POWER SYSTEM WITHOUT/WITH SVC
Bus No SVC With SVC at bus 5 and 13
i K Vi(p.u) Vk(p.u)
Voltage drop
( )(p.u) Vi(p.u) Vk(p.u)
Voltage drop ( )(p.u)
1 3 0.9997 1.0000 0.0003 0.9999 1.0000 0.0001 1 5 0.9997 0.9938 0.0059 0.9999 1.0000 0.0001 2 8 0.9997 0.9966 0.0031 0.9999 0.9980 0.0018 2 7 0.9997 1.0000 0.0003 0.9999 0.9994 0.0005 4 5 0.9931 0.9938 0.0007 1.0000 1.0000 0.0000 5 8 0.9938 0.9966 0.0028 1.0000 0.9980 0.0020 5 9 0.9938 0.9896 0.0042 1.0000 0.9934 0.0066 5 10 0.9938 0.9961 0.0023 1.0000 0.9971 0.0029 6 8 0.9965 0.9966 0.0001 0.9980 0.9980 0.0000 7 24 1.0000 0.9997 0.0003 0.9994 0.9999 0.0005 8 14 0.9966 0.9909 0.0057 0.9980 0.9954 0.0026 8 10 0.9966 0.9961 0.0005 0.9980 0.9971 0.0009 8 24 0.9966 0.9997 0.0031 0.9980 0.999 0.0019 9 10 0.9896 0.9961 0.0065 0.9934 0.9971 0.0037 15 21 0.9955 0.9997 0.0042 0.9957 0.9999 0.0042 10 17 0.9961 1.0000 0.0039 0.9971 0.9996 0.0025 11 12 0.9997 0.9983 0.0014 0.9999 0.9984 0.0015 12 14 0.9983 0.9909 0.0074 0.9984 0.9954 0.0030 13 14 0.9738 0.9909 0.0175 1.0000 0.9954 0.0046 16 19 0.9836 0.9921 0.0085 0.9827 0.9924 0.009 17 18 1.0000 0.9997 0.0003 0.9996 0.9999 0.0003 17 23 1.0000 0.9997 0.0003 0.9996 0.9999 0.0003 17 21 1.0000 0.9997 0.0003 0.9996 0.9999 0.0003 19 20 0.9921 0.9947 0.0026 0.9924 0.9947 0.0023 20 22 0.9947 0.9898 0.0049 0.9947 0.9898 0.0049 20 23 0.9947 0.9997 0.0050 0.9947 0.9999 0.0052 23 25 0.9997 0.9981 0.0016 0.9999 0.9991 0.0008 12 26 0.9983 0.9945 0.0038 0.9984 0.9957 0.0027 19 26 0.9921 0.9945 0.0024 0.9924 0.9957 0.0033 26 27 0.9945 0.9997 0.0052 0.9957 0.9999 0.0042 5 28 0.9938 0.9997 0.0059 1.0000 0.9999 0.0001
International Journal of Emerging Technology and Advanced Engineering
Website: www.ijetae.com (ISSN 2250-2459,ISO 9001:2008 Certified Journal, Volume 4, Issue 1, January 2014)
[image:8.612.65.514.144.355.2]501
Figure 6: Graphical Representation of the Voltage with/without SVC
V. CONCLUSION
In this paper, the basic structure and model of Thyristor-Controlled-Reactor Fixed-Capacitor SVC were described. A single line diagram of the Nigerian 28-bus, 330kv power, system used for the study was also modeled and simulated without/with SVC. All the modeling and simulations were carried out in the SIMULINK/MALAB environment. From the simulation results and the resulting graph and bar chart, it was confirmed that SVC could be used to improve the voltage stability of power systems.
REFERENCES
[1] Abido M. A. 2009. Power System Stability Enhancement Using FACTS Controllers, The Arabian Journal for Science and Engineering, Volume 34, pp.153-172
[2] Banga A. and Kaushik S. S. 2011. Modeling and Simulation of SVC Controller for Enhancement of Power System Stability, International
Journal of Advances in Engineering and Technology, Vol. 1, pp.79-84
[3] Biswas M. M and Kamol K. D. 2011. Voltage Level Improving by Using Static VAR Compensator, Global Journal of researches in engineering, Volume 11,pp.12-18
[4] Conejo A. J., 2011, Load Flow Lecture, University of Castilla – La Mancha
[5] Nwohu M. N. 2009. Voltage Stability Improvement using Static Var Compensator in Power Systems, Leonardo Journal of Sciences, Issue 14, pp. 167-17
[6] Pabla A. S. 2004. Electric Power Distribution, 5th edition, Tata McGraw-Hill Publishing Company LTD, New Delhi
[7] Tarik A. and Teleke S. 2006. Modeling and Comparison of Synchronous Condenser and SVC, Thesis presented for Master Programme in Electric Power Engineering, Chalmers University of Technology 0 0.002 0.004 0.006 0.008 0.01 0.012 0.014 0.016 0.018 0.02 1_ 3 1_ 5 2_ 8 2_ 7 4_ 5 5_ 8 5_ 9 5_
10 6_8
7_ 24 8_ 14 8_ 10 8_ 24 9_ 10 15 _21 10 _17 11 _12 12 _14 13 _14 16 _19 17 _18 17 _23 17 _21 19 _20 20 _22 20 _23 23 _25 12 _26 19 _26 26
_27 5_28