MicroRNA expression profiling of human breast cancer identifies
new markers of tumor subtype
Cherie Blenkiron
¤
*†‡§
, Leonard D Goldstein
¤
*†¶
, Natalie P Thorne
*†¶
,
Inmaculada Spiteri
*†
, Suet-Feung Chin
*†
, Mark J Dunning
*†
,
Nuno L Barbosa-Morais
*†
, Andrew E Teschendorff
*†
, Andrew R Green
¥
,
Ian O Ellis
¥
, Simon Tavaré
*†¶
, Carlos Caldas
*†
and Eric A Miska
‡§
Addresses: *Cancer Research UK, Cambridge Research Institute, Li Ka-Shing Centre, Robinson Way, Cambridge CB2 0RE, UK. †Department of Oncology, University of Cambridge, Hills Road, Cambridge CB2 2XZ, UK. ‡Wellcome Trust/Cancer Research UK Gurdon Institute, University of Cambridge, The Henry Wellcome Building of Cancer and Developmental Biology, Tennis Court Rd, Cambridge CB2 1QN, UK. §Department of Biochemistry, University of Cambridge, Tennis Court Rd, Cambridge CB2 1GA, UK. ¶Department of Applied Mathematics and Theoretical Physics, University of Cambridge, Centre for Mathematical Sciences, Wilberforce Road, Cambridge CB3 0WA, UK. ¥Department of Histopathology, School of Molecular Medical Sciences, University of Nottingham, Nottingham NG5 1PB, UK.
¤ These authors contributed equally to this work.
Correspondence: Carlos Caldas. Email: [email protected]. Eric A Miska. Email: [email protected]
© 2007 Blenkiron et al.; licensee BioMed Central Ltd.
This is an open access article distributed under the terms of the Creative Commons Attribution License (http://creativecommons.org/licenses/by/2.0), which permits unrestricted use, distribution, and reproduction in any medium, provided the original work is properly cited.
microRNA expression profiling of human breast cancer
<p>Integrated analysis of miRNA expression and genomic changes in human breast tumors allows the classification of tumor subtypes.</ p>
Abstract
Background: MicroRNAs (miRNAs), a class of short non-coding RNAs found in many plants and
animals, often act post-transcriptionally to inhibit gene expression.
Results: Here we report the analysis of miRNA expression in 93 primary human breast tumors,
using a bead-based flow cytometric miRNA expression profiling method. Of 309 human miRNAs assayed, we identify 133 miRNAs expressed in human breast and breast tumors. We used mRNA expression profiling to classify the breast tumors as luminal A, luminal B, basal-like, HER2+ and normal-like. A number of miRNAs are differentially expressed between these molecular tumor subtypes and individual miRNAs are associated with clinicopathological factors. Furthermore, we find that miRNAs could classify basal versus luminal tumor subtypes in an independent data set. In some cases, changes in miRNA expression correlate with genomic loss or gain; in others, changes in miRNA expression are likely due to changes in primary transcription and or miRNA biogenesis. Finally, the expression of DICER1 and AGO2 is correlated with tumor subtype and may explain some of the changes in miRNA expression observed.
Conclusion: This study represents the first integrated analysis of miRNA expression, mRNA
expression and genomic changes in human breast cancer and may serve as a basis for functional studies of the role of miRNAs in the etiology of breast cancer. Furthermore, we demonstrate that bead-based flow cytometric miRNA expression profiling might be a suitable platform to classify breast cancer into prognostic molecular subtypes.
Published: 8 October 2007
Genome Biology 2007, 8:R214 (doi:10.1186/gb-2007-8-10-r214)
Received: 5 June 2007 Revised: 22 August 2007 Accepted: 8 October 2007 The electronic version of this article is the complete one and can be
Background
MicroRNAs (miRNAs) were discovered in Caenorhabditis elegans during studies of the control of developmental timing [1-5]. miRNAs are approximately 22-nucleotide non-coding RNAs that are thought to regulate gene expression through sequence-specific base-pairing with target mRNAs [6]. To date, thousands of miRNAs have been identified in organisms as diverse as roundworms, flies, fish, frogs, mammals, flower-ing plants, mosses, and even viruses, usflower-ing genetics, molecu-lar cloning and predictions from bioinformatics [7-16]. The human genome encodes at least 474 miRNA genes [17,18].
miRNAs are transcribed as long RNA precursors (pri-miR-NAs), which are processed in the nucleus by the RNase III enzyme complex Drosha-Pasha/DGCR8 to form the approxi-mately 70-base pre-miRNAs [19-23]. Pre-miRNAs are exported from the nucleus by Exportin-5 [24], processed by the RNase III enzyme Dicer, and incorporated into an Argo-naute-containing RNA-induced silencing complex (RISC) [25]. Within the silencing complex, miRNAs pair to the mes-sages of protein-coding genes, usually through imperfect base-pairing with the 3'-untranslated region (3'UTR), thereby specifying the post-transcriptional repression of these target mRNAs [6,26]. Binding of the silencing complex causes translational repression [27-29] and/or mRNA destabiliza-tion, which is sometimes through direct mRNA cleavage [30,31] but usually through other mechanisms [32-36].
The function of human miRNAs is largely unknown. How-ever, studies in roundworms, flies, fish and mice have demon-strated important roles for miRNAs in animal development [37]. miRNA target predictions suggest important roles for miRNAs in humans. Because many mRNAs have been under selective pressure to preserve pairing to a six nucleotide sequence in the 5' region of the miRNA known as the miRNA seed (nucleotides 2-7), targets of metazoan miRNAs can be predicted by searching for conserved matches to the seed region [38-42]. In humans, at least 10% of the protein-coding mRNAs might be conserved targets of miRNAs [38,39,41-49].
Despite their recent discovery, strong links between miRNAs and human cancer are emerging. Initial observations in roundworms and flies suggested possible connections between miRNAs and proliferation defects [50]. More recently, it was shown that the human miRNAs miR-15a and miR-16-1 map to a region on 13q14 that is often deleted in B-cell chronic lymphocytic leukemias (CLL) and that miR-15a and miR-16-1 are frequently deregulated in CLL patients [51]. A second study found that miR-143 and miR-145 expression levels were reduced in adenomatous and cancer stages of colorectal neoplasia [52]. Subsequently, a number of studies, using a range of techniques, including miRNA cloning, quan-titative PCR, microarrays and bead-based flow cytometric miRNA expression profiling [53-56], demonstrated that miRNA expression is deregulated in many human cancers.
A number of miRNAs were found to have oncogenic potential. For example, the mir-17 miRNA cluster cooperates with the oncogene Myc to induce tumors in a mouse model [57] and miR-372 and miR-373 were found to cooperate with RAS in an in vitro assay [58]. miRNAs might also act as tumor sup-pressors. For example, deregulation of the oncogene RAS and
HMGA2 by loss of regulation through the let-7 family of miR-NAs might contribute to human cancer [59-61]. It is unclear how miRNAs might be deregulated in cancer; however, it has been observed that many human miRNAs lie within cancer associated genomic regions, that is, areas of loss, gain or rear-rangement of the DNA in tumors [62]. However, transcrip-tional or post-transcriptranscrip-tional regulation of miRNAs in cancer has also been proposed [63,64].
The molecular classification of human tumors using mRNA microarray profiling is an area of intense research. A number of classifiers have been developed for human breast tumors, including the use of expression signatures as prognostic tools [65-75]. One of these classifiers can be used as a single sample predictor (SSP) to assign individual samples to one of five breast tumor subtypes: luminal A, luminal B, basal-like, HER2+ and normal breast-like [65,69,70,76].
Two recent studies have shown that a number of miRNAs are deregulated in human breast cancer [77,78]. A third study found that a number of miRNAs were differentially expressed in breast tumor biopsies and that miRNA expression corre-lated with HER2 and estrogen receptor (ER) status [79].
This study represents the first integrated analysis of miRNA expression, mRNA expression and genomic changes in human breast cancer and may serve as a basis for functional studies of the role of miRNAs in the etiology of breast cancer. Furthermore, we demonstrate that bead-based flow cytomet-ric miRNA expression profiling might be a suitable platform to classify breast cancer into prognostic molecular subtypes. This potential will need to be addressed in a prospective study.
Results
There are 133 miRNAs expressed in normal human breast and primary human breast cancer
human miRNAs based on the miRNA repository miRBase 8.1 [17,18]. miRNA labeling included RNA size selection using native polyacrylamide gels, ensuring that only mature miR-NAs were assayed.
Using this miRNA expression platform we analyzed a total of 137 samples in 168 assays. Assays for 119 of these 137 samples (87%) passed our quality control, including 93 primary tumor samples, 5 normal breast samples and 21 cell lines (Addi-tional data file 1). We detected the expression of 137 miRNAs in this sample set, 133 of which we detected in normal breast or breast tumors. We included a number of replicate probes and technical replicate samples and found that results were reproducible (Additional data files 5 and 6). For a subset of miRNAs and a subset of samples we also performed quantita-tive RT-PCR to independently assess miRNA expression (Additional data file 7). While there is generally good correla-tion between miRNA expression on both platforms, we do observe probe-specific differences. Sample quantity did not permit validation of miRNA expression using northern blot-ting; however, the bead-based flow-cytometric miRNA expression platform had been validated using northern blot-ting previously [56].
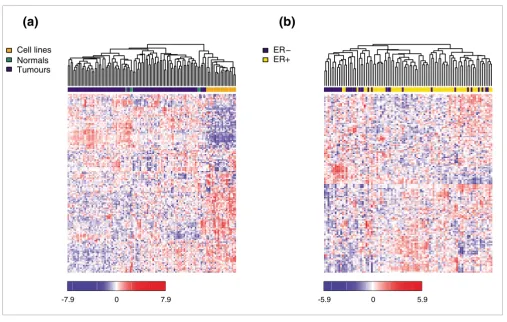
Unsupervised hierarchical clustering of miRNA expression clearly separated cell lines from both normal breast and tumor samples and suggested that miRNA expression in cell lines is largely deregulated (Figure 1a). We did not observe a perfect separation of normal and tumor samples, as has been described before for primary human tumors [56]. However, as our study was focused on tumor subtypes, we profiled only a small number of normal breast samples. As we found major differences in miRNA expression between primary human tissue and cell lines, we excluded cell lines from subsequent analyses. Unsupervised clustering of the tumor samples revealed striking differences in miRNA expression between ER- and ER+ tumors (Figure 1b).
MicroRNAs are differentially expressed between molecular breast tumor subtypes with clinical implications
Next we tested if miRNAs are differentially expressed among breast cancer subtypes. To identify the molecular subtypes of our tumor samples we used a single sample predictor (SSP), which classifies breast tumors into five subtypes: luminal A, luminal B, basal-like, HER2+ and normal-like [65,69,70,76]. In addition to differences in mRNA expression profiles, these
[image:3.612.52.559.365.687.2]Unsupervised hierarchical clustering (Pearson correlation, average linkage) over 137 detected miRNAs
Figure 1
Unsupervised hierarchical clustering (Pearson correlation, average linkage) over 137 detected miRNAs. Heatmap colors represent relative miRNA expression as indicated in the color key. (a) Clustering of 21 cell lines (orange), 5 normal breast samples (green) and 93 primary tumors (blue). (b) Clustering of 93 primary tumors with ER status as shown.
(b)
(a)
Cell lines Normals Tumours
ER− ER+
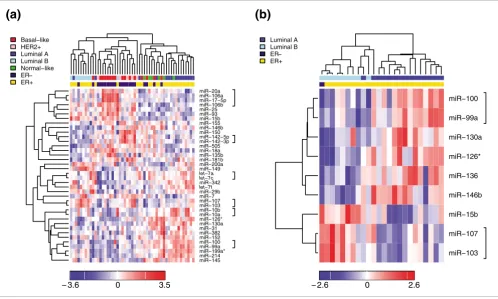
tumor subtypes also display distinct clinicopathological char-acteristics, including different survival rates (Additional data files 8 and 9). For example, the basal-like and HER2+ tumors are less differentiated and more aggressive and the luminal A and luminal B tumors are mostly ER+ with good and poor clinical outcome, respectively. Based on Agilent and Illumina mRNA expression data for 86 of our tumor samples [83] (unpublished results) we were able to classify 51 of the 93 tumor samples as 16 basal-like, 15 luminal A, 9 luminal B, 5 HER2+ and 6 normal-like tumors (Additional data file 1). miRNAs that were found to be differentially expressed in the tumor subtypes are shown in Figure 2a,b. miRNAs that are part of the same family show highly correlated expression. For example, the nine miRNAs that were found to be differen-tially expressed between luminal A and luminal B tumors rep-resent seven miRNA families (Figure 2b).
Given the large number of miRNAs differentially expressed between molecular subtypes, we investigated the predictive potential of miRNAs in an independent test set. Using all 137 expressed miRNAs, we performed a model-based discrimi-nant analysis [84] for the 16 basal-like and 15 luminal A tumors, the two largest subtype groups in our study
(Addi-tional data file 1). As we aimed to distinguish between molec-ular subtypes, we required a test set of samples with both miRNA and mRNA expression data available. The bead-based miRNA expression data in Lu et al. [56] included 11 breast tumor samples with corresponding Affymetrix gene expression data published in [56,85]. To our knowledge, no other studies with miRNA and mRNA data on breast tumor samples have been published. Based on the gene expression profiles and the SSP, six tumor samples could be assigned to molecular subtypes, three of which were classified as basal-like, two as luminal A and one as HER2+ (Additional data files 1, 14 and 19). Using the discriminator derived from our miRNA data, all three basal-like and two luminal A tumors in the independent miRNA data set were classified in concord-ance with their SSP molecular subtype classification.
A number of miRNAs are associated with clinicopathological factors
[image:4.612.56.554.87.386.2]We next assessed associations between individual miRNAs, molecular tumor subtypes and clinicopathological factors (Figure 3 and Additional data file 18). We tested for statisti-cally significant associations with tumor characteristics such as molecular subtype, grade, stage, vascular invasion, ER sta-Supervised hierarchical clustering over selected miRNAs (Pearson correlation, average linkage)
Figure 2
Supervised hierarchical clustering over selected miRNAs (Pearson correlation, average linkage). Heatmap colors represent relative miRNA expression as indicated in the color key for each panel. Brackets in the right margin indicate members of the same miRNA family. (a) Clustering of 51 tumor samples that could be classified as basal-like (red), HER2+ (pink), luminal A (dark blue), luminal B (light blue) or normal-like (green) over 38 miRNAs with Benjamini-Hochberg adjusted Kruskal-Wallis p < 0.05. (b) Clustering of 24 tumor samples classified as luminal A (dark blue) or luminal B (light blue) over 9 miRNAs with Benjamini-Hochberg adjusted Wilcoxon p < 0.05.
(b)
(a)
miR−145 miR−214 miR−199a* miR−99a miR−100 miR−152 miR−382 miR−31 miR−130a miR−126* miR−10a miR−10b miR−103 miR−107 miR−7 miR−29b
let−7f
miR−342
let−7c let−7a
miR−149 miR−200a miR−181b miR−135b miR−18a miR−505 miR−142−3p miR−142−5p miR−150 miR−146b miR−155 miR−15b miR−93 miR−25 miR−106b miR−17−5p miR−106a miR−20a Basal−like
HER2+ Luminal A Luminal B Normal−like ER− ER+
− 3.6 0 3.5
miR−103 miR−107 miR−15b miR−146b miR−136 miR−126* miR−130a miR−99a miR−100
Luminal A Luminal B ER− ER+
tus, Nottingham Prognostic Index (NPI) as well as TP53 status as determined by mutation screening and HER2 status assessed by immunohistochemistry (unpublished results). Figure 3 summarizes data for those 31 miRNAs and clinical factors for which there are significant associations at an adjusted p value less than 0.01 (Materials and methods). These 31 miRNAs represent 20 distinct miRNA families. Most of these miRNAs are expressed in the less aggressive, grade 1, ER+ samples. However, some miRNAs are expressed in the more aggressive grade 3/ER- tumors. We did not find any strong associations with stage, vascular invasion, NPI, TP53 or HER2 status.
Chromosomal loss or gain cannot explain the majority of changes in miRNA expression
Given the changes in miRNA expression we observed, it is important to ask how these changes come about. We first tested if the changes in miRNA expression are likely due to chromosomal loss, gain or amplification as inferred from array comparative genomic hybridization (CGH) data. For 82 of the 93 tumor samples we analyzed for miRNA expression, we performed array CGH analysis based on gene centric oli-gonucleotide microarrays [86,87]. For each miRNA locus that was identified as altered in any of the samples, we performed separate non-parametric Wilcoxon rank sum tests to assess differences in expression between samples with loss, gain or amplification compared to samples without changes.
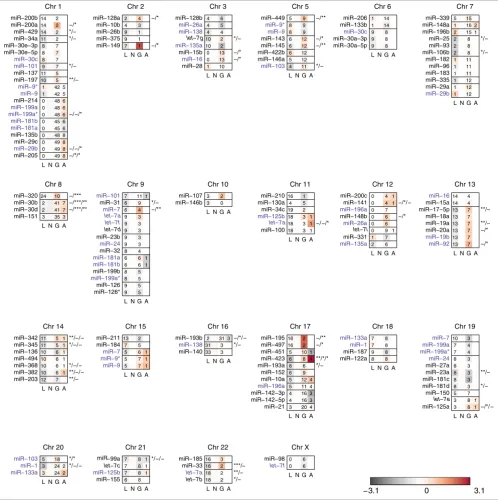
We found that in many cases expression differences could not be explained by any genome alterations detected by our array CGH data (Figure 4). The expression of 17 out of 129 mature miRNAs transcribed from genomic regions with an observed aberration correlated with genomic changes at 15 distinct chromosomal loci (p < 0.01). For miR-33 and miR-320, we found strong associations between miRNA expression and genomic alterations (p < 0.001), suggesting chromosomal change is a possible mechanism for mis-expression of these genes in primary human breast cancers. We also identified miRNA clusters whose changes in expression were correlated with copy number, for example, for miR-30b and miR-30d at C8q24.22 (p < 0.001) and miR-15b and miR-16-2 at C3q26.1 (p < 0.05).
Expression of clustered miRNAs is coordinated
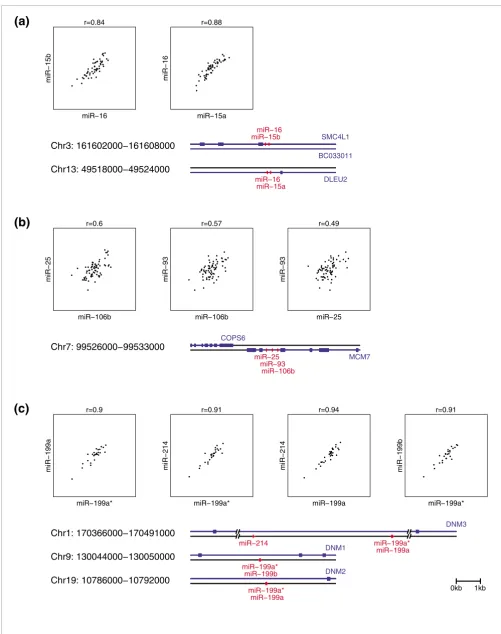
We noticed that miRNA clusters are often expressed coordi-nately in our sample set. For example, miR-106b, miR-93 and miR-25 situated on C7q22.1 are highly expressed in high-grade tumors. To further examine this phenomenon, we cal-culated the pairwise Pearson correlation of expression between miRNAs on the same chromosome and strand. We observed an abrupt drop in correlation of miRNA expression for pairs of miRNAs that were more than 50 kb apart (Addi-tional data file 12). These observations agree well with what has been observed earlier in human tissue samples [88]. We therefore used a distance of 50 kb as a cut-off to identify 56 intergenic or gene-resident spatial clusters, 44 of which are Association of individual miRNAs and tumor subtype or
[image:5.612.54.298.82.555.2]clinicopathological factors
Figure 3
Association of individual miRNAs and tumor subtype or
clinicopathological factors. Shown are 31 miRNAs and three factors with at least one association at adjusted p < 0.01. Differential expression was assessed by a non-parametric Wilcoxon rank sum test for comparison between two groups or a non-parametric Kruskal-Wallis test for comparison between multiple groups. To address the issue of multiple testing for the same factor, p values were adjusted by Benjamini and Hochberg's method [102]. Heatmap colors represent relative miRNA expression as shown in the color key. The expression values for a given sample group of interest were summarized by their mean. Brackets in the left margin indicate members of the same miRNA family. Significance levels are shown in the right margins: * adjusted p < 0.05; ** adjusted p < 0.01; *** adjusted p < 0.001. Abbreviations for subtype: B, basal-like; H, HER2+; LA, luminal A; LB, luminal B; N, normal-like.
miR−150 miR−142−3p miR−142−5p miR−148a miR−106a miR−106b miR−18a miR−93 miR−155 miR−25 miR−187 miR−135b miR−126* miR−136 miR−100 miR−99a miR−145 miR−10a miR−199a miR−199a* miR−199b miR−130a miR−30a−3p miR−30a−5p miR−224 miR−214
let−7a let−7b
let−7c let−7f
miR−342
** ** *
* * ** * ** *
** **
** ** * **
*
**
* *
* * **
*** ** ** **
** * ** ** ** **
* ** ** ** ** * ** ** ** ** ** ** ** ** ***
*
** *** ** ***
**
** ** ** **
** *** ** *** *
*** * ** ***
*
Subtype ER Grade
B H LA LB N − + 1 2 3
represented in the set of 137 miRNAs detected in our sample set. Interestingly, 26 of 31 clusters for which expression data from multiple stem-loop regions were available show
[image:6.612.56.554.87.586.2]corre-lated expression with r > 0.4 (Figure 5 and Additional data file 13). For example, the miR-15 and miR-16 family are expressed from two clusters at chromosomes 3q and 13q, Association of miRNA expression and DNA copy number
Figure 4
Association of miRNA expression and DNA copy number. miRNAs mapping to regions of genomic aberration were plotted according to chromosome and genomic location. Heatmap colors represent relative miRNA expression as shown in the color key. Expression values for samples with genomic loss (L), unaltered samples (N), samples with genomic gain (G) and amplification (A) were summarized by their mean, respectively, with numbers of samples as indicated. miRNAs transcribed from multiple loci are indicated in blue. Adjacent miRNAs not separated by a black line are less than 50 kb apart. Significance levels correspond to unadjusted p values obtained by a non-parametric Wilcoxon rank sum test (* p < 0.05, ** p < 0.01, *** p < 0.001). Given the high dependence of the performed tests, p values were not adjusted for multiple testing.
Chr 1 miR−200b miR−200a miR−429 miR−34a miR−30e−3p miR−30e−5p miR−30c miR−101 miR−137 miR−197 miR−9* miR−9 miR−214 miR−199a miR−199a* miR−181b miR−181a miR−135b miR−29c miR−29b miR−205 14 14 14 11 8 8 8 9 11 10 1 1 0 0 0 0 0 0 0 0 0 2 2 2 2 7 7 7 7 5 5 42 42 48 48 48 45 45 48 49 49 49 5 5 6 6 6 6 6 8 8 8 8 −/* */− */− */− **/− −/−/* −/−/* −/*/* L N G A
Chr 2 miR−128a miR−10b miR−26b miR−375 miR−149 2 4 9 9 7 4 3 1 1 1 −/* −/* L N G A
Chr 3 miR−128b miR−26a miR−138 let−7g miR−135a miR−15b miR−16 miR−28 4 4 4 10 10 0 0 1 6 5 4 2 2 13 13 10 */− −/* −/* L N G A
Chr 5 miR−449 miR−9* miR−9 miR−143 miR−145 miR−422b miR−146a miR−103 5 8 8 6 6 6 5 4 9 9 9 12 12 12 12 11 −/** −/* −/** */− L N G A
Chr 6 miR−206 miR−133b miR−30c miR−30a−3p miR−30a−5p 1 1 9 9 9 14 14 8 8 8 L N G A
Chr 7 miR−339 miR−148a miR−196b miR−25 miR−93 miR−106b miR−182 miR−96 miR−183 miR−335 miR−29a miR−29b 5 1 2 2 2 2 1 1 1 1 1 1 15 16 15 8 8 8 11 11 11 12 12 12 2 1 */− */−
L N G A
Chr 8 miR−320 miR−30b miR−30d miR−151 24 2 2 3 10 41 41 35 7 7 3 −/*** −/***/** −/***/** L N G A
Chr 9 miR−101 miR−31 miR−7 let−7a let−7f let−7d miR−23b miR−24 miR−32 miR−181a miR−181b miR−199b miR−199a* miR−126 miR−126* 7 6 6 9 9 9 9 9 8 6 6 8 8 9 9 11 9 4 3 3 3 3 3 4 6 6 5 5 5 5 1 1 1 */− −/**
L N G A
Chr 10 miR−107 miR−146b 3 3 2 0
L N G A
Chr 11 miR−210 miR−130a miR−34c miR−125b let−7a miR−100 16 4 19 18 18 18 1 5 2 3 3 3 1 1 1 −/−/* L N G A
Chr 12 miR−200c miR−141 miR−196a miR−148b miR−26a let−7i miR−331 miR−135a 0 0 0 0 0 0 1 2 4 4 7 6 6 9 7 6 1 1 1 −/*/− −/*
L N G A
Chr 13 miR−16 miR−15a miR−17−5p miR−18a miR−19a miR−20a miR−19b miR−92 14 14 13 13 13 13 13 13 4 4 7 7 7 7 7 7 **/− **/− −/* −/* L N G A
Chr 14 miR−342 miR−345 miR−136 miR−494 miR−368 miR−382 miR−203 11 11 10 10 10 10 12 5 5 6 6 6 6 7 1 1 1 1 1 1 **/−/− */−/− */−/− **/−/− **/− L N G A
Chr 15 miR−211 miR−184 miR−7 miR−9* miR−9 13 7 5 5 5 2 5 6 7 7 1 1 1
L N G A
Chr 16 miR−193b miR−138 miR−140 2 31 33 31 3 3 3−/*/− */− L N G A
Chr 17 miR−195 miR−497 miR−451 miR−423 miR−193a miR−152 miR−10a miR−196a miR−142−3p miR−142−5p miR−21 16 16 5 6 8 6 5 5 4 4 3 2 2 10 8 6 9 12 11 16 16 20 1 1 4 4 3 3 4 −/** −/* **/*/* */−
L N G A
Chr 18 miR−133a miR−1 miR−187 miR−122a 7 7 9 8 8 8 8 8 L N G A
Chr 19 miR−7 miR−199a miR−199a* miR−24 miR−27a miR−23a miR−181c miR−181d miR−150 let−7e miR−125a 10 7 7 8 8 8 8 8 5 3 3 3 4 4 3 3 3 3 3 7 8 8 1 1 **/− */− −/*/− L N G A
Chr 20 miR−103 miR−1 miR−133a 5 3 3 18 24 24 2 2 */* */−/− L N G A
Chr 21 miR−99a let−7c miR−125b miR−155 7 7 7 6 8 8 8 8 1 1 1 */−/−
L N G A
Chr 22 miR−185 miR−33 let−7a let−7b 16 16 18 18 3 2 2 2 ***/− **/− */− L N G A
Chr X miR−98 let−7f 0 0 6 6 L N G A
which are both highly correlated (r > 0.8). In many cases these correlations are likely due to shared regulatory elements or polycistronic expression of several miRNAs from a single primary transcript [88].
A number of miRNA genes are co-regulated as part of larger domains
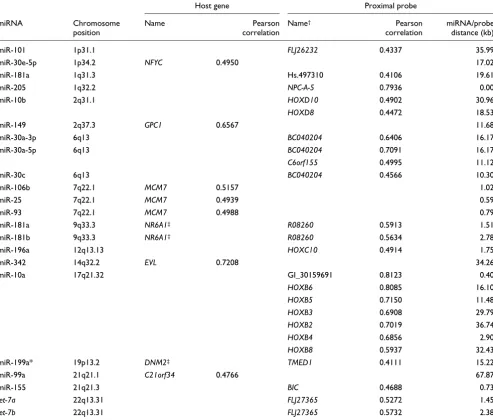
Since only 17 of the 137 miRNAs expressed in our samples showed changes in their expression associated with detected chromosomal abnormalities, changes in miRNA expression may be due to changes in transcription of primary miRNA transcripts. We showed above that miRNA clusters are expressed coordinately. We therefore asked if expression lev-els of miRNAs that are intronic are correlated with the expression of their host gene, as this suggests changes in pri-mary transcription rates. To test this hypothesis, we com-pared miRNA expression data with Illumina mRNA expression data for our tumor sample set (unpublished results; Additional data file 13). We only detected correlations for seven miRNA host gene pairs (r > 0.4), suggesting that changes in miRNA expression in our tumor sample set are not generally linked to host gene expression (Table 1). These seven miRNA host gene pairs were miR-30e-5p/NFYC, miR-149/GPC1, miR-25/93/106b/MCM7, miR-342/EVL and miR-99a/C21orf34.
For miRNA genes that are intergenic, we performed a similar comparison using the most proximal probes (within 50 kb) from the Illumina platform as these probes might correspond to primary miRNA transcripts (Additional data file 13). Only 23 out of 243 miRNA/proximal probe pairs at 11 distinct loci correlated in expression (r > 0.4; Table 1). Some of these miR-NAs have proximal probes that are very close and likely rep-resent primary miRNA transcripts. For example, miR-205 expression is highly correlated with the proximal probe for transcript NPC-A-5 (r > 0.75). One striking example of corre-lated expression of miRNAs and proximal probes was miR-10a, which is part of the HOXB cluster (C17q21.32), where Illumina probe data suggest the co-regulation of a region from HOXB2 to HOXB6 including miR-10a (Table 1).
Some changes in miRNA expression may be due to changes in miRNA biosynthesis
As genomic changes and transcriptional regulation of miRNA expression do not explain the changes in miRNA expression
we observed in human breast cancers, post-transcriptional regulation of miRNA expression has to be considered. Indeed, recent studies suggested that primary miRNA processing might be deregulated in human cancer [64,89,90]. Therefore, we tested whether genes required for miRNA bio-genesis are differentially expressed in our breast cancer samples. As we found many changes in miRNA expression across the five clinical tumor subtypes we had defined above (Figure 2), we asked whether DICER1, DROSHA, DGCR8,
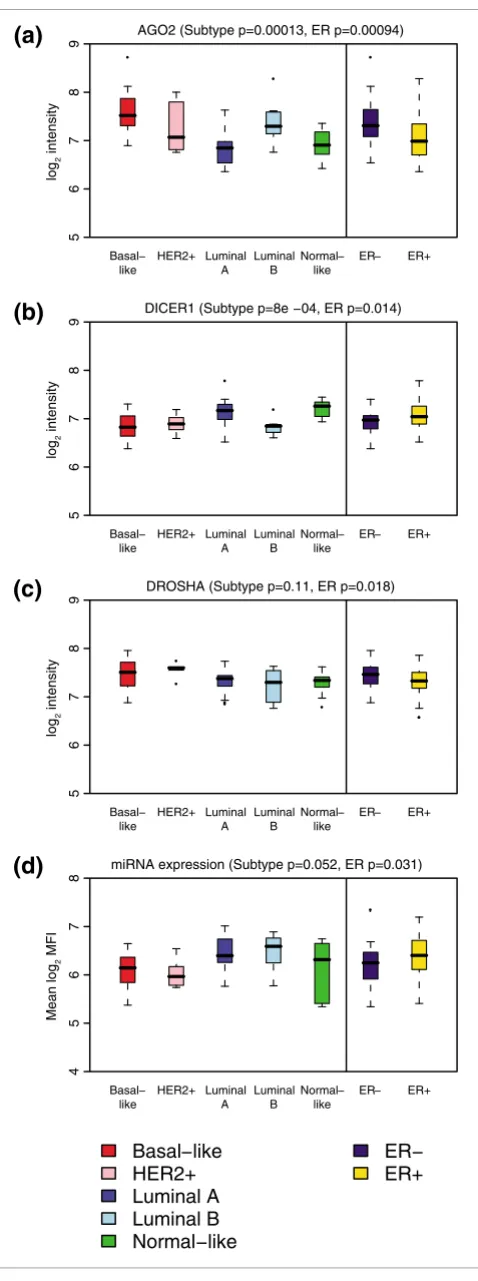
AGO1, AGO2, AGO3 or AGO4 expression differs among these subgroups. We found significant changes in the expression of
DICER1 (p < 0.001), which was low in the more aggressive basal-like, HER2+ and luminal B type tumors, and AGO2, which was high in basal-like, HER2+ and luminal B type tumors (Figure 6). We did not find significant changes in the expression of DROSHA, DGCR8, or any of the other AGO
genes (Figure 6 and Additional data file 10). We also observed significant changes in AGO2, DICER1 and DROSHA expres-sion in relation to ER status, with AGO2 and DROSHA being higher and DICER1 lower in ER- tumor samples (Figure 6).
The observed deregulation of genes required for miRNA bio-genesis may be expected to lead to global changes in miRNA expression. To further investigate this possibility, we utilized an alternative approach to between-sample normalization. For the analyses described previously, sample median center-ing proved advantageous in removcenter-ing technical variation between samples without changing trends in differential expression (Additional data files 1 and 4). However, this method necessarily removed any global changes in miRNA expression. Using an alternative normalization based on spike-in controls, similar to the method described in [56], we detected small differences in mean miRNA levels according to ER status with lower mean miRNA expression in ER- tumors (Figure 6d).
Discussion
Using an innovative bead-based miRNA expression profiling method we have determined the expression profile for 309 miRNAs in primary human breast cancer. We found that miRNA expression classified molecular tumor subtypes. Fur-thermore, a number of individual miRNAs were associated with clinicopathological factors. Changes in miRNA expression were complex and were likely due to genomic loss
Expression of clustered miRNAs is coordinated
Figure 5 (see following page)
Figure 5 (see legend on previous page) Chr3: 161602000−161608000 SMC4L1 miR−15b miR−16 BC033011 Chr13: 49518000−49524000 DLEU2 miR−16 miR−15a ●● ● ● ● ● ● ● ● ● ● ● ● ● ● ● ● ● ● ● ● ● ● ● ● ● ● ● ● ● ● ● ● ● ● ● ● ● ● ●● ● ● ● ● ● ● ● ● ● ● ● ● ● ● r=0.84 miR−16 miR − 15b ●● ● ● ● ● ● ● ● ●● ● ● ● ● ● ●● ● ● ● ● ● ● ● ● ● ● ● ● ● ● ● ● ● ● ● ● ● ● ● ● ● ● ● ● ● ● ● ● ● ● ● ● ● r=0.88 miR−15a miR − 16 Chr7: 99526000−99533000 COPS6 MCM7 miR−25 miR−93 miR−106b ●● ● ● ● ● ● ● ● ● ● ● ● ● ● ● ● ● ● ● ● ● ● ● ● ● ● ● ● ● ● ● ● ● ● ● ● ● ● ● ● ● ● ● ● ● ● ● ● ● ● ● ● ● ● ● ● ● ● ● ● ● ● ● ● ●● ● ● ● ● ● r=0.6 miR−106b miR − 25 ●● ● ● ● ● ● ● ● ● ● ● ● ● ● ● ● ● ● ● ● ● ● ● ● ● ● ● ● ● ● ●● ● ● ● ● ●● ● ● ● ● ● ● ● ● ● ● ● ● ● ● ● ● ● ● ● ● ● ● ● ● ● ● ● ● ● ● ● ● ● r=0.57 miR−106b miR − 93 ●● ● ● ● ● ● ● ● ● ● ● ● ● ● ● ● ● ● ● ● ● ● ● ● ● ● ● ● ● ● ●● ● ● ● ● ● ● ● ● ● ● ● ● ● ● ● ● ● ● ● ● ● ● ● ● ● ● ● ● ●● ● ● ● ● ● ● ● ●● r=0.49 miR−25 miR − 93 Chr1: 170366000−170491000
miR−214 miR−199a*
or gain, transcriptional and post-transcriptional regulation and changes in the expression of miRNA biogenesis enzymes. This study forms the basis for developing miRNA expression signatures as diagnostic tools for breast cancer and also fur-thers our understanding of the role of miRNAs in tumorigenesis.
Two previous studies of miRNA expression in human breast cancer have focused on comparing normal tissues to tumor samples. Here we focused on miRNA expression analysis of a large set of primary human tumors to reveal signatures of tumor subtype. Nevertheless, we also identified 7 out of 24 miRNAs that had previously been associated with breast can-cers compared to normal tissues [78] (Additional data file 18).
[image:9.612.57.550.126.546.2]In addition, we can confirm three of 26 miRNAs that were reported in a separate study [77]. Notably, one miRNA, miR-155, is differentially expressed in ER- versus ER+ tumors (Figure 3), overexpressed in breast tumors compared to nor-mal controls [77,78] and additionally other tumor types, sug-gesting that this miRNA may have diagnostic potential beyond breast cancer [54,91-93]. More recently, a quantita-tive RT-PCR study of miRNA expression from breast cancer biopsies revealed that miRNA expression classifies ER status [79], which is in agreement with our observations (Figure 1b). Surprisingly, we found little agreement among miRNAs we identified as being associated with clinicopathological factors and miRNAs identified in this context in a previous study [77].
Table 1
MicroRNA/proximal probe correlations
Host gene Proximal probe
miRNA Chromosome position
Name Pearson correlation
Name† Pearson
correlation
miRNA/probe distance (kb)
miR-101 1p31.1 FLJ26232 0.4337 35.99
miR-30e-5p 1p34.2 NFYC 0.4950 17.02
miR-181a 1q31.3 Hs.497310 0.4106 19.61
miR-205 1q32.2 NPC-A-5 0.7936 0.00
miR-10b 2q31.1 HOXD10 0.4902 30.96
HOXD8 0.4472 18.53
miR-149 2q37.3 GPC1 0.6567 11.68
miR-30a-3p 6q13 BC040204 0.6406 16.17
miR-30a-5p 6q13 BC040204 0.7091 16.17
C6orf155 0.4995 11.12
miR-30c 6q13 BC040204 0.4566 10.30
miR-106b 7q22.1 MCM7 0.5157 1.02
miR-25 7q22.1 MCM7 0.4939 0.59
miR-93 7q22.1 MCM7 0.4988 0.79
miR-181a 9q33.3 NR6A1‡ R08260 0.5913 1.51
miR-181b 9q33.3 NR6A1‡ R08260 0.5634 2.78
miR-196a 12q13.13 HOXC10 0.4914 1.75
miR-342 14q32.2 EVL 0.7208 34.26
miR-10a 17q21.32 GI_30159691 0.8123 0.40
HOXB6 0.8085 16.10
HOXB5 0.7150 11.48
HOXB3 0.6908 29.79
HOXB2 0.7019 36.74
HOXB4 0.6856 2.90
HOXB8 0.5937 32.43
miR-199a* 19p13.2 DNM2‡ TMED1 0.4111 15.22
miR-99a 21q21.1 C21orf34 0.4766 67.87
miR-155 21q21.3 BIC 0.4688 0.73
let-7a 22q13.31 FLJ27365 0.5272 1.45
let-7b 22q13.31 FLJ27365 0.5732 2.38
We showed that a large number of miRNAs in our data set are associated with molecular subtypes, and we explored the pre-dictive potential of miRNAs in an independent test set. A model-based discriminant analysis of our training set of 31 basal-like and luminal A samples resulted in the classification of 5 samples from an independent study that was in accord-ance with gene expression-based molecular subtype classifi-cation. Although these results are promising, the test set is too small to allow for a sensible performance assessment of the classifier. However, there are currently no other breast tumor data sets with both mRNA and miRNA expression data pub-licly available that would allow further validation of miRNA-based molecular subtype classification.
If miRNA expression profiles classify primary breast tumor subtypes, they may prove useful as diagnostic tools in the future and this could be assessed in a prospective study. Bead-based array miRNA profiling may be particularly well suited to assay miRNA expression in large-scale diagnostic trials since it is a high-throughput and cost-effective method [56,94]. If miRNAs prove useful for clinical breast cancer diagnosis, they have the additional advantage that, in contrast to most mRNAs, they are long-lived in vivo [35] and very stable in vitro [95], which might be critical in a clinical setting and allow analysis of paraffin-embedded samples.
[image:10.612.56.295.83.724.2]We found that the differences in miRNA expression we observed are likely not due to genomic loss or gain (Figure 4). Therefore, we investigated the regulation of miRNA expres-sion at the transcriptional and post-transcriptional level (Fig-ure 5, Table 1). As previously described for normal human tissues [88], we found that the majority of miRNA clusters are co-regulated in human breast tumors. These data are also in agreement with similar observations made in human leuke-mia samples [96] and support the hypothesis that changes in miRNA expression in human cancer may not be distinct from normal tissue-specific miRNA expression in humans. In some instances, miRNA expression also correlates with host gene expression in the case of intronic miRNAs, or with the expression of larger domains, such as the HOXB cluster Figure 6
? ●
? ●
? ●
56789
AGO2 (Subtype p=0.00013, ER p=0.00094)
log
2
intensity
Basal− HER2+ Luminal Luminal Normal− ER− ER+
like A B like
? ●
? ●
56789
DICER1 (Subtype p=8e −04, ER p=0.014)
log
2
intensity
Basal− HER2+ Luminal Luminal Normal− ER− ER+
like A B like
? ● ? ●
●●
? ●
●●
56789
DROSHA (Subtype p=0.11, ER p=0.018)
log
2
intensity
Basal− HER2+ Luminal Luminal Normal− ER− ER+
like A B like
?
4567
8 miRNA expression (Subtype p=0.052, ER p=0.031)
Mean log
2
MFI
Basal− HER2+ Luminal Luminal Normal− ER− ER+
like A B like
Basal−like HER2+ Luminal A Luminal B Normal−like
ER− ER+
(a)
(b)
(c)
(d)
Genes required for miRNA biogenesis are differentially expressed according to molecular subtype and ER status
Figure 6
Genes required for miRNA biogenesis are differentially expressed according to molecular subtype and ER status. Shown are boxplots of Illumina log2 intensities for (a) AGO2 (EIF2C2), (b) DICER1, (c) DROSHA
(Table 1 and Additional data file 13). In these instances, miRNA expression appears to be mainly under transcrip-tional control.
However, in many cases we observe that miRNA expression is not correlated with host genes or primary miRNA transcripts, suggesting post-transcriptional regulation of miRNA expres-sion. Regulation of miRNA expression at the level of DRO-SHA has previously been proposed for human cancer [64,90]. We found that DICER1 expression is significantly downregu-lated in the more aggressive basal-like, HER2+ and luminal B type tumors. Interestingly, a recent study showed that down-regulating DICER1 expression promotes tumorgenesis in vitro and in a mouse lung cancer model [97]. Together, these data suggest that DICER1 deregulation might be involved in the etiology of human breast cancer. In addition, we find that the deregulation of genes in the miRNA biogenesis pathway that we observed is in agreement with a number of independ-ent data sets [98] (Additional data file 11).
Although both mRNA and miRNA expression profiles were found to be informative with regard to tumor subtype, their functional relationship remains unclear. In particular, we were interested to discover if changes in miRNA expression may correlate with changes in mRNA levels of direct targets (Additional data file 1). We considered miRNA families with identical seed (nucleotides 2-7) and mRNAs with conserved seed complementarity in their 3'UTR (Targetscan 3.1) [38]. A number of miRNA families showed differential expression between subtypes for their mean expression profile. We could detect only a few instances of enrichment for down- or up-regulation of predicted target mRNAs consistent with changes in miRNA expression, although previous studies of normal human tissue did observe such an enrichment [45,99]. However, these data are consistent with the hypo-thesis that many miRNAs act at the level of translation rather than mRNA stability.
Conclusion
To date, many studies of miRNA expression in human cancer have focused only on the deregulation of miRNA expression. Here we integrated the analysis of miRNA expression, mRNA expression and DNA copy number in human breast cancer. Based on a combined analysis of miRNA and mRNA expres-sion data we have identified a number of miRNAs that are dif-ferentially expressed between molecular tumor subtypes. In addition, we identified candidate miRNAs that are regulated at the genomic, transcriptional and likely post-transcriptional levels in breast cancer using miRNA, mRNA and array CGH data. Using mRNA expression data, we also found that the expression of genes in the miRNA biogenesis pathway is deregulated in breast cancer. We suggest that further analysis of integrated data sets might help to unravel miRNA-depend-ent pathways in human breast cancer.
Materials and methods
Sample collection
Primary breast tumor specimens were obtained with appro-priate ethical approval from the Nottingham Tenovus Pri-mary Breast Cancer Series (Nottingham City Hospital Tumor Bank, Nottingham, UK). All cases were primary operable invasive breast carcinomas collected from 1990 to 1996. Clin-ical information, including therapy, has been published pre-viously [80-83,87].
RNA extraction and labeling
RNA was extracted from primary tumors and cell lines using a standard Trizol (Invitrogen, Carlsbad, CA, USA) protocol, modified by washing the final RNA pellet with 80% EtOH. Frozen tumors were sectioned on a cryostat prior to homogenization in Trizol. RNA quantity and quality were assessed by Nanodrop (Nanodrop Technologies, Wilmington, DE, USA) and Agilent 2100 bioanalyzer (Agilent Technolo-gies, Santa Clara, CA, USA), respectively.
miRNAs were extracted from 5 μg of sample total RNA using denaturing PAGE. Briefly, samples were spiked with three synthetic pre-labeling control RNAs (5'- pCAGUCAGUCAGU-CAGUCAGUCAG-3', 5'-pGACCUCCAUGUAAACGUACAA-3', 5'-pUUGCAGAUAACUGGUACAAG-3'; Dharmacon, Lafay-ette, CO, USA) to control for target preparation efficiency, at 3 fmoles/sample. After purification of 18-26 bp RNAs, adap-tors were ligated at the 3' and 5' ends using T4 RNA ligase (Fermentas, Burlington, OT, CA), a RNA-DNA hybrid 5'-pUUUaaccgcgaattccagt-idT-3' (Dharmacon; X = RNA, x = DNA, p = phosphate, idT = inverted [3'-3' bond] deoxythymi-dine) was ligated to the 3' end and 5'-acggaattcctcactAAA-3' (Dharmacon) was ligated to the 5' end using T4 RNA ligase. These bi-ligated products underwent reverse transcription using an adaptor specific primer (M37, 5'-pTACTGGAAT-TCGCGGTTA-3') and then amplified and labeled using PCR (M37 and M33, 5'-biotin-CAACGGAATTCCTCACTAAA-3'). Amplification was performed on an Eppendorf thermal cycler at 95°C for 30 s, 50°C for 30 s and 72°C for 40 s for 18 cycles. PCR products were precipitated without glycogen and redis-solved in 66 μl 1 × TE buffer containing 1 μl of three bioti-nylated post labeling controls (100 fmols each, FVR506, PTG20210, MRC677).
Bead coupling and hybridization
tetramethylammonium chloride, 0.15% sarkosyl, 75 mM Tris-HCl pH 8.0, 6 mM EDTA). Samples were hybridized in a 96-well format with two water-only blanks and at least three bead blanks containing water instead of the labeled sample for use as a background control. We included replicate probes and technical replicate samples across bead sets and sample plates, respectively, to aid quality control and data preproc-essing. Hybridization was carried out overnight at 50°C with 33 μl of the bead pool and 15 μl of labeled sample.
Unbound sample was removed from beads by washing with 1 × TE and re-suspending in 1× TMAC buffer. SAPE, streptavi-din-phycoerythrin, premium grade (Invitrogen) was added to the beads (1:100 dilution) and incubated for 10 minutes at 50°C to bind to biotin moieties on the cDNA. Samples were processed on a Luminex 100 machine and median fluores-cence intensity values acquired using the StarStation software (ACS, Sheffield, UK).
Computational analysis
Preprocessing
Median fluorescence intensity values smaller than a thresh-old of 1 were set equal to 1, and all values were transformed by taking logs (base 2). Samples with low mean expression were excluded from further analyses (Additional data files 1 and 3). To reduce noise due to absent probes, each probe was required to exceed a log2 median fluorescence intensity value of 6 in at least one sample. Systematic probe effects were median-corrected (Additional data files 1 and 2). Replicate probes were summarized by their mean profile and samples were centered to have zero median. Technical replicate sam-ples were summarized by their mean profile. For a more detailed description of preprocessing please see Additional data file 1.
Genomic annotation
miRNA probe sequences were matched against stem-loop sequences in miRBase (release 8.1). Genomic miRNA clusters were identified by requiring any two stem-loops on the same chromosome and strand within 50 kb to belong to the same clusters (Additional data file 16). A miRNA was defined as gene-resident if its stem-loop is completely contained in the locus of a gene transcript on the same chromosomal strand as annotated in the Known Genes and RefSeq Genes tables obtained from the UCSC Genome Browser (hg18) [100] (Additional data file 17).
Illumina gene expression data
Illumina gene expression data were processed and summa-rized in the Illumina BeadStudio software. Analyses of the probe level data were performed using the beadarray Bio-conductor package [101]. After quality control, between-array qspline normalization was performed for 112 arrays for 99 samples. Replicate arrays were averaged and expression val-ues were transformed by taking logs (base 2).
Subtype classification
Each array in the preprocessed Illumina and Agilent [83] gene expression data set was normalized to have zero mean and standard deviation one, and each probe was centered to have zero median. An SSP annotation for Agilent probes was provided in [76]. Detailed information on the SSP annotation for Illumina probes can be found in Additional data files 1 and 15. Multiple probes for the same UniGene cluster ID in either data set were summarized by their median profile. Samples were then assigned to the nearest subtype centroid as deter-mined by Spearman correlation, requiring a minimum corre-lation of 0.3. Samples that could be assigned to subtypes based on both Agilent and Illumina expression profiles were classified according to the Illumina assignment (Additional data file 1).
Hierarchical clustering
Prior to hierarchical clustering, miRNA profiles were stand-ardized to have mean zero and standard deviation one. Clus-tering was performed with average linkage and Pearson correlation.
Supervised analyses
Differential expression was assessed by a non-parametric Wilcoxon rank sum test for comparison between two groups or a non-parametric Kruskal-Wallis test for comparison between multiple groups. To address the issue of multiple testing for the same contrast, adjusted p values were obtained by Benjamini and Hochberg's method [102].
Copy-number-driven expression
For each miRNA stem-loop identified as gained, lost or amplified in any of the samples, separate non-parametric Wilcoxon rank sum tests were performed to assess differ-ences in expression between samples with genomic changes and unaltered samples [103]. P values were not adjusted for multiple testing due to the high level of dependence between the performed tests.
Coexpression of proximal miRNAs and Illumina probes
For a given chromosome and strand, pairwise Pearson corre-lation coefficients were calculated for all miRNA probes and those Illumina probes mapping to a host gene or within 50 kb of a miRNA stem-loop. To account for coexpression caused by DNA copy number changes, correlation coefficients for probe pairs were calculated using only those samples with available array CGH data showing no evidence for aberration at either locus (Additional data file 1).
Abbreviations
CGH, comparative genomic hybridization; ER, estrogen receptor; miRNA, microRNA; NPI, Nottingham Prognostic Index; SSP, single sample predictor.
Authors' contributions
CB, CC and EAM conceived and designed the study. ARG and IOE provided breast cancer samples and clinical information. CB, IS and SC performed the experiments under the supervi-sion of CC and EAM. The statistical analysis and experimental design were conducted by LDG and supervised by NPT. ST and AET provided statistical advice. MD preprocessed the Illumina gene expression data. NLBM provided the Illumina probe annotation. CB, LDG, NPT, ST, CC and EAM wrote the manuscript.
Additional data files
The following additional data are available with the online version of this paper. A detailed description of the computa-tional analysis carried out is given in addicomputa-tional data file 1 and a layout of the experimental design is shown in additional data file 2. Additional data on miRNA expression analysis can be found in additional data file 3 (pre-processing), additional data file 4 (normalization), additional data file 5 (replicate probes), additional data file 6 (replicate samples) and addi-tional data file 7 (qRT-PCR validation). Addiaddi-tional data file 8 contains a mRNA expression heatmap for 82 classified sam-ples and 75 intrinsic genes, and additional data file 9 contains a pairwise comparison of Kaplan-Meier survival curves for 74 classified samples with available follow up data. Additional data on differential expression of miRNA processing genes can be found in additional data file 10 (this data set) and addi-tional data file 11 (other data sets). Addiaddi-tional data file 12 shows the correlation of proximal miRNA probes and addi-tional data file 13 shows correlations between miRNA probes and Illumina probes. Additional data file 14 shows a model-based discriminant analysis for Basal-like and Luminal A tumors. Additional data file 15 contains annotation for the intrinsic gene probe set (single sample predictor). Additional data file 16 lists spatial miRNA clusters, additional data file 17 lists host gene coordinates of intragenic miRNAs and additional data file 18 associations between individual miR-NAs, molecular tumor subtypes and clinicopathological fac-tors. Additional data file 19 contains the intrinsic gene probe sets used for the model-based discriminant analysis. Additional data file 1
Supplementary Notes
This file contains a detailed description of the computational analyis.
Click here for file Additional data file 2
Layout of the experimental design
A. Data matrix of miRNA expression values (schematic). The 333 rows and 168 columns correspond to probes and samples respec-tively. Expression values for each sample were obtained from hybridizations to four distinct bead sets (with approximately 90 probes each), carried out in separate wells of 96-well plates. Hybridizations were performed on eight plates, using two plates for each bead set. The allocation of samples between the two plates for a given bead set was kept consistent for all four bead sets. Thus both probes and samples could be ordered according to the plate of ori-gin, partitioning the data matrix into eight blocks corresponding to measurements from distinct plates. Expression values for a repre-sentative well on plate 1 for beadset 1 are indicated in grey. B. Heat-map of unnormalized log2 MFI values for all miRNA probes and all
samples. Probes were median centred prior to plotting. C. Heatmap of differences between the probe median for the randomized sam-ples on a given plate and the probe median for all samsam-ples on both plates.
Click here for file Additional data file 3
Preprocessing of miRNA expression data
A. Histograms of log2 MFI values obtained from wells containing
sample material (white) and blank control wells (blue). B. The number of detected probes after filtering was plotted against a range of cutoff values. Probes were removed (filtered) if they did not exceed the chosen cutoff (red) in at least one sample. C, D. Sam-ple quality control. Pearson correlation coefficients for technical replicate samples were plotted against the smaller of the two sam-ple means for (C) cell line technical replicate samsam-ples and (D) nor-mal and tumor technical replicate samples. The cutoff used for quality control is indicated by a vertical line. Colours correspond-ing to sample status are explained in the colour key. E. Technical sample effects. Pairwise differences between the medians of techni-cal replicate samples were plotted for unnormalized data (black), data normalized based on spike-in controls (blue) and data nor-malized by sample median centering (red). Dashed lines indicate the maximum difference between the medians of any two samples for unnormalized data (black) and for data normalized using spike-in controls (blue).
Click here for file Additional data file 4
Between-sample normalization
Between-sample normalization. A. Shown are data normalized based on spike-in controls for the same miRNAs and factors as in Figure 3 in the main text. B. miRNAs and factors with at least one association at adjusted p < 0.01 based on data normalized using spike-in controls. All miRNAs thus identified were also identified after sample median centering with the exception of miR-152, which was found to be associated with all three factors at p < 0.05 (Additional data file 18). Heatmap colours reflect relative miRNA expression. The expression values for a given sample group of interest were summarized by their mean. Brackets in the left mar-gin indicate members of the same miRNA family. Significance lev-els are indicated in the right margins: * adjusted p < 0.05, ** adjusted p < 0.01, *** adjusted p < 0.001. Abbreviations for sub-type: B = Basal-like, H = HER2+, LA = Luminal A, LB = Luminal B, N = Normal-like.
Click here for file Additional data file 5 Replicate probes
Pairwise scatter plots of replicate probes after sample quality con-trol, probe filtering and within-plate probe correction (none of the replicated probes were removed due to probe filtering). Scatter plots for one failed probe (miR-224-4) are marked in red. Click here for file
Additional data file 6 Technical replicate samples
Pairwise scatter plots of technical replicate samples after sample quality control, probe filtering, within-plate probe correction and summarizing replicate probes.
Click here for file Additional data file 7 qRT-PCR validation
Normalized log2 MFI values were plotted against log2-transformed
and median-corrected measurements obtained by qRT-PCR Click here for file
Additional data file 8
Gene expression heatmap for 82 classified samples and 75 of the 80 intrinsic genes
Expression values are based on Illumina data when available, and Agilent data otherwise. The two data sets were normalized as described. Missing values in the Agilent data are indicated in white. Samples were ordered according to molecular subtype (see colour key). The heatmap does not present a hierarchical clustering but merely illustrates differences in gene expression. A. Luminal/ER+ gene cluster. B. ERBB2 and GRB7-containing cluster. C. Inter-feron-regulated cluster including STAT1. D. Basal epithelial clus-ter. E. Proliferation clusclus-ter.
Click here for file Additional data file 9
Pairwise comparison of Kaplan-Meier survival curves
Pairwise comparison of Kaplan-Meier survival curves for 74 classi-fied samples with available follow up data (21 Basal-like, 7 HER2+, 25 Luminal A, 10 Luminal B, 11 Normal-like). A non-parametric log rank test was used to assess differences in clinical outcome. Click here for file
Additional data file 10
miRNA processing genes show differential expression according to subtype, and ER status
Shown are boxplots of log2 expression for DGCR8, DICER1,
DRO-SHA (RNASEN), AGO1 (EIF2C1), AGO2 (EIF2C2), AGO3 (EIF2C3) and AGO4 (EIF2C4). The data were obtained for 58 samples classi-fied according to subtype (17 Basal-like, 5 HER2+, 18 Luminal A, 8 Luminal B, 10 Normal-like) and 99 samples with known ER status (31 ER-, 68 ER+). We only included Illumina probes not mapping to introns and which could be detected at log2 expression 6 in at
least one sample. Differential expression was assessed using a non-parametric Kruskal-Wallis test (subtype) and Wilcoxon rank sum test (ER status).
Click here for file Additional data file 11
miRNA processing genes show differential expression according to ER status in publicly available data sets
Shown are boxplots of normalized gene expression units for each candidate gene that showed differential expression (Student's t-test p < 0.001). Data were obtained from the cancer microarray database ONCOMINE [98], and differential expression was assessed using Student's t-test. Each row of plots corresponds to a unique gene; data obtained from different studies are separated by a solid vertical black line. For each data set the number of ER neg-ative (blue) and ER positive (yellow) samples is included in the lower figure margin. The first authors of the relevant publications are included in the plot title.
Click here for file Additional data file 12
Correlation of proximal miRNAs
Pearson correlation coefficients for mature miRNAs mapping to the same chromosome and strand were plotted against decreasing ranks of pairwise distances. Diamonds represent a moving average over five correlation coefficients. The absolute distance is plotted in blue and indicated on the right y-axis. Distance 50 kb is indicated by a vertical red line.
Click here for file Additional data file 13
Correlation of miRNA and Illumina probes
Heatmap of Pearson correlation coefficients (accounting for DNA copy number changes as described) between miRNA probes and selected Illumina probes on the same chromosome and strand. Blank entries are due to missing DNA copy number information. Probes are arranged in genomic order. Black boxes indicate clus-ters of adjacent probes less than 50 kb apart. Green boxes indicate clusters of probes mapping to the same host gene. Mature miRNAs included in multiple stem-loops are indicated in blue. Relative genomic probe positions are marked as white bars on the chromo-somal plot below each heatmap.
Click here for file Additional data file 14
Model-based discriminant analysis for Basal-like and Luminal A tumors
SSP molecular subtype classification based on the Affymetrix gene expression data for normal breast and breast tumor samples in [56,85]. Spearman correlations with the five subtype centroids are shown for all 14 samples. The solid horizontal black line indicates the minimum correlation required for subtype assignment. If the minimal correlation with a subtype centroid was achieved, the clas-sification was made using the centroid with highest Spearman cor-relation. B. Shown are class posterior probabilities for 16 Basal-like and 15 Luminal A tumors in the training set (using all detected 138 miRNAs); and three Basal-like and two Luminal A tumors in the test set (using the 77 detected miRNAs in common with the training set). Red and blue indicate the posterior probability of belonging to the Basal-like and Luminal A subtype respectively. Plotting charac-ters indicate the gene expression based subtype classification with squares and triangles representing Basal-like and Luminal A sam-ples respectively. Samsam-ples were assigned to the class with posterior probability greater than 0.5 (solid horizontal black line).
Click here for file Additional data file 15
Intrinsic genes, probe sets (single sample predictor) Intrinsic genes, probe sets (single sample predictor) Click here for file
Additional data file 16 Spatial miRNA clusters Spatial miRNA clusters Click here for file Additional data file 17
Host gene coordinates of intragenic miRNAs Host gene coordinates of intragenic miRNAs Click here for file
Additional data file 18
Associations between individual miRNAs, molecular tumor sub-types and clinicopathological factors
Associations between individual miRNAs, molecular tumor sub-types and clinicopathological factors
Click here for file Additional data file 19
Intrinsic genes, probe sets (model-based discriminant analysis) Intrinsic genes, probe sets (model-based discriminant analysis) Click here for file
Acknowledgements
This work was funded by grants from Cancer Research UK to CC, ST and EAM. CB was supported by the UK National Translation Cancer Research Network (NTRAC) and LDG was supported by an EPSRC fellowship. ST is a Royal Society-Wolfson Research Merit Award holder. We would like to thank the Tissue Bank, City Hospital, Nottingham, UK for human breast samples. We thank Sarah Hyland for her work on the TP53 mutation screen and John Marioni for useful discussions on the analysis. We would
like to thank the reviewers for exceptionally helpful comments on the manuscript.
References
1. Ambros V, Horvitz HR: Heterochronic mutants of the nema-tode Caenorhabditis elegans. Science 1984, 226:409-416. 2. Lee RC, Feinbaum RL, Ambros V: The C. elegans heterochronic
gene lin-4 encodes small RNAs with antisense complementa-rity to lin-14. Cell 1993, 75:843-854.
3. Wightman B, Ha I, Ruvkun G: Posttranscriptional regulation of the heterochronic gene lin-14 by lin-4 mediates temporal pattern formation in C. elegans. Cell 1993, 75:855-862. 4. Reinhart BJ, Slack FJ, Basson M, Pasquinelli AE, Bettinger JC, Rougvie
AE, Horvitz HR, Ruvkun G: The 21-nucleotide let-7 RNA regu-lates developmental timing in Caenorhabditis elegans. Nature 2000, 403:901-906.
5. Chalfie M, Horvitz HR, Sulston JE: Mutations that lead to reiter-ations in the cell lineages of C. elegans. Cell 1981, 24:59-69. 6. Bartel DP: MicroRNAs: genomics, biogenesis, mechanism,
and function. Cell 2004, 116:281-297.
7. Arazi T, Talmor-Neiman M, Stav R, Riese M, Huijser P, Baulcombe DC: Cloning and characterization of micro-RNAs from moss. Plant J 2005, 43:837-848.
8. Axtell MJ, Bartel DP: Antiquity of microRNAs and their targets in land plants. Plant Cell 2005, 17:1658-1673.
9. Lagos-Quintana M, Rauhut R, Lendeckel W, Tuschl T: Identification of novel genes coding for small expressed RNAs. Science 2001, 294:853-858.
10. Lau NC, Lim LP, Weinstein EG, Bartel DP: An abundant class of tiny RNAs with probable regulatory roles in Caenorhabditis elegans. Science 2001, 294:858-862.
11. Lee RC, Ambros V: An extensive class of small RNAs in Caenorhabditis elegans. Science 2001, 294:862-864.
12. Lim LP, Glasner ME, Yekta S, Burge CB, Bartel DP: Vertebrate microRNA genes. Science 2003, 299:1540.
13. Llave C, Kasschau KD, Rector MA, Carrington JC: Endogenous and silencing-associated small RNAs in plants. Plant Cell 2002, 14:1605-1619.
14. Reinhart BJ, Weinstein EG, Rhoades MW, Bartel B, Bartel DP: Micro-RNAs in plants. Genes Dev 2002, 16:1616-1626.
15. Watanabe T, Takeda A, Mise K, Okuno T, Suzuki T, Minami N, Imai H: Stage-specific expression of microRNAs during Xenopus development. FEBS Lett 2005, 579:318-324.
16. Pfeffer S, Zavolan M, Grasser FA, Chien M, Russo JJ, Ju J, John B, Enright AJ, Marks D, Sander C, Tuschl T: Identification of virus-encoded microRNAs. Science 2004, 304:734-736.
17. Griffiths-Jones S, Grocock RJ, van Dongen S, Bateman A, Enright AJ: miRBase: microRNA sequences, targets and gene nomenclature. Nucleic Acids Res 2006, 34:D140-144.
18. Griffiths-Jones S: The microRNA Registry. Nucleic Acids Res 2004, 32:D109-111.
19. Denli AM, Tops BB, Plasterk RH, Ketting RF, Hannon GJ: Processing of primary microRNAs by the Microprocessor complex. Nature 2004, 432:231-235.
20. Gregory RI, Yan KP, Amuthan G, Chendrimada T, Doratotaj B, Cooch N, Shiekhattar R: The Microprocessor complex medi-ates the genesis of microRNAs. Nature 2004, 432:235-240. 21. Han J, Lee Y, Yeom KH, Kim YK, Jin H, Kim VN: The
Drosha-DGCR8 complex in primary microRNA processing. Genes Dev 2004, 18:3016-3027.
22. Landthaler M, Yalcin A, Tuschl T: The human DiGeorge syn-drome critical region gene 8 and its D. melanogaster homolog are required for miRNA biogenesis. Curr Biol 2004, 14:2162-2167.
23. Lee Y, Ahn C, Han J, Choi H, Kim J, Yim J, Lee J, Provost P, Radmark O, Kim S, Kim VN: The nuclear RNase III Drosha initiates microRNA processing. Nature 2003, 425:415-419.
24. Lund E, Guttinger S, Calado A, Dahlberg JE, Kutay U: Nuclear export of microRNA precursors. Science 2004, 303:95-98. 25. Du T, Zamore PD: microPrimer: the biogenesis and function of
microRNA. Development 2005, 132:4645-4652.
26. Pillai RS: MicroRNA function: multiple mechanisms for a tiny RNA? Rna 2005, 11:1753-1761.