International Journal of Emerging Technology and Advanced Engineering
Website: www.ijetae.com (ISSN 2250-2459,ISO 9001:2008 Certified Journal, Volume 3, Issue 12, December 2013)
674
Analysis of Clusters Generated on mushroom data using
Artificial Neural Networks
Dr T. Anuradha
11Associate Professor, Department of Computer Science, Dravidian University, Kuppam
Abstract—In this paper, an attempt is made to analyze a mushroom data set (available from the UCI data repository) to identify different combinations of attributes that are significant in grouping the mushroom data as poisonous or edible. For generation of clusters Kohonen Self-Organizing Feature Maps are used. Clusters are generated on all attributes of the data, and by observing these clusters; some different combinations of attributes are considered for further analysis. Clusters are generated on these combinations of attributes. These clusters are compared with the clusters generated using all attributes in terms of the clustering error.
Keywords—Data Mining, Clustering, Artificial Neural Networks and Mushroom data
I. INTRODUCTION
Data Mining, which is a step in the KDD process, consists of applying data analysis and discovery of algorithms that, under acceptable computational efficiency limitations, produce a particular enumeration of patterns over the data [2]. Some of the primary data mining methods are association rules, classification and prediction, clustering, sequence discovery, and outlier detection, etc.
Classification, which is also, referred to as supervised learning, builds a model by analyzing a training data set that has class labels. Then, the model is used to classify unlabeled future data.
Clustering is the process of grouping physical or abstract objects into classes, so that objects in the same group or class are more similar to each other than objects in different groups [5]. It is referred to as unsupervised learning [9], because it does not use any data labels for grouping of objects.
II. INTRODUCTION TO ARTIFICIAL NEURAL NETWORKS
Artificial neural networks (ANN) have been used extensively over the past three decades for both classification and clustering [7].
The Artificial Neural Network (ANN) is an information processing paradigm inspired by the way the human brain processes information. ANN consists of a large number of highly interconnected processing elements (nodes) that are tied together with weighted connections (links). Learning in biological systems involves adjustments to the synaptic connections that exist between the neurons.
This is true for ANN as well. Learning typically occurs by example through training, or exposure to a set of input/output data (pattern) where the training algorithm adjusts the link weights.
In [4], [3], learning in the context of neural network is defined as ―Learning is a process by which the free parameters of a neural network are adapted through a process of simulation by the environment in which the network is embedded. The type of learning is determined by the manner in which the parameter changes take place‖.
Well-known examples of ANNs used for clustering include Kohonen’s learning vector quantization and self-organizing map (SOM) [8] and adaptive resonance theory models [1]. Self organizing feature maps (SOFM) - also called Kohonen feature maps are a special kind of neural networks that can be used for clustering tasks.
The Kohonen network model consists of two layers of neurons or units, an input layer and an output layer. The input layer is fully connected to the output layer, and each connection has an associated weight. Another way to think of the network structure is to think of each output layer having an associated center, represented as a vector of inputs to which it most strongly responds (where each element of the center vector is a weight from the output unit to the corresponding input unit).
In a Kohonen model, the parameters are represented as weights between input units and output units, or alternatively, as a cluster center associated with each output unit. Input records are presented to the network, and the cluster centers are updated in a manner similar to that used in building a k-means model, with an important difference: the clusters are arranged spatially in a two-dimensional grid, and each record affects not only the cluster to which it is assigned but also clusters within a neighborhood about the winning unit.
International Journal of Emerging Technology and Advanced Engineering
Website: www.ijetae.com (ISSN 2250-2459,ISO 9001:2008 Certified Journal, Volume 3, Issue 12, December 2013)
675 These clusters are compared with the clusters generated using all attributes in terms of the clustering error.
III. CLUSTERS GENERATION ON MUSHROOM DATA SET
AND THE ANALYSIS OF THE CLUSTERS GENERATED
A mushroom data set available from the UCI data repository is considered for implementing the Kohonen self-organizing feature maps. This data set includes descriptions of hypothetical samples corresponding to 23 species of gilled mushrooms in the Agaricus and Lepiota family. Each species is identified as definitely edible, definitely poisonous or of unknown edibility and not recommended. This latter case is combined with poisonous one. In the following, the attributes of the data set and their values are given in parentheses.
A.Mushroom Data Set Description
Cap-shape (bell, conical, convex, flat, knobbed, sunken); Cap-surface (fibrous, grooves, scaly, smooth); Cap-color (brown, buff, cinnamon, gray, green, pink, purple, red, white, yellow); Bruises(true, false); Odour (almond, anise, creosote, fishy, foul, musty, none, pungent, spicy); gill-attachment (attached, descending, free, notched); Gill-spacing (close, crowded, distant); Gill-size (broad, narrow); Gill-color (black, brown, buff, chocolate, gray, green, orange, pink, purple, red, white, yellow); stalk-shape (enlarging, tapering); stalk-root (bulbous, club, cup, equal, rhizomorphs, rooted, missing); stalk-surface-above-ring (fibrous, scaly, silky, smooth); stalk-surface-below-ring (fibrous, scaly, silky, smooth); stalk-color-above-ring (brown, buff, cinnamon, gray, orange, pink, red, white, yellow); stalk-color-below-ring (brown, buff, cinnamon, gray, orange, pink, red, white, yellow); Veil-type (partial, universal); Veil-color (brown, orange, white, yellow); Ring-number (none, one, two); Ring-type (cobwebby, evanescent, flaring, large, none, pendant, sheathing, zone); spore-print-color (black, brown, buff, chocolate, green, orange, purple, white, yellow); Population (abundant, clustered, numerous, scattered, several, solitary); Habitat (grasses, leaves, meadows, paths, urban, waste, woods); Class (edible, poison).This data set contains 8,124 instances, of which 4,208 instances are edible and 3,916 are poisonous.
This data set is analyzed to identify different combinations of attributes that are significant in grouping the mushroom data as poisonous or edible.
For this purpose, clusters are generated on all attributes
of the data, and by observing these clusters, some different combinations of attributes are considered for further analysis. Clusters are generated on these combinations of attributes.
These clusters are compared with the clusters generated using all attributes in terms of the clustering error.
For the analysis of the clustered data, Clementine 12.0 visualization tools that can plot graphs in two dimensions and three dimensions are used. With these tools two-dimensional graphs are plotted to display different attributes and their values that identify mushroom data as edible or poisonous.
[image:2.612.331.561.142.255.2]B.Generation of Clusters on all Attributes of the Data Set Clusters are generated by applying Kohonen maps on all attributes of the mushroom data set and are given in Figure-1
Figure 1 - Clusters generated on all attributes of mushroom data set
Clusters mapped to (0,0), (0,2), (1,2), (2,0), (3,0), (3,1), (4,0), and (4,2) coordinates are pure clusters. These pure clusters are observed, and the following combinations of the attributes are considered to analyze whether they are significant in clustering the data as edible or poisonous.
Gill-size, bruises, stalk-shape and ring-type
Brushes and odor
Cap-shape and odor
Stalk-root, ring-type, and population.
C. Generation of Clusters on the Attributes Gill-size, Bruises, Stalk-shape and Ring-type
International Journal of Emerging Technology and Advanced Engineering
Website: www.ijetae.com (ISSN 2250-2459,ISO 9001:2008 Certified Journal, Volume 3, Issue 12, December 2013)
[image:3.612.66.287.134.243.2]676
Figure 2 Clusters Generated On Gill-Size, Bruises, Stalk-Shape, And Ring-Type
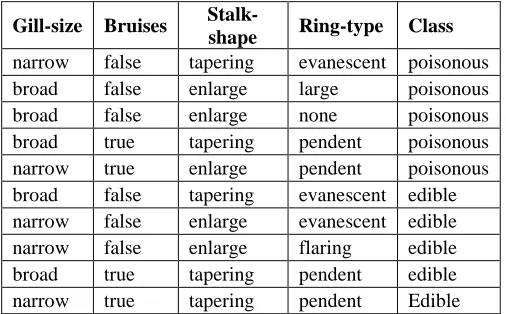
[image:3.612.66.276.343.443.2] [image:3.612.42.295.503.660.2]A two-dimensional graph that shows the values of the attributes gill-size, bruises, stalk-shape, and ring-type, that identify a mushroom instance as edible or poisonous is plotted for each value of ring-type. This graph is shown in Figure 3
Figure 3 - Graph plotted among gill-size, bruises, stalk-shape, ring-type, and class
Table I
Tabular Representation of Figure 3
From Table 1 the following conditions are identified for the poisonous state of the mushroom
Gill-size = narrow and bruises = false and stalk-shape = tapering. This condition is satisfied by 1728 instances of the mushroom data set.
Gill-size = broad and bruises = false and stalk-shape = enlarge and (ring-type = large or ring-type = none). This condition is satisfied by 1,332 instances.
Gill-size = narrow and bruises = true and stalk-shape = enlarge. This condition is satisfied by 264 instances of mushroom data.
Totally 3,324 instances satisfy the above condition.The following conditions are identified for the edible state of the mushroom data set.
Gill-size = broad and bruises = false and stalk-shape = tapering. This condition is satisfied by 768 instances.
Gill-size = normal and bruises = true and stalk-shape = tapering. This condition is satisfied by 96 instances.
Totally, 864 instances satisfy the two condition mentioned. Similar experiments are done on other combinations of attributes and are as given below.
D.Generation of Clusters on the Attributes Bruises and Odour
Clusters generated using the attributes bruises and odour using Kohonen maps is given in Figure 4.
Figure 4 Clusters generated using bruises and odour
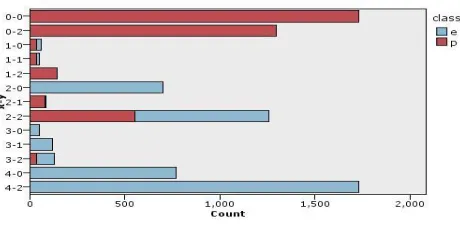
A graph that shows the relationship between bruises and class is plotted for different values of odour, and it is given in Figure 5.
Gill-size Bruises
Stalk-shape Ring-type Class
[image:3.612.341.555.505.603.2]International Journal of Emerging Technology and Advanced Engineering
Website: www.ijetae.com (ISSN 2250-2459,ISO 9001:2008 Certified Journal, Volume 3, Issue 12, December 2013)
[image:4.612.67.272.126.238.2]677
Figure 5 Graph plotted among bruises, odor and class
From the graph in Figure 5, the values of the attributes bruises and odour are identified for the edibility and poisonous-ness of mushrooms and they are given in the Table 2.
From Table 2, attributes and their values the condition odor = almond or odor = anise is satisfied by 800 instances in the whole data set as edible. The condition that odor = creosote or odor = foul odor = musty or odor = pungent or odor = spicy or odor = fishy totally identify 3,540 instances in the whole data set as poisonous.
TABLE II
TABULAR REPRESENTATION OF FIGURE 5
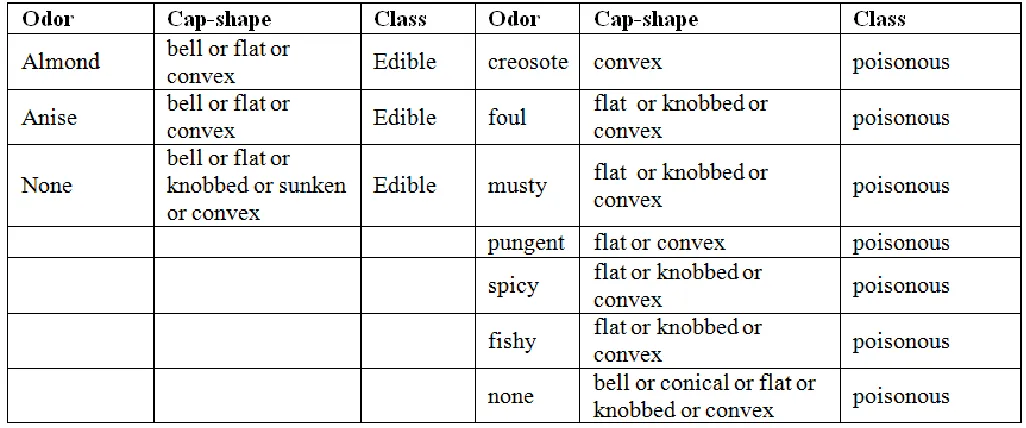
E.Generation of Clusters on Attributes Cap-shape and Odor
[image:4.612.324.560.191.282.2]Attributes cap-shape and odor is also considered to generate clusters and the clusters generated are given in Figure 6.
Figure 6 Clusters generated using cap-shape and odor
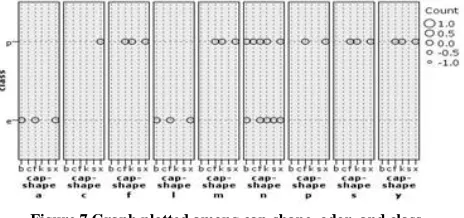
[image:4.612.331.563.339.448.2]To analyze these clusters, a graph is plotted on attributes cap-shape and class for different value of the attribute odor and it is given in Figure 7.
Figure 7 Graph plotted among cap-shape, odor, and class
International Journal of Emerging Technology and Advanced Engineering
Website: www.ijetae.com (ISSN 2250-2459,ISO 9001:2008 Certified Journal, Volume 3, Issue 12, December 2013)
678
TABLE III
TABULAR REPRESENTATION OF FIGURE 7
From Table 3, the following conditions are identified for the class edibility of mushrooms:
(Cap-shape = bell or cap-shape = flat or cap-shape = convex) and (odor = almond or odor = anise). This condition is satisfied by 800 instances in the whole data set.
Cap-shape = sunken and odor = none is satisfied by 32 records.
The following conditions are identified for mushroom state being poisonous:
(Cap-shape = flat or shape = knobbed or cap-shape = convex) and (odor = foul or odor = musty or odor = spicy or odor = fishy).
This condition is stratified by 3,348 instances in the whole data set.
Cap-shape = convex and odor = creosote is satisfied by 192 instances.
(Cap-shape = flat or cap-shape = covex) and odor = pungent. This condition is same as odor = pungent. This condition is satisfied by 256 instances in the entire data set.
Cap-shape = conical and odor = none. This condition is satisfied by 4 instances of the entire data set.
Thus, the condition that (odor = foul or odor = musty or odor = spicy or odor = fishy or odor = pungent or odor = creosote) and (cap-shape = convex and odor = none) identify 3,800 records as poisonous.
F. Generation of Clusters on Attributes Stalk-root, Ring-type, and Population
[image:5.612.59.572.149.363.2]Another set of attributes stalk-root, ring-type, and population is considered to generate clusters, and the clusters generated are given in Figure 8.
Figure 8 Clusters generated using stalk-root, ring-type and population.
[image:5.612.330.561.491.625.2]International Journal of Emerging Technology and Advanced Engineering
Website: www.ijetae.com (ISSN 2250-2459,ISO 9001:2008 Certified Journal, Volume 3, Issue 12, December 2013)
[image:6.612.54.288.132.268.2]679
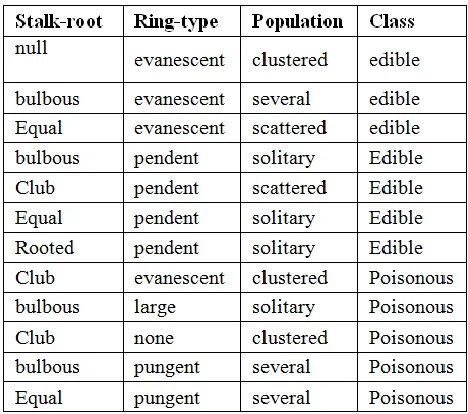
Figure 9 graph plotted among stalk-root, ring-type, population and class.
The details of the graph in Figure 9 are represented in Table 4.
TABLE IV
TABULAR REPRESENTATION OF FIGURE 9
From the Table 4, the following conditions are identified for the edibility of mushrooms.
(Stalk-root = bulbous or root = equal or stalk-root = stalk-rooted) and ring-type = pendent and population = solitary. This condition is satisfied by 1040 instances in the whole data set.
Stalk-root = null and ring-type = evanescent and population = clustered. This condition is satisfied by only one record.
Stalk-root = bulbous and ring-type = evanescent and population = several. This condition is satisfied by 48 instances in the whole data set.
Stalk-root = equal and ring-type = evanescent and population = scattered. This condition is satisfied by 384 instances.
All the above conditions identify 1473 records as edible. The following are the conditions identified for the poisonous state of the mushroom:
Stalk-root = club and (ring-type = evanescent or ring-type = none) and population = clustered, and this is satisfied by 44 instances.
Ring-type = large or ring-type = none. This condition is satisfied by 1,332 instances.
Thus, totally, 1,346 poisonous instances satisfy the above conditions. So, the attributes stalk-root, ring-type, and population are significant in grouping mushrooms data. Different numbers of clusters are generated using these attributes and their clustering accuracies are computed and compared with that of clustering accuracies of clusters generated using all attributes.
IV. COMPARISON OF CLUSTERING ACCURACIES
When the true labels are present, the clustering accuracies for measuring the clustering results can be computed. Clustering accuracies can be defined as
r =
n
a
k
i i
1
.
Where n is the number of objects in the data set, k is the number of clusters, and ai is the number of objects with the
class label that dominates cluster i. clustering error is computed as 1-r [6].
[image:6.612.51.285.352.559.2]International Journal of Emerging Technology and Advanced Engineering
Website: www.ijetae.com (ISSN 2250-2459,ISO 9001:2008 Certified Journal, Volume 3, Issue 12, December 2013)
[image:7.612.54.565.126.334.2]680
Figure 10 comparison of clustering errors
For these combinations of attributes, the error rate reaches almost 0.05 when the number of clusters reaches twenty four.
V. CONCLUSIONS
In this paper kohonen neural network is implemented. mushroom data set available from UCI repository is used to generate clusters. Different combinations of attributes are identified as significant to determine the state of mushroom as edible, or poisonous.
REFERENCES
[1] Carpenter G and Grossberg S ―ART3: Hierarchical search using
chemical transmitters in self-organizing pattern recognition architectures.‖ Neural networks 3, 129-152 1990.
[2] U. Fayyad, G. Piatetsky-Shapiro. and P. Smyth. ―From Data Mining
to Knowledge Discovery in Databases‖. American Association for Artificial Intelligence, 1996.
[3] Simon Haykin, ―Neural netwoks and learning machines‖, 3rd edition,
Printice Hall o India, 2008.
[4] Simon Haykin, ―Neural networks : A comprehensive foundation‖,
2nd edition, Printice Hall PTR, USA, 1998.
[5] Jiawei Han and Micheline Kamber ―Data Mining concepts and
techniques‖ 2nd edition Morgan Kaufmann publishers, An imprint of
Elsevier 2001
[6] Zengyon He, Xiaofei Xu, and Shenchum Deng, ― Improvinging
categorical data clustering algorithms by weighting uncommon attribute value matches‖, ComSIS Vol.3, No. 1, June 2006. [7] Jain. A.K. and Mao.J ―Artifical neural networks a tutorial‖ IEEF
computer 29, pages 31-44, March 1996.
[8] Kohonen T 1989 Self-Organizing and Associative memory 3rd ed.
Springer information sciences series. Springer –Verlag, Newyork NY.