A c o g ni tiv e f r a m e w o r k fo r t h e
c a t e g o ri s a ti o n of a u d i t o r y o bj e c t s
i n u r b a n s o u n d s c a p e s
Woo d c o c k , JS, D a vi e s, WJ a n d C ox, TJ
h t t p :// dx. d oi.o r g / 1 0 . 1 0 1 6 /j. a p a c o u s t . 2 0 1 7 . 0 1 . 0 2 7
T i t l e
A c o g n i tiv e fr a m e w o r k fo r t h e c a t e g o r i s a tio n of a u d i t o r y
o bj e c t s in u r b a n s o u n d s c a p e s
A u t h o r s
Woo d c o c k, JS, D avi e s, WJ a n d C ox, TJ
Typ e
Ar ticl e
U RL
T hi s v e r si o n is a v ail a bl e a t :
h t t p :// u sir. s alfo r d . a c . u k /i d/ e p ri n t/ 4 1 2 9 6 /
P u b l i s h e d D a t e
2 0 1 7
U S IR is a d i gi t al c oll e c ti o n of t h e r e s e a r c h o u t p u t of t h e U n iv e r si ty of S alfo r d .
W h e r e c o p y ri g h t p e r m i t s , f ull t e x t m a t e r i al h el d i n t h e r e p o si t o r y is m a d e
f r e ely a v ail a bl e o nli n e a n d c a n b e r e a d , d o w nl o a d e d a n d c o pi e d fo r n o
n-c o m m e r n-ci al p r iv a t e s t u d y o r r e s e a r n-c h p u r p o s e s . Pl e a s e n-c h e n-c k t h e m a n u s n-c ri p t
fo r a n y f u r t h e r c o p y ri g h t r e s t r i c ti o n s .
A cognitive framework for the categorisation of auditory objects in urban
soundscapes
J. Woodcock
⇑, W.J. Davies, T.J. Cox
Acoustics Research Centre, University of Salford, Salford, Greater Manchester M5 4WT, United Kingdom
a r t i c l e i n f o
Article history:
Received 18 August 2016
Received in revised form 23 January 2017 Accepted 24 January 2017
Keywords: Soundscapes Auditory objects Categorisation Everyday sounds
a b s t r a c t
Categorisation is a fundamental cognitive process that plays a central role in everyday behaviour and action. Whereas previous studies have investigated the categorisation of isolated everyday sounds, this paper presents an experiment to investigate the cognitive categorisation of everyday sounds within their original context. A group of eighteen expert and non-expert listeners took part in a free sorting task using 110 sounds identified within ambisonic reproductions of urban soundscapes. The participants were asked to sort the objects into groups of sounds that served a similar purpose in the overall perception of the soundscape. Following this, the participants were asked to provide descriptive labels for the groups they had formed. The results were analysed using hierarchical agglomerative clustering and non-metric mul-tidimensional scaling (MDS) to explore both the structure and dimensionality of the data. The resulting hierarchical clustering of objects show three top level categories relating to transient sounds, continuous sounds, and speech and vocalisations. Sub-categories were identified in each of the top level categories which included harmonic and non-harmonic continuous sounds, clear speech, unintelligible speech, vocalisations, transient sounds that indicate actions, and non-salient transient sounds. The first two dimensions revealed by the MDS analysis relate to temporal extent and intelligibility respectively. Interpretation of the third dimension is less clear, but may be related to harmonic content.
Ó2017 The Authors. Published by Elsevier Ltd. This is an open access article under the CC BY license (http:// creativecommons.org/licenses/by/4.0/).
1. Introduction
Categorisation is a fundamental cognitive process[1]that plays a central role in everyday behaviour and action, supporting the organisation of knowledge (i.e. through the development of tax-onomies) and permitting inductive inference about the world (i.e. through the assumption that members of the same category share similar properties)[2]. The process of categorisation is grounded in perceptual and attentional mechanisms capable of detecting simi-larities and correspondences in the environment[3].
A category exists when two or more objects are judged to be similar to a category prototype[4]or exemplar[5]. Contemporary theories of categorisation suggest that attentional mechanisms allow the salience of different features to vary as a function of con-text[6,7]. This suggests that categorisation is contingent on task, context, and by the individual’s intentions, goals, and past experi-ences[8]. A simple example of this would be the in the comparison of different coloured shapes; when comparing a red triangle and a red circle, shape would be a more salient feature than colour,
whereas colour would be a more salient feature than shape when comparing a red triangle and a blue triangle.
The aim of this study is to investigate the categorisation of everyday sounds within the context of urban soundscapes. Research into the perception of complex scenes has traditionally focussed on the visual domain [see, for example,[9,10]]. Recently there has been a growing interest in the perception of complex auditory scenes, particularly in the formation and perception of auditory objects[11,12]. Enquiry into the perception of auditory objects has incorporated behavioural[13], psycholinguistic [14], and neurophysiological[15] approaches. From a neurobiological standpoint, an auditory object is ‘‘. . .the computational result of the auditory system’s capacity to detect, extract, segregate and group spectro-temporal regularities in the acoustic environment
[11]”. A similar definition is offered by Gestalt psychology, whereby auditory events (or auditory streams) are formed due to formal similarities in the properties of the acoustic stimulus[16]. In the context of this paper, an auditory object is any sound that is perceived as a single perceptual entity and can include both sound events where the source is clearly identifiable (e.g. a car starting) and sounds where the source isn’t identifiable but is still perceived as a coherent object (e.g. low frequency noise).
http://dx.doi.org/10.1016/j.apacoust.2017.01.027 0003-682X/Ó2017 The Authors. Published by Elsevier Ltd.
This is an open access article under the CC BY license (http://creativecommons.org/licenses/by/4.0/).
⇑Corresponding author.
E-mail address:[email protected](J. Woodcock).
Contents lists available atScienceDirect
Applied Acoustics
Studies investigating the categorisation of everyday sounds have generally been conducted using sounds isolated from their original context. Vanderveer[17]found that participants grouped sounds that were either caused by the same event or shared similar acoustical properties. Marcell et al.[18] found 27 categories of environmental sounds that described the sound source (i.e. animal, paper, ground transportation), location (e.g. nature, bathroom, household), and other ad-hoc categories such as game and recre-ation. Gygi et al.[19]investigated the similarity and categorisation of a broad range of environmental sounds; three distinct categories of sounds were found relating to harmonic sounds, discrete impact sounds, and continuous sounds. Houix et al.[20] found 4 main categories for everyday sounds which included solids, liquids, gases, and machines. In a second experiment focussing on sounds produced by solid objects, Houix et al. [20] found a distinction between discrete and continuous sounds. These studies provide an insight into how listeners categorise individual sounds, however the results should be interpreted with caution when considering the categorisation of sounds within complex sound scenes.
The perception of complex auditory scenes has been explored within the field of soundscapes [21], which aims for listener-centric assessments of environmental sound scenes. Work in this area has focussed on perceptual dimensions of listener experience
[22–25], emotional dimensions[26], the influence of expectation and contextual factors [27], and ecological validity of artificial reproduction[28,25]. Despite this relatively large body of work, lit-tle is known regarding how listeners categorise auditory objects in complex soundscapes.
Davies et al.[21]found that the language people use when talk-ing about soundscapes could be grouped into three categories: sound sources (identification of the source), sound descriptors (descriptors related to sound sources), and soundscape descriptors (descriptors related to the totality of what is heard). Guastavino
[29] identified two main categories of environmental sounds in complex soundscapes relating to the presence or absence of human activity. In an investigation into the categorisation of complex audio-visual scenes, Rummukainen et al.[30]found a three dimen-sional perceptual space was found relating to calmness, openness, and the presence of people. Other perceptual categories that com-monly emerge in soundscapes reseach are ‘‘Natural”, ‘‘human”, and ‘‘mechanical” (see Payne et al. for a review[31]).
Giordano et al.[32]have highlighted the links between the pro-cessing of certain categories of environmental sound and language, showing that the evaluation of sounds from living sources is biased towards sound independent semantic information whereas sounds from non-living sources are biased towards physical properties of the sound. The relationship between environmental sounds and semantic processing mirrors Gaver’s distinction betweenmusical
andeverydaylistening[33,34]. Musical listening occurs when the
listener focusses on low level auditory features, whereas in every-day listening the listener uses sound to interpret information about the environment. In the perception of soundscapes, Raimbault[35]
identified a ‘‘descriptive listening” mode in which listeners identify sources or events and a ‘‘holistic hearing” mode in which the lis-teners processes the soundscape as a whole. Similarly, Maffiolo et al.[36]makes the distinction between ‘‘event sequences” where listeners distinguish between individual sounds and ‘‘amorphous sequences” where individual sounds are not distinguished. Cate-gorisation systems have been found to differ between ‘‘expert” and ‘‘non-expert” listeners[37,38]and according to the emotional response to the sound[39]. This suggests that listening mode influ-ences categorisation. It may be expected that by placing listeners in a situation where they are asked to categorise individual sounds that have been isolated from their original context, the listener will be in amusicallistening mode according to Gaver’s distinction.
Considering the literature reported in this section, it is evident that the strategies used by listeners to form different categories of sound are reliant on context, the scale at which attention is focused, and listening mode. It is therefore possible that listeners’ categorisation of everyday sounds will change when the sounds are presented within their original context, compared to when the sounds are presented in isolation. At present, there have been no studies investigating the categorisation of everyday sounds within their original context. This means that it is currently not clear if the findings of previous categorisation studies are applica-ble in real world contexts. The study reported in this paper inves-tigates the perception and categorisation of environmental sounds within complex auditory scenes. The study aims to address the question of how auditory objects are cognitively structured within complex urban soundscapes, and is a further analysis of the data reported in[40].
2. Methods and materials
2.1. Ethics statement
The experiments described in this paper were approved by the University of Salford ethics committee. Participants took part in the experiments voluntarily, and written consent was taken prior to the test session. Participants were told that they were free to withdraw from the experiment at any time, without needing to give a reason to the researcher.
2.2. Participants
Eighteen participants took part in the experiment, 8 of whom had formal training in acoustics or practical experience in audio engineering, and 10 of whom had no training in acoustics or prac-tical experience in audio engineering. All participants reported having normal hearing.
2.3. Stimuli
Audio recordings of urban soundscapes were made in eight locations on a single day in the city centre of Manchester, UK. The locations were an urban park, a junction on a busy street in the city centre, a market in a busy area and a quiet area, a inside a busy shop, inside a quiet shop, inside a large museum, inside a bar, and inside a busy cafeteria. The locations were selected to pro-vide a variety of different soundscapes, and many of the locations corresponded with locations used in previous soundscape research
[21,27]. A map of the locations of the recordings is shown inFig. 1. The recordings were made using a Soundfield microphone to allow first order ambisonic reproduction. Guastavino et al. [28] and Davies et al.[25]have shown that first order ambisonic reproduc-tion in laboratory condireproduc-tions elicits a similar listener response to in-situ observations.
The duration of each of the clips was 75 s. For each of the clips, the first author of the present paper identified all of the auditory objects that were audible. This list of objects was subsequently verified and amended by 4 additional listeners, all of whom had training in audio and acoustics. In total, 110 objects were identified across all of the clips. The objects identified in each of the clips are shown in Table 1. It can be seen from this table that the objects included in the test include living and non-living sounds as well as action and non-action sounds.
sounds are processed in a more abstract manner according to phys-ical or low level perceptual parameters. This suggests that the including a mixture of sound events and other sounds described
in terms of acoustical properties could bias participants’ categori-sation strategies. However, the results presented in Section 3.1
[image:4.595.45.544.66.358.2]show no evidence of such a bias in the identified top level clusters.
Fig. 1.Map of the soundscape recording locations.
Table 1
Auditory objects identified in each of the sound clips.
Clip 1 Clip 2 Clip 3 Clip 4 Clip 5 Clip 6 Clip 7 Clip 8 Clip 9
Low frequency noise Hum of traffic Distant traffic noise
Distant traffic noise
Store music Unintelligible voices
Music Air
conditioning sound
Unintelligible voices
Birdsong Footsteps Clattering pushchairs
Unintelligible voices
Till drawer closing
Rustling Unintelligible voices
Squeaking Paper crumpling Hum of traffic Clock tower bells Unintelligible
voices
Laughter Male shop assistant voice
Creak Plate impact Muffled announcer voice
Chair scraping on floor
Clinking of coins in parking meter
High Frequency braking sound
Children’s voices
Female voices Female laugh Click Cutlery rattling Unintelligible voices
Plate clanking
Brushing sound Alarm sound Male voice Shuffling footsteps
Unintelligible voices
Clunk Clicking sound Impact Rustling
Impact sound Bus hissing Female voices Till drawer closing
Impact Scrape of paper against table
Dishwasher drawer opening
Shuffling footsteps
Can opening
Voice Vehicle
accelerating
Jangling coins Paper rustling Cough Door opening Door closing Metallic impact Car starting Clunk of
manhole cover
Creaking sound
Footsteps Jangling sound Door creaking Female voice Female voice
Siren Voices Impact sound Rustling Phone
notification whistle
Shuffling footsteps
Distant bang Knock on table
Car accelerating Hooting sound Male voices Blowing nose Guitar Door closing Door opening Rattling door High Frequency
vehicle braking sound
Male voice singing
Cough Plastic rustling Vehicle Reverberant
music
Rattling flap
Footsteps Brass music Clink Beep Footsteps Male voice
Low frequency vehicle sound
Child’s voice Ow
Laugh Stapler clicking
Latch
Rattling Store music
Male voice Male voices
2.4. Reproduction
All material was reproduced via Genelec 8030A loudspeakers [Frequency response: 58 Hz–20 kHz (2 dB), 55 Hz–21 kHz ( 3 dB)] arranged in a 5.0 configuration according to ITU-R BS. 775[41]in a semi-anechoic chamber at the University of Salford. The radius of the loudspeaker layout was 1.30 m and the listener was seated in the centre of the array. The loudspeakers were adjusted to have equal gains by generating a full scale pink noise signal for each loudspeaker and adjusting the gain of the loud-speaker so that the sound pressure level in the centre of the array was equal (85 dBA) for each loudspeaker. The programme material was reproduced from 24-bit wav files sampled at 48 kHz via an RME UFX soundcard. The B-format recordings were decoded to 5.0 using the Soundfield Surround Zone VST plugin.
2.5. Procedure
Participants were provided with a set of cards, on each of which was printed the name of a single sound that occurred in one of the clips. The cards were also printed with the time of the first occur-rence of the sound and the clip in which the sound occurred. A test interface developed in Pure Data and presented via a laptop com-puter allowed the participants to freely switch between the nine clips, and to rewind, fast-forward, and pause the clips. In order to hear all of the sounds in the sorting task participants were required to listen to the clips in their entirety at least once, and they were free to listen to each of the clips as many times as they wished.
Participants were given the following instruction:
‘‘Please sort the cards into groups such that the sounds in each group serve a similar function or purpose in the composition of
the scene.”
The participants were told that they could form as many groups as they wished, and that the relative positions of the groups on the table was unimportant. They were asked to use all of the cards on the table such that the sorting task was conducted for all of the sounds in all of the clips. Once the participant had completed their grouping, they were asked to provide a descriptive label for each of the groups they had formed. The label for each group was written on an envelope, one envelope per category, which was used to store the cards from each of the groups the participant had formed. In general, it took participants around half an hour to complete the task. Most participants adopted the strategy of starting to forming groups during the first clip they listened to; sounds from subsequent clips were added to these groups as they occurred or new groups were created as needed.
2.6. Analysis
Data from the sorting task were subject to agglomerative hier-archical cluster analysis according to the Ward method[42]. This analysis was conducted on anMNmatrix [whereMis the num-ber of objects (110) andNis the total number of categories (93)] that contained a 1 when an object was included in a certain cate-gory and a 0 otherwise. This resulted in hierarchical dendrograms that show the clustering of the individual auditory objects.
To aid the interpretation of the clusters of objects, the number of times a descriptive category label associated with a given object occurred in each cluster was calculated (these will be reported in tables). Additionally, the category labels that were unique to each cluster were identified (these will be reported in the text of the results section).
Additionally, for each participant an MM co-occurrence matrix was generated that contained a 1 if a pair of objects were
grouped in the same category and a 0 otherwise. These matrices were averaged across the participant group resulting in a similarity matrix. This similarity matrix was subject to non-metric multidi-mensional scaling[43].
3. Results
3.1. Clustering of objects
The median number of groups formed by participants was 5, with the minimum being 2 and the maximum being 10.
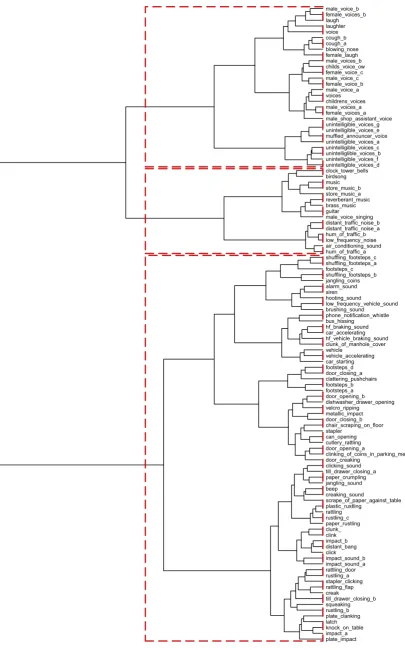
The dendrogram inFig. 2shows the results of the hierarchical agglomerative clustering analysis described in Section 2.6. The dendrogram shows 3 top level categories, which are indicated by the dashed rectangles. From top to bottom of the figure, the first of the three top level categories is related to human vocalisations. In total, there are 48 category labels associated with the objects in this cluster, 5 of which are unique to the cluster. The unique labels associated with this category are ‘‘Intelligible voices”, ‘‘Human voice”, ‘‘Sounds by humans”, ‘‘Speech by humans”, ‘‘Background sounds - Human undistinguished voices”. The 10 most frequently used category labels associated with the objects in this cluster are shown inTable 2.
The second top level category is related to background sounds with a long temporal extent, and includes traffic, air conditioning sounds, and music. In total, there are 60 category labels associated with the objects in this cluster, 11 of which are unique to the clus-ter. The unique labels associated with this category include ‘‘Nat-ure background noise”, ‘‘Background sounds - Harmonic sounds”, ‘‘Sounds by alive creatures i.e. animals”, ‘‘Background noise (urban)”, ‘‘Background sound which indicate the scene”, ‘‘Music in vicinity”, ‘‘Useful sounds - Music related”, ‘‘Music”, ‘‘Ambient music/playback of recorded music”, ‘‘Music (non-artificially added)”, and ‘‘Key information”. The 10 most frequently used cat-egory labels associated with the objects in this cluster are shown in
Table 2.
The third top level category is related to transient sounds. In total there are 70 category labels associated with the objects in this cluster, 4 of which are unique to the cluster. The unique labels associated with this category include ‘‘Vehicle sounds”, ‘‘Move-ment speeding up”, ‘‘Useful sounds - Traffic Move‘‘Move-ment slowing down”. The 10 most frequently used category labels associated with the objects in this cluster are shown inTable 2.
3.2. Multidimensional scaling
Using the method described in Section2.6a 110110 similar-ity matrix was built. This matrix was subject to non-metric multi-dimensional scaling (MDS), which allows the visualisation of the similarity matrix in a low dimensional space. The dimensions that result from a multidimensional scaling analysis of a similarity matrix are generally interpreted as being orthogonal perceptual dimensions[44]. The main aim of multidimensional scaling is to determine a configuration of a group of objects in an R-dimensional multiR-dimensional space to provide a visual represen-tation of pairwise distances or (dis) similarities between objects in the group. By studying the configuration of points in this multidi-mensional configuration it is possible to identify the perceptual attributes that underlie the group of objects, each of theR dimen-sions being orthogonal and therefore representative of a salient perceptual attribute underlying the group of objects represented in the space.
non-plate_impact impact_a knock_on_table latch plate_clanking rustling_b squeaking till_drawer_closing_b creak
rattling_flap stapler_clicking rustling_a rattling_door impact_sound_a impact_sound_b click distant_bang impact_b clink clunk_ paper_rustling rustling_c rattling plastic_rustling
scrape_of_paper_against_table creaking_sound
beep jangling_sound paper_crumpling till_drawer_closing_a clicking_sound door_creaking
clinking_of_coins_in_parking_meter door_opening_a
cutlery_rattling can_opening stapler
chair_scraping_on_floor door_closing_b metallic_impact velcro_ripping
dishwasher_drawer_opening door_opening_b footsteps_a footsteps_b clattering_pushchairs door_closing_a footsteps_d car_starting vehicle_accelerating vehicle
clunk_of_manhole_cover hf_vehicle_braking_sound car_accelerating hf_braking_sound bus_hissing
phone_notification_whistle brushing_sound low_frequency_vehicle_sound hooting_sound
siren alarm_sound jangling_coins shuffling_footsteps_b footsteps_c shuffling_footsteps_a shuffling_footsteps_c hum_of_traffic_a air_conditioning_sound low_frequency_noise hum_of_traffic_b distant_traffic_noise_a distant_traffic_noise_b male_voice_singing guitar
[image:6.595.85.491.62.713.2]brass_music reverberant_music store_music_a store_music_b music birdsong clock_tower_bells unintelligible_voices_d unintelligible_voices_f unintelliglible_voices_b unintelligible_voices_c unintelligible_voices_a muffled_announcer_voice unintelligible_voices_e unintelligible_voices_g male_shop_assistant_voice female_voices_a male_voices_a childrens_voices voices male_voice_a female_voice_b male_voice_c female_voice_c childs_voice_ow male_voices_b female_laugh blowing_nose cough_a cough_b voice laughter laugh female_voices_b male_voice_b
metric stress of 0.11, which suggests a fair fit with the original data
[45].Figs. 3 and 4show the three dimensional solution. For read-ability, a random sample of 1/3 of the auditory objects are shown in these figures. The full configurations are available fromhttp:// dx.doi.org/10.17866/rd.salford.3497936.
4. Discussion
The aim of the work presented in this paper is to investigate the categorisation of everyday sounds within complex auditory scenes, namely urban soundscapes. Participants were asked to sort objects within complex soundscapes according to their function in the scene. Cluster analysis revealed a hierarchical structure with a top layer consisting of three main categories. These categories related to human vocalisation, background sounds with a long temporal extent, and transient sounds. This top level categorisation supports the findings of Houix et al.[20], who found a clear distinc-tion between continuous and discrete sounds and Gygi et al.[19]
who identified categories relating to continuous, discrete, and harmonic sounds as well as vocalisations. This partitioning is also supported by the work of Giordano et al. [32], which revealed differences in the way the brain processes living and non-living
sounds. Similar results have also been found in studies into the cat-egorisation of complex urban soundscapes such as the distinction found by Maffiolo et al.[36]between ‘‘event sequences” where lis-teners distinguish between individual sounds and ‘‘amorphous sequences” where individual sounds are not distinguished. These findings suggest that many of the categorisation frameworks found in previous studies into the categorisation of isolated everyday sounds may be extended to the categorisation of auditory objects within urban soundscapes.
4.1. Sub-categories in the clustering top level clusters
Examining the dendrogram inFig. 2, there are a number of clear sub-categories within each of the three top level clusters. In the category containing speech and vocalisations there are three clear categories. The first of these categories is related to vocalisations, and includes sounds such as ‘‘laugh” and ‘‘cough”. The second of the sub-categories is related to intelligible speech, and includes sounds such as ‘‘male voice” and ‘‘female voice”. The third of the sub-categories is related to unintelligible speech, and includes sounds such as ‘‘unintelligible voices” and ‘‘muffled announcer voice”.
−0.6 −0.4 −0.2 0.0 0.2 0.4 0.6
−0.6
−0.4
−0.2
0.0
0
.2
0.4
0
.6
Dimension I
Dimension II
●
●
●
●
●
● ●
●
●
●
● female_voice_b
clock_tower_bells
voices
car_accelerating
male_voice_a
clunk_ jangling_sound
alarm_sound hum_of_traffic_b
till_drawer_closing_a female_voice_c
laughter
footsteps_b female_voices_a
footsteps_d
impact_sound_a unintelliglible_voices_b
brass_music
till_drawer_closing_b hf_braking_sound
siren
plate_impact male_voice_b
rustling_c
squeaking
paper_rustling creaking_sound
plate_clanking
jangling_coins footsteps_c
click
childs_voice_ow
low_frequency_noise
vehicle
[image:7.595.42.562.86.200.2]stapler blowing_nose
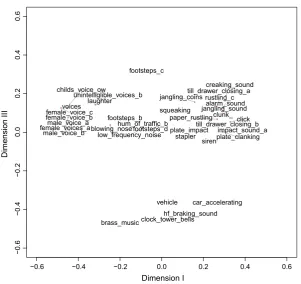
[image:7.595.156.452.458.739.2]Fig. 3.Dimensions I and II of the MDS analysis of the similarity matrix.
Table 2
10 most frequently used category labels for the three top level categories.Nis the number of times each label was associated with the category.
Category 1 Category 2 Category 3
1 Human noises (N= 28) Background sound (N= 13) Individually recognisable noises (N= 62) 2 Presence of people (N= 27) Setting/environment (N= 13) Sounds resulted from human activities (N= 53) 3 Vocal (like) (N= 25) Background (instruments) (N= 12) Background (N= 48)
4 People around (N= 25) Where are we? (N= 10) General background (N= 45) 5 Sounds by humans (N= 24) Background (N= 9) Non dominant event sound (N= 43) 6 Secondary (N= 21) Scene defining. Large temporal extent (N= 8) Where are we? (N= 42)
7 Information (N= 21) General background (N= 8) Object sounds (N= 41) 8 Human sounds (N= 20) Background traffic, voices, etc. not distinguishable,
give an idea about location (N= 8)
Single event sounds (N= 41)
In the category of continuous sounds there are two clear sub-categories. The first of these clusters is related to sounds with har-monic content, and includes sounds such as ‘‘birdsong” and ‘‘mu-sic”. The second of the sub-clusters is related to sounds dominated by noise, and includes sounds such as ‘‘hum of traffic” and ‘‘air conditioning”. This partitioning into harmonic and non-harmonic sounds was also observed by Gygi et al.[19].
In the category of transient sounds there are two clear clusters. There is a significant degree of overlap in the category descriptions provided by participants for the objects in these clusters, however the sub-clusters appear to relate to: (1) objects which are salient to the scene, clearly indicating actions and movements, such as foot-steps and vehicle sounds and (2) lower level transient events such and rustling and scraping sounds. The distinction between salient and non-salient sounds is supported by evidence that action sounds are processed differently by the brain than non-action sounds[46]
and by the findings of Houix et al.[20]who found sub-categories relating to the physical actions that produced the sound.
4.2. Interpretation of perceptual space
Fig. 3 shows the first 2 dimensions of the MDS solution described in Section 3.2. The 3 top level categories revealed through the hierarchical cluster analysis can be clearly identified in the MDS solution. The ordering of the top level categories along Dimension I show a progression from speech and vocalisations to continuous sounds to transient sounds. The ordering of the top level categories along Dimension II shows a progression from a mixture of speech and transient sounds to continuous sounds.
Fig. 4shows Dimension III of the MDS solution; there is no clear separation of the 3 top level categories along this dimension.
The ordering of sounds along Dimension I shows that this dimension clearly separates the 3 top level categories. The order of progression of the categories along this dimension suggests that the dimension is related to the temporal extent of the sounds, with
speech sounds and continuous sounds concentrated at the lower end of the dimension and transient sounds concentrated at the upper end.
The ordering of sounds along Dimension II shows that the 3 top level categories are spread and mixed along this dimension; how-ever, this dimension separates a number of the sub-categories that were identified within the top level categories (see Section4.1). The category of transient sounds are arranged on Dimension II such that the sounds within this category progress from sounds indicat-ing movements and actions (i.e. footsteps) to less salient transient sounds (i.e. rustling paper). The category of speech sounds are ordered along Dimension II such that they progress from intelligi-ble speech (i.e male voice) to unintelligiintelligi-ble speech (i.e unintelligi-ble voices). The category of continuous sounds are not spread along this dimension, and occupy a narrow range at one extreme of Dimension II. Taken together, this ordering of sounds on Dimen-sion II suggest that this perceptual dimenDimen-sion broadly relates to intelligibility or readability, with sounds that contribute to the understanding of the action within the scene occurring at one extreme of the dimension and sounds which don’t occurring at the other extreme.
The interpretation of Dimension III is less clear than Dimensions I and II; however, the positioning of sounds along categories of con-tinuous sounds and transient sounds can be seen to be spread along Dimension III. The spread of continuous sounds along this dimen-sion relates to the sub-clustering of this top level category into har-monic and non-harhar-monic sounds however this ordering isn’t evident in the ordering of transient sounds along this dimension.
4.3. Comparison between expert and non-expert listeners
Previous work has indicated differences in the categorisation strategies between expert and non-expert listeners. In this work, participants who stated that they had practical experience in audio engineering were classified as expert listeners. To investigate the
−0.6 −0.4 −0.2 0.0 0.2 0.4 0.6
−0.6
−0.4
−0.2
0.0
0
.2
0.4
0
.6
Dimension I
Dimension III
● ●
●
● ●
● ●
●
● ●
● ●
● ●
● ● female_voice_b
clock_tower_bells voices
car_accelerating male_voice_a
clunk_ jangling_soundalarm_sound
hum_of_traffic_b
till_drawer_closing_a
female_voice_c laughter
footsteps_b
female_voices_a footsteps_d impact_sound_a unintelliglible_voices_b
brass_music
till_drawer_closing_b
hf_braking_sound siren plate_impact male_voice_b
rustling_c
squeaking paper_rustling
creaking_sound
plate_clanking jangling_coins
footsteps_c
click childs_voice_ow
low_frequency_noise
[image:8.595.143.445.61.345.2]vehicle stapler blowing_nose
similarity of the clustering solutions between the expert and non-expert listener groups, the Rand Index was calculated between the two solutions[47]. The Rand Index is a measure of the similarity between two clustering solutions which takes into account false positives, true positive, false negatives, and true negatives. The Rand index between the clustering of objects for expert and non-expert listeners was 78%, indicating that there is a high degree of similarity in the clustering solutions obtained for the expert and non-expert listeners. The similarity in structure between the clus-tering solutions for the expert and non-expert listeners can be seen in the supporting figures http://dx.doi.org/10.17866/rd.salford. 3497936.Table 3shows the percentage of objects common to each of the three top level categories between the expert and non-expert listener groups. Differences in categorisation between the two groups included:
The non-expert group included 3 of the unintelligible voice objects in the category of continuous sounds, whereas these objects are in the category of speech and vocalisations in the expert group’s configuration.
The non-expert group categorised the sub-category of vehicle sounds in the top level category of continuous sounds, whereas the expert listener groups categorised these objects in the top level category of transient sounds.
The non-expert group categorised footstep objects in the top level category of transient sounds, whereas the expert listener group categorised these objects in the top level category that included speech and vocalisations.
Tables 4 and 5 show the 10 most frequently used category labels for the three top level categories for the expert and non-expert listener groups respectively. As with the clustering solu-tions, the descriptive labels applied by the expert and non-expert listener groups are similar. This similarity in language coupled with the high percentages of common objects between the top level categories suggest that the expert and non-expert listener groups adopted similar categorisation strategies.
5. Conclusions
This paper has presented an experiment to investigate the cog-nitive categorisation of sounds within the context of complex urban soundscapes. Eighteen participants, comprising expert and non-expert listeners, completed a free sorting task in which they were asked to sort a set of sounds occurring in ambisonic repro-ductions of complex urban soundscapes into groups of sounds that served a purpose in the overall perception of the soundscape. Three top level categories were revealed through hierarchical cluster analysis relating to transient sounds, continuous sounds, and speech and vocalisations. The top level clusters were found to con-tain a number of clear sub-clusters relating to harmonic and
non-Table 4
10 most frequently used category labels for the three top level categories for the expert listener group.Nis the number of times each label was associated with the category.
Category 1 Category 2 Category 3
1 Human sounds (N= 25) Background sound (N= 21) Individually recognisable noises
(N= 62)
2 Human noises (N= 25) Where are we? (N= 17) Single event sounds (N= 42)
3 Vocal (like) (N= 17) Continuous amorphous background (N= 14) Object sounds (N= 41) 4 Dominant and meaningful event sound (N= 17) Background filler/bed (N= 13) Where are we? (N= 39) 5 Useful sounds - Human voices, laughters, announcements,
footsteps (N= 16)
Human noises (N= 9) Tonal. Musique concrete (N= 39)
6 Human generated sounds/noises/vocalisations. Singluar (N= 16) Vocal (like) (N= 9) Non dominant event sound (N= 39) 7 Where are we? (N= 15) Background sounds - Human undistinguished
voices (N= 8)
Low level event sounds (N= 32)
8 What is happening? (N= 10) Human generated sounds/noises/vocalisations. Group (N= 8)
Not significant sounds - Artificial noise (N= 31)
9 Intelligible voices (N= 10) Music (N= 7) High level foreground event sounds
(N= 27)
[image:9.595.42.291.337.391.2]10 Not significant sounds - Human realted (N= 10) Scene defining. Large temporal extent (N= 7) What is happening? (N= 23)
Table 5
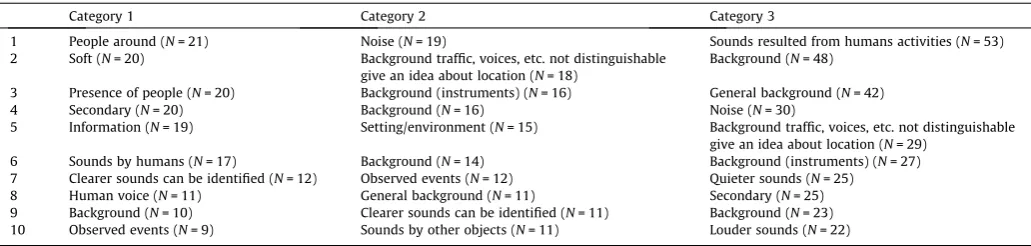
10 most frequently used category labels for the three top level categories for the non-expert listener group.Nis the number of times each label was associated with the category.
Category 1 Category 2 Category 3
1 People around (N= 21) Noise (N= 19) Sounds resulted from humans activities (N= 53) 2 Soft (N= 20) Background traffic, voices, etc. not distinguishable
give an idea about location (N= 18)
Background (N= 48)
3 Presence of people (N= 20) Background (instruments) (N= 16) General background (N= 42)
4 Secondary (N= 20) Background (N= 16) Noise (N= 30)
5 Information (N= 19) Setting/environment (N= 15) Background traffic, voices, etc. not distinguishable give an idea about location (N= 29)
6 Sounds by humans (N= 17) Background (N= 14) Background (instruments) (N= 27) 7 Clearer sounds can be identified (N= 12) Observed events (N= 12) Quieter sounds (N= 25) 8 Human voice (N= 11) General background (N= 11) Secondary (N= 25) 9 Background (N= 10) Clearer sounds can be identified (N= 11) Background (N= 23) 10 Observed events (N= 9) Sounds by other objects (N= 11) Louder sounds (N= 22)
Table 3
Percentage of objects common to each of the 3 top level categories between the expert and non-expert group.
Continuous sounds (%)
Transient sounds (%)
Speech and vocalisations (%)
Continuous sounds 86 0 14
Transient sounds 17 83 0
[image:9.595.43.565.432.580.2] [image:9.595.46.562.623.746.2]harmonic continuous sounds, clear speech, unintelligible speech, vocalisations, transient sounds that indicate actions, and non-salient transient sounds. Similar categorisation strategies were observed between the expert and non-expert listener groups. Non-metric multidimensional scaling revealed a 3 dimensional perceptual space. The first two dimensions of this space related to temporal extent and intelligibility respectively; however, inter-pretation of the third dimension was less clear. These results pro-vide an insight into the cognitive categorisation of individual sounds within the context of complex soundscapes. The results suggest that previous studies into the categorisation of isolated everyday sounds may be extended to the categorisation of auditory objects within urban soundscapes.
Acknowledgement
This work was supported by the EPSRC Programme Grant S3A: Future Spatial Audio for an Immersive Listener Experience at Home (EP/L000539/1) and the BBC as part of the BBC Audio Research Partnership. The author would like to thank the participants of the listening tests for their time.
The experimental data underlying the findings are fully avail-able without restriction, details are availavail-able from http://dx.doi. org/10.17866/rd.salford.3497936.
References
[1]Cohen H, Lefebvre C. Handbook of categorization in cognitive science. Elsevier; 2005.
[2] Hampton JA. The role of similarity in natural categorization.
[3]McClelland JL, Rogers TT. The parallel distributed processing approach to semantic cognition. Nat Rev Neurosci 2003;4(4):310–22.
[4]Rosch E, Mervis CB, Gray WD, Johnson DM, Boyes-Braem P. Basic objects in natural categories. Cognitive Psychol 1976;8(3):382–439.
[5]Nosofsky RM. Attention, similarity, and the identification–categorization relationship. J Exp Psychol: General 1986;115(1):39.
[6]Goldstone RL. The role of similarity in categorization: providing a groundwork. Cognition 1994;52(2):125–57.
[7]Sloutsky VM. The role of similarity in the development of categorization. Trends Cognitive Sci 2003;7(6):246–51.
[8]Ozcan E, van Egmond R, Jacobs J. Product sounds: basic concepts and categories. Int J Design 2014;8(3):97–111.
[9]Oliva A, Schyns PG. Coarse blobs or fine edges? Evidence that information diagnosticity changes the perception of complex visual stimuli. Cognitive Psychol 1997;34:72–107.
[10]Feldman J. What is a visual object? Trends Cognitive Sci 2003;7(6):252–6. [11]Bizley JK, Cohen YE. The what, where and how of auditory-object perception.
Nat Rev Neurosci 2013;14(10):693–707.
[12]Griffiths TD, Warren JD. What is an auditory object? Nat Rev Neurosci 2004;5 (11):887–92.
[13]Ballas JA, Mullins T. Effects of context on the identification of everyday sounds. Human Perform 1991;4(3):199–219.
[14]Dubois D, Guastavino C, Raimbault M. A cognitive approach to urban soundscapes: using verbal data to access everyday life auditory categories. Acta Acustica United Acustica 2006;92(6):865–74.
[15]Saygın AP, Dick F, Wilson SW, Dronkers NF, Bates E. Neural resources for processing language and environmental sounds Evidence from aphasia. Brain 2003;126(4):928–45.
[16]Bregman AS. Auditory scene analysis: the perceptual organization of sound. MIT Press; 1994.
[17]Vanderveer NJ. Ecological acoustics: human perception of environmental sounds. Cornell University; 1979.
[18]Marcell MM, Borella D, Greene M, Kerr E, Rogers S. Confrontation naming of environmental sounds. J Clinical Exp Neuropsychol 2000;22(6):830–64. [19]Gygi B, Kidd GR, Watson CS. Similarity and categorization of environmental
sounds. Percept Psychophys 2007;69(6):839–55.
[20]Houix O, Lemaitre G, Misdariis N, Susini P, Urdapilleta I. A lexical analysis of environmental sound categories. J Exp Psychol: Appl 2012;18(1):52. [21]Davies WJ, Adams MD, Bruce NS, Cain R, Carlyle A, Cusack P, et al. Perception of
soundscapes: an interdisciplinary approach. Appl Acoust 2013;74(2):224–31. [22]Kang J. Urban sound environment. CRC Press; 2006.
[23]Axelsson Ö, Nilsson ME, Berglund B. A principal components model of soundscape perceptiona). J Acoust Soc Am 2010;128(5):2836–46.
[24]Hall DA, Irwin A, Edmondson-Jones M, Phillips S, Poxon JE. An exploratory evaluation of perceptual, psychoacoustic and acoustical properties of urban soundscapes. Appl Acoust 2013;74(2):248–54.
[25]Davies WJ, Bruce NS, Murphy JE. Soundscape reproduction and synthesis. Acta Acustica United Acustica 2014;100(2):285–92.
[26]Cain R, Jennings P, Poxon J. The development and application of the emotional dimensions of a soundscape. Appl Acoust 2013;74(2):232–9.
[27]Bruce NS, Davies WJ. The effects of expectation on the perception of soundscapes. Appl Acoust 2014;85:1–11.
[28]Guastavino C, Katz BF, Polack J-D, Levitin DJ, Dubois D. Ecological validity of soundscape reproduction. Acta Acustica United Acustica 2005;91(2):333–41. [29]Guastavino C. Categorization of environmental sounds.. Can J Exp Psychol/
Revue canadienne de psychologie expérimentale 2007;61(1):54.
[30]Rummukainen O, Radun J, Virtanen T, Pulkki V. Categorization of natural dynamic audiovisual scenes. PloS One 2014;9(5):e95848.
[31] Payne S, Davies W, Adams M. Research into the practical and policy applications of soundscape concepts and techniques in urban areas. [32]Giordano BL, McDonnell J, McAdams S. Hearing living symbols and nonliving
icons: category specificities in the cognitive processing of environmental sounds. Brain Cognition 2010;73(1):7–19.
[33]Gaver WW. How do we hear in the world? Explorations in ecological acoustics. Ecol Psychol 1993;5(4):285–313.
[34]Gaver WW. What in the world do we hear? An ecological approach to auditory event perception. Ecol Psychol 1993;5(1):1–29.
[35]Raimbault M. Qualitative judgements of urban soundscapes: questionning questionnaires and semantic scales. Acta Acustica United Acustica 2006;92 (6):929–37.
[36]Maffiolo V, Castellengo M, Dubois D. Qualitative judgments of urban soundscapes. INTER-NOISE and NOISE-CON congress and conference proceedings, vol. 1999. Institute of Noise Control Engineering; 1999. p. 1251–4.
[37]Dubois D. Categories as acts of meaning: the case of categories in olfaction and audition. Cognitive Sci Q 2000;1(1):35–68.
[38]Lemaitre G, Houix O, Misdariis N, Susini P. Listener expertise and sound identification influence the categorization of environmental sounds. J Exp Psychol: Appl 2010;16(1):16.
[39]Bergman P, Sköld A, Västfjäll D, Fransson N. Perceptual and emotional categorization of sound. J Acoust Soc Am 2009;126(6):3156–67.
[40]Woodcock J, Davies WJ, Cox TJ, Melchoir F. Categorization of broadcast audio objects in complex auditory scenes. J Audio Eng Soc 2016;64(6):380–94. [41] ITU, ITU-R BS.775-2. Multichannel stereophonic sound system with and
without accompanying picture. ITU Radiocommunication Assembly; 2006. [42]Ward JH. Hierarchical grouping to optimize an objective function. J Am Stat
Assoc 1963;58(301):236–44.
[43]Borg I, Groenen PJ. Modern multidimensional scaling: theory and applications. Springer Science & Business Media; 2005.
[44]McAdams S, Winsberg S, Donnadieu S, De Soete G, Krimphoff J. Perceptual scaling of synthesized musical timbres: common dimensions, specificities, and latent subject classes. Psychol Res 1995;58(3):177–92.
[45]Kruskal JB. Multidimensional scaling by optimizing goodness of fit to a nonmetric hypothesis. Psychometrika 1964;29(1):1–27.
[46]Lewis JW, Wightman FL, Brefczynski JA, Phinney RE, Binder JR, DeYoe EA. Human brain regions involved in recognizing environmental sounds. Cereb Cortex 2004;14(9):1008–21.