Kernel Methods for Activation Energy Prediction
Haoyu Chen
Supervisor: Prof. Ambuj Tewari & Jonathan Goetz
Abstract
In this report, we are interested in predicting the activation energy of a reaction based on information about the reactants using machine learning techniques. Feature engineering is always a key part of algorithm design in machine learning. We focused on structural aspects of molecules that can be described by common mathematical structures such as strings and graphs. The flexibility of kernel methods allowed us to make predictions based on molecular similarities with a well defined kernel function. We implemented a pipeline where several kernels were applied to our chemistry datasets and the prediction accuracy was evaluated for each kernel.
Contents
1 Introduction 2
1.1 Kernel methods . . . 2
1.2 Kernels for molecules . . . 3
1.3 Preview . . . 4
2 Methods 4 2.1 Data . . . 4
2.2 SMILES . . . 5
2.3 Fingerprints . . . 5
2.3.1 Daylight Fingerprints . . . 5
2.3.2 Morgan Fingerprints . . . 6
2.3.3 Neural Graph Fingerprints . . . 6
2.4 Kernel ridge regression . . . 7
3 Results 8 3.1 Setup . . . 8
4 Discussion 10
5 User Manual 11
5.1 String Kernels. . . 12
5.1.1 Spectrum Kernel . . . 12
5.1.2 Mismatch Kernel . . . 12
5.1.3 String Subsequence Kernel . . . 13
5.2 Graph Kernels . . . 14
5.2.1 Marginalized Kernel . . . 14
5.2.2 Subtree Kernel . . . 15
5.2.3 Tanimoto Kernel . . . 16
1
Introduction
Learning to predict quantities associated with chemical reactions including information about
final products, intermediate products, side reactions and other properties of the chemical system
is an important topic in computational chemistry. Among this variety of chemical quantities
to be predicted, theactivation energy of a reactionis the one that closely relates reactants to possible reactions since it measures the potential energy barrier between reactants and
prod-ucts and determines reaction rates via the well-known Arrhenius’ equation. Our prediction
of activation energy is based on the molecular structure of reactants. One may assume that
if the reactants of unknown reactions are similar to those of some known reactions, then the
products will also be similar. This idea is an extension of the similarity principle that structural
similarity of molecules results in similar activities and properties. The similarity principle has
been widely used in bioinformatics and chemoinformatics problems such as predicting protein
function (Borgwardt et al., 2005) and evaluating boiling point of alkanes (Ga¨uzere et al., 2012).
1.1
Kernel methods
Kernel methods are a powerful class of machine learning methods that can turn out to be very
useful in computational chemistry. Applying kernel methods to a computational chemistry
problem consists of two steps: 1) find a kernel function for measuring the structural similarity
between molecules; 2) apply kernelized algorithms to solve specific tasks. The core concept
is that the kernel function performs a mapping into an embedding feature space where linear
dot product in the feature spaceHvia a map Φ, that is, we have a function
k:X × X →R, (x, x0)7→k(x, x0)
satisfying that forx, x0∈ X,
k(x, x0) =hΦ(x),Φ(x0)i.
Kernel methods allow flexible construction of algorithms in the feature space. What makes
a kernel function useful in practice is that we can compute it even when the mapping function Φ
is not given explicitly. The computation of inner product from the original space via the kernel
function is designed to be computationally efficient, making the method applicable. In order to
apply kernel methods, we usually construct the Gram matrixKfirst, given an adequate kernel
kand inputsx1, x2, ...xn. The Gram matrix is an×nmatrix with elements defined as
Kij :=k(xi, xj).
The Gram matrix provides useful geometric information about feature space and is usually
the sole input required for many available classification or clustering methods.
1.2
Kernels for molecules
The choice of a representation of molecular structure is a critical problem in measurement of
similarities. In practice, the molecules can be converted to a structured data structure such as
strings, trees or graphs. Various kernel methods have already been developed based on these
representations. SMILES is a standard linear notation method to encode molecules with specific
characters representing atoms and bonds symbols and a few grammatical rules. Most string
kernels construct a feature space indexed by fixed-length tuples of characters. For example,
the spectrum kernel (Leslie et al., 2001) counts the number of occurrences of each potential
substring (without gaps), mismatch kernel (Leslie et al., 2004) counts the number of occurrences
of each substring up to given mismatches, and subsequence string kernel (Lodhi et al., 2002)
counts the number of occurrences of each subsequence that allows gaps, with a weight decaying
exponentially with the number of gaps.
In addition to a linear text representation, the structure of molecules can be naturally
encoded by a labeled graphG= (V,E, µ, ν), whereV is a set of vertices representing atoms and
E is a set of edges representing bonds. Atom types (e.g., carbon, nitrogen, oxygen, etc.) and
bond types (single, double, triple or aromatic) correspond to vertex labelsµand edge labelsν,
of molecular graphs for similarity comparison or information retrieval. Those representations
include vectors of descriptions (Cherqaoui and Villemin, 1994), adjacency matrix (Caelli and
Kosinov, 2004), edit distance (Neuhaus and Bunke, 2006) and a set of features from graphs.
The last constitutes a major graph kernel family where walks, paths, subtrees (Ramon and
G¨artner, 2003), cyclic patterns (Horv´ath et al., 2004) or more general substructures form the
basis for constructing kernel functions. In recent years, data representations that derived from
3D geometrics were introduced including Coulomb matrices (Rupp et al., 2012) and atomic
distances (Sch¨utt et al., 2017).
1.3
Preview
In our analyses, string kernels such as spectrum kernel, mismatch kernel and subsequence string
kernel, and graph kernels such as marginalized graph kernel and subtree kernel were used to
compute the similarities between molecular structures of reactants. Another group of encoding
is fingerprints including daylight fingerprints based on linear paths, Morgan fingerprints based
on circular paths and neural graph fingerprints as an extension of Morgan fingerprints. The
first two fingerprints were paired with Tanimoto kernel and the last one was used along with
neural networks. Kernel ridge regression was then applied to the regression problem where
the target was the activation energy of each reaction. All the methods were evaluated and
compared based on the accuracy of the prediction.
2
Methods
2.1
Data
The chemical data is prepared by our colloborators (Prof. Zimmerman’s lab) in University of
Michigan’s chemistry department and consists of five groups of reactants (names cl, da, ke, ene,
ene6) and the corresponding activation energies. Each group contain 1518 reactions. All the
reactions of five groups are similar in that they have only one reactant (reacting with itself).
Within each group, all the reactants share the same core fragment that involves in the potential
reactions. The additional atoms irrelevant to the reaction vary among each molecule of the same
is a typical chemical file format that specifies molecular geometry. Graphical features such as
paths and walks can be derived from the format. The xyz format can easily be converted to
other formats such as smi and sdf.
2.2
SMILES
SMILES (Simplified Molecular Input Line Entry System) is a chemical notation system designed
for modern chemical information processing. The system represents the molecular structure
using a linear notation that comprises a series of characters, which is essentially the
two-dimensional valence-oriented picture chemists draw to describe a molecule (Weininger, 1988).
SMILES describing only the labeled molecular graph (i.e. atoms and bonds, but no chiral or
isotopic information). It is similar to natural language and has been a standard language for
chemical representation in academia and industry.
For example, the SMILES notation for isobutyric acid is CC(C)C(=O)O and for
[image:5.612.265.347.402.438.2]phenter-mine is CC(C)(N)CC1=CC=CC=C1
Figure 1: The structure of isobutyric acid
Figure 2: The structure of phentermine
2.3
Fingerprints
2.3.1 Daylight Fingerprints
Fingerprints have been widely used to encode the structure of a molecule. The most common
[image:5.612.255.356.498.542.2]a given length and then hashing each of the linear fragments into a bit-vector of a fixed size.
The binary bits in the vector represent the presence or absence of particular substructures in
[image:6.612.184.431.180.286.2]the molecule.
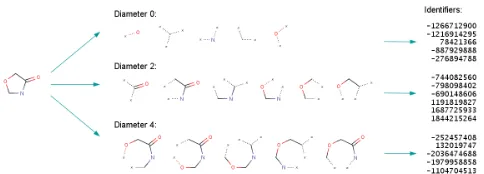
Figure 3: Graphical abstraction of Daylight fingerprints (Cereto-Massagu´e et al., 2015)
2.3.2 Morgan Fingerprints
There exist several generalized graph-based fingerprints that can be used as alternative choices
for structural comparisons. The ECFP categories (also referred to as circular fingerprints
or Morgan fingerprints) are the most popular ones. The main difference between Morgan
fingerprints and traditional fingerprints is that the former are generated by enumerating all
circular instead of linear fragments grown radially from each heavy atom of the molecule up to
the given radius (Rogers and Hahn, 2010). Each circular substructure gets an integer identifier
after hashing to indicate its presence. Circular fingerprints have been used successfully in the
field of drug discovery and virtual screening.
Tanimoto kernel (Ralaivola et al., 2005) is used to extract similarity from both Daylight
fin-gerprints and Morgan finfin-gerprints. The two finfin-gerprints are binary vectors, and Jaccard/Tanimoto
coefficients are well suited for similarity measuring.
2.3.3 Neural Graph Fingerprints
A recent work introduced the convolutional neural network (Duvenaud et al., 2015) that
op-erates directly on molecular graphs and returns fingerprints vectors called neural graph
Figure 4: Graphical abstraction of Morgan fingerprints (Rogers and Hahn, 2010)
local filters to each atom and iteratively to its neighborhood and a global function collects and
decodes the information from each substructure in the molecule in the end. Unlike circular
fingerprints that rely on hash operation to assign the indentifier for a neighborhood, neural
graph fingerprints use a single layer of a neural network aiming to make molecular structures
that have trivial differences get similar activations. Another modification is that neural graph
fingerprints replace the indexing operation with a softmax operation to convert all the
substruc-tures’ feature vectors to the final fingerprint. Instead of a binary vector, we get a real-valued
vector with neural graph fingerprints, hence the Tanimoto kernel is replaced with a neural net
for predictive tasks. The new fingerprints showed its advantage over other fingerprints in terms
of the interpretability and predictive performance.
2.4
Kernel ridge regression
Given a set of inputs (xi, yi), we have
X=
−xT1−
−xT2−
.. .
−xT n− y= y1 y2 .. . yn
Recall that in ridge regression, the estimate ofβcan be obtained by minimizing the following
function:
ˆ
If we take the derivative with respect to β and set it to zero, we get: ˆ
βM AP = (XTX+λI)−1XTy.
Note that XTX+λI is always invertible since λ is specified to be positive. In order to
kernelize it, we start from:
(XTX+λI) ˆβM AP =XTy.
With some simple computation, we get: ˆ
βM AP ,XTα,
whereα=λ−1(y−XβM APˆ ). After replacing ˆβM AP into the definition ofα, we have
α= (K+λI)−1y.
Hence we can apply the kernel trick to avoid directly using the mapping ofX in the feature
space. In order to make predictions from new dataset Xnew (assuming that it consists of row
vectors), we have
ynew=Xnewβˆ=XnewXT(K+λI)−1y.
Only inner products ofxare left in the final equation so that only gram matrix is required to
apply kernel ridge regression. The input of kernel ridge regression in our analysis is computed
based on similarities between molecules using three different graph kernels.
3
Results
3.1
Setup
Kernel ridge regression was tuned by 5-fold cross validation to optimize λ. For each kernel
method, there exist tunable arguments or other factors that affect the results. For instance,
the size of bit-vector, the maximal length of path or the radius of the node, and even the
hashing functions all affect the Tanimoto kernel. The parameters were set based on convention
and some experiments so as to ensure that the final result is near optimal. The arguments of
all methods except neural graph fingerprints were set to be the same for five datasets after we
found that the optimal value of one group works well in other datasets as well. For neural graph
fingerprints, we tuned the neural parameters while training. The meaning of each parameter
kernel types arguments spectrum length(k) = 4
mismatch length(k) = 5, mismatch(m) = 1 subsequence length(p) = 4, lambda = 0.8 marginalized stopP = 0.1
[image:9.612.194.418.100.195.2]subtree depthMax = 3, lambda = 0.1 Daylight fps maxPath = 5, vectorSize = 2048 Morgan fps radius = 2
Table 1: Argument Values
3.2
Activation energy prediction
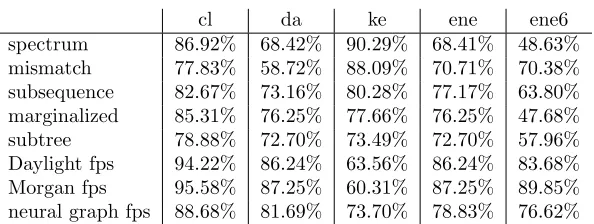
cl da ke ene ene6 spectrum 86.92% 68.42% 90.29% 68.41% 48.63% mismatch 77.83% 58.72% 88.09% 70.71% 70.38% subsequence 82.67% 73.16% 80.28% 77.17% 63.80% marginalized 85.31% 76.25% 77.66% 76.25% 47.68% subtree 78.88% 72.70% 73.49% 72.70% 57.96% Daylight fps 94.22% 86.24% 63.56% 86.24% 83.68% Morgan fps 95.58% 87.25% 60.31% 87.25% 89.85% neural graph fps 88.68% 81.69% 73.70% 78.83% 76.62%
Table 2: R2for activation energy prediction
Different kernel methods perform differently over different datasets. In general, the
Tani-moto kernels with two fingerprints outperformed other kernels except for ke dataset and they
got very similar results. Although the neural graph fingerprints were expected to exceed linear
fingerprints and circular fingerprints, it turned out that the latter two did better in this case.
However, neural graph fingerprints had more stable performance. The method achieved decent
accuracy when other two fingerprints performed poorly in ke. The simple spectrum kernel
showed poor predictive power, but succeeded in ke. The performance of three string kernels
varied among different datasets and there were no significant difference in predictive power
between the three string kernels and two graph kernels.
The time complexity of each algorithms relies on the parameters chosen. In practice, string
kernels took longer time, especially the mismatch kernel and string subsequence kernel. Daylight
fingerprints and Morgan fingerprints were much faster than other kernels and provided better
results in our case, which made them the optimal choice for measuring molecular similarity.
[image:9.612.159.456.271.383.2]containing more than one thousand molecules, methods other than the three fingerprints may
take hours to finish.
4
Discussion
Although SMILES is a simple, user-friendly and machine-friendly chemical language, it remains
a challenging task to extract and process important information about chemical structure such
as branches if we use a string representation. Previous reserach showed that string kernels
achieved decent performance in text analysis and protein classification, but it remained doubtful
whether it is suitable for SMILES notation considering the properties of the language. In our
analysis, string kernels lagged behind other kernels.
Tanimoto kernel and marginalized graph kernel are both computed based on detection of
linear features of graphs. One major drawback of marginalized kernel is the phenomenon of
“tottering”, that is, the kernel counts common walks that exist repetitions of vertices. Recall
that how a random walk is generated, one may notice that a walk can come back to the vertex
it just visited. Hence a small common substructure can cause very large similarity, while
the molecules are indeed very different. Methods have been come up to prevent tottering.
However, the empirical evidence showed that it did not lead to significant improvement (Mah´e
et al., 2004). Hence, we did not use the modified version. The definition of tree pattern for
subtree kernel indicates that it also allows for repetitions of vertices, we tested the kernel based
on non-tottering tree pattern and found that it did not improve the regression results, but
dramatically increased the computing time.
Tanimoto kernel is not the only kernel that uses measures of similarity between fingerprints.
If the binary path indicators are replaced with path counts, we get MinMax kernel (Ralaivola
et al., 2005). One may argue that the path counts are more reliable than binary indicators,
but our experiment results showed that MinMax kernel had much worse performance. It was
consistent with the fact that Tanimoto kernel is the most widely used kernel for fingerprints.
In addition to the kernel methods we investigated, there exist a large number of graph kernels
for defining similarity that tackle the same problem from different approaches. The connection
between an atom and its neighbors was used as a notion to measure similarity (El-Atta et al.,
(Neuhaus and Bunke, 2007). A combination of deep learning techniques and kernel methods
(Yanardag and Vishwanathan, 2015) has become very popular in recent years. We tried the
graph neural fingerprints with neural network this time, yet we did not investigate how the
model architecture influenced the prediction results and why such method failed to provide
superior performance using our datasets. As methods based on local patterns tend to overlook
global information of a graph, it remains a challenge to see how more advanced graph kernels
perform in our experiment.
Another major issue is that we conducted the experiment from the statistical perspective,
hence we lacked the chemistry knowledge to interpret the results and understand why specific
methods are more appropriate for some datasets. The relation between chemical features and
kernel methods is worth further investigation.
5
User Manual
Our application requires a csv file as input file. It should contain the SMILES representation of
molecules and the corresponding label (activation energy in our case). The format need to be
consistent with the example file (one molecule and one label per line). The path of input file,
the feature name (usually ”smiles”), and the label name should be specified before execution.
The class Kernel is the main part of the project. There are two customized ways to
initialize it: 1) through computation using SMILES, 2) precompute the gram matrix and read
from existing files. The second method is used for sepctrum kernel, marginalized kernel and
subtree kernel since there are R packages available for their implementation. The classKernel
allows the user to apply kernel ridge regression and evaluate the prediction with gram matrix.
The normalized version are used for all kernels. Given inputxand y, we have:
Knorm(x, y) = √ K(x,y)
K(x,x)·K(y,y).
We used packages such asKernlab,RchemcppandRDKit for kenrel computation and finger-prints generation. We usedOpenBabelfor file format conversion. The implementation of neural graph fingerprints is available at: HIPS/neural-fingerprint. We slightly modified their code for
computing R2. Our code can be accessed at: chemical-kernels. Before running the program,
Python Numpy, Scipy, Sklearn, RDKit, Autograd
R kernlab, Rchemcpp, MASS
5.1
String Kernels
Define the input spaceX of all finite length sequences of characters from an alphabetA,|A|=l.
The k-spectrum of an input text refers to the set of all the contiguous sequences (substring) of
lengthkthat it contains, given ak≥1. In comparison, a subsequence of lengthkis any ordered
sequence of k characters occurring in the input text though not necessarily contiguously.
5.1.1 Spectrum Kernel
The spectrum kernel (Leslie et al., 2001) is a simple string kernel that computes similarities
between two inputs based on counts of common contiguous sequences. The feature space is
indexed by all possible sequences aof length k from alphabet A. The embedding from X to
Rlk is defined as:
Φk(x) = (φa(x))a∈Ak,
where φa(x) is the number of times substring a occurs in x ∈ X. The k-spectrum kernel is
defined as:
Kk(x, y) =hΦk(x),Φk(y)i.
In our R script, we define a function spectrum, relying on R packagekernlab.
Arguments
k length of substring
input path path of input file, the file should be in smi format
output path path of output file
Examples
spectrum(4, ”data/cl.smi”, ”data/spectrum.txt”)
5.1.2 Mismatch Kernel
The feature space of mismatch kernel (Leslie et al., 2004) is the same as that of spectrum
kernel. Compared with spectrum kernel, mismatch kernel allows some degree of mismatching
allk-length sequencesbfrom Athat differ fromaby at mostmmismatches. Hence we define
Φk,monaby:
Φk,m(a) = (φb(a))b∈Ak.
The mapping onx∈ X is defined as:
Φk(x) =Pa∈xΦk,m(a).
So we have the (k, m)-mismatch kernel:
K(k,m)(x, y) =
Φ(k,m)(x),Φ(k,m)(y)
.
In our Python script, we define a classKernelwhere mismatch kernel can be initialized by
calling Kernel.from smi(*,’mismatch’).
Arguments
smiles input array, in SMILES format
y true target array
k length of substring, default = 5
m number of mismatches allowed, default = 1
Return Value
TheKernelclass object
Examples
Kernel.from smi(smiles, y true, ”mismatch”, k=4, m=2)
5.1.3 String Subsequence Kernel
The string subsequence kernel (Lodhi et al., 2002) counts common subsequences (allowing
gaps) rather than substrings. Instead of weighting the occurrence equally, it assigns higher
weights to subsequences that are more contiguous with by means of the decay factorλ∈(0,1).
Hence, higher degree of contiguity and more subsequences in common results in higher similarity
between two strings.
Leti= (i1, ...in) be a set of indices (sorted in ascending order) in stringsand a subsequence
is given byu=s(i), length of subsequence insisl(i) =in−i1+ 1. The mapping is:
φp u(s) =
P
i:u=s(i)λ
l(i)
for every subsequenceuof length p ins.
The SSK then is given by:
In our Python script, we define a classKernel where mismatch kernel can be initialized by
calling Kernel.from smi(*,’subsequence’).
Arguments
smiles input array, in SMILES format
y true target array
p length of subsequence, default = 4
lamda decay factor, default = 0.8
Return Value
TheKernelclass object
Examples
Kernel.from smi(smiles, y true, ”subsequence”, p=3, lambda=0.7)
5.2
Graph Kernels
All the graph kernels introduced in this analysis are molecular fragments based. The similarity
of molecular structures is evaluated based on graphical features such as walks (marginalized
kernel), paths(Tanimoto kernel) and trees(subtree kernel).
5.2.1 Marginalized Kernel
Marignalized graph kernel (Kashima et al., 2003) counts the number of common label sequences
weighted by the probability of the corresponding walk. It is also called random walk kernel
because of the mechanism of generating walks.
Given a graphx, a label sequencehis generated in the following way: the starting pointh1is
sampled from the initial probability distributionps(h1), which is usually uniform distribution.
Each subsequent vertex is sampled subject to the transition probability pt(hi|h(i−1)) at i-th
step, which is usually uniform distribution over the adjacent vertices, and the walk stops with
probability pq(h(i−1)), which is usually between 0.1 and 0.2. After this process, the walk l is
generated and the corresponding labels are described as vh1,eh1,vh2,eh2,vh3...
The mapping is given by:
Φp(x) =Pl∈L(x)wl(x)1(l=p),
whereL(x) is the set of all possible walks of graphx, andwl(x) is the probability that the walk
l match the given walkp.
The marginalized kernel is:
Kp(x, y) =hΦp(x),Φp(y)i.
We directly use the Rchemcpp package here. In most cases we are interested only in the argumentstopP.
Examples
mat = sd2gram(”data/cl.smi”, stopP=0.1)
write.matrix(mat,”data/cl randomwalk 0.1.txt”)
5.2.2 Subtree Kernel
Significant information loss occurs when graphs are described by only linear features. In
com-parison, tree structure has better expressivity since physicochemical properties of atoms are
known to be related to their topological environment.
A tree pattern (Mah´e and Vert, 2009) is define to be a combination of graph vertices that can
be arranged in a particular tree structure in a labeled directed graph. A tree-pattern counting
function returning the number of times a tree-pattern occurs in a graph. Given two graphsx
andy, the subtree kernel is defined as:
K(x, y) =P
t∈T w(t)ψt(x)ψt(y),
whereT is a set of all possible subtrees,w:T →R+ is non-negative weighting functional and
ψtis the tree pattern counting function.
Two types of subtree kernel are introduced based on different weighting functional. The
first one is called size-based balanced tree-pattern kernel, which is defined as:
Kh
size(x, y) =
P
t∈Bhλ
|t|−hψt(x)ψt(y).
Another is called branch-based balanced tree-pattern kernel, which is defined as:
Kh
branch(x, y) =
P
t∈Bhλ
branch(t)ψ
t(x)ψt(y),
where Bh refers to the space indexed by the set of balanced trees of orderh. The size|t|of a
tree t means the number of nodes. The branch cardinalitybranch(t) of a tree t is defined as
its number of leaf nodes minus one. Larger size or higher branch cardinality indicates higher
complexity of a tree. The increasing complexity of a tree pattern is penalized by a value ofλ
smaller than 1.
we are interested in two arguments depthMax and lambda. We used size-based balanced
tree-pattern kernel in our analysis, but one can easily switch to branch-based by setting
ker-nelType.
Examples
mat = sd2gramSubtree(”data/cl.smi”, depthMax = 3, lambda = 0.1)
write.matrix(mat,”data/cl subtree 3 0.1.txt”)
5.2.3 Tanimoto Kernel
Tanimoto kernel (Ralaivola et al., 2005) is a method to measure similarities between molecules
using fingerprints. The embedding Φp(x) is given by indicator function 1(p ∈ x), showing
whether labeled pathpoccurs in the graphxor not.
The associated kernel is defined as:
K(x, y) =P
pinPΦp(x)Φp(y),
whereP is the set of all possible labeled paths (up to a given length).
The Taminoto kernel usually refers to the normalized version:
KT animoto(x, y) =K(x,x)+KK((x,yy,y)−) K(x,y).
For Daylight fingerprints, you may want to change the argumentmaxPath.
Arguments
smiles input array, in SMILES format
y true target array
maxPath maximum length of path enumerated, default = 5
Return Value
TheKernelclass object
Examples
Kernel.from smi(smiles, y true, ”linear fp”, maxPath = 7)
For Morgan fingerprints, you may want to change the number of iterations or maximum
radius by the argument radius. Note that we usually set radius to 2 since two iterations is
typically sufficient for fingerprints that will be used for similarity or clustering (Rogers & Hahn,
Arguments
smiles input array, in SMILES format
y true target array
radius maximum radius of circular fragments, default = 2
Return Value
TheKernelclass object
Examples
References
Borgwardt, K. M., Ong, C. S., Sch¨onauer, S., Vishwanathan, S., Smola, A. J., and Kriegel, H.-P.
(2005). Protein function prediction via graph kernels. Bioinformatics, 21(suppl 1):i47–i56.
Caelli, T. and Kosinov, S. (2004). An eigenspace projection clustering method for inexact graph
matching. IEEE transactions on pattern analysis and machine intelligence, 26(4):515–519.
Cereto-Massagu´e, A., Ojeda, M. J., Valls, C., Mulero, M., Garcia-Vallv´e, S., and Pujadas, G.
(2015). Molecular fingerprint similarity search in virtual screening. Methods, 71:58–63.
Cherqaoui, D. and Villemin, D. (1994). Use of a neural network to determine the boiling point
of alkanes. Journal of the Chemical Society, Faraday Transactions, 90(1):97–102.
Duvenaud, D. K., Maclaurin, D., Iparraguirre, J., Bombarell, R., Hirzel, T., Aspuru-Guzik,
A., and Adams, R. P. (2015). Convolutional networks on graphs for learning molecular
fingerprints. InAdvances in neural information processing systems, pages 2224–2232.
El-Atta, A. H. A., Moussa, M. I., and Hassanien, A. E. (2015). Predicting activity approach
based on new atoms similarity kernel function.Journal of Molecular Graphics and Modelling, 60:55–62.
Ga¨uzere, B., Brun, L., and Villemin, D. (2012). Two new graphs kernels in chemoinformatics.
Pattern Recognition Letters, 33(15):2038–2047.
Horv´ath, T., G¨artner, T., and Wrobel, S. (2004). Cyclic pattern kernels for predictive graph
mining. In Proceedings of the tenth ACM SIGKDD international conference on Knowledge discovery and data mining, pages 158–167. ACM.
Kashima, H., Tsuda, K., and Inokuchi, A. (2003). Marginalized kernels between labeled graphs.
In Proceedings of the 20th international conference on machine learning (ICML-03), pages 321–328.
Leslie, C., Eskin, E., and Noble, W. S. (2001). The spectrum kernel: A string kernel for svm
protein classification. InBiocomputing 2002, pages 564–575. World Scientific.
Leslie, C. S., Eskin, E., Cohen, A., Weston, J., and Noble, W. S. (2004). Mismatch string
Lodhi, H., Saunders, C., Shawe-Taylor, J., Cristianini, N., and Watkins, C. (2002). Text
classification using string kernels. Journal of Machine Learning Research, 2(Feb):419–444.
Mah´e, P., Ueda, N., Akutsu, T., Perret, J.-L., and Vert, J.-P. (2004). Extensions of marginalized
graph kernels. InProceedings of the twenty-first international conference on Machine learning, page 70. ACM.
Mah´e, P. and Vert, J.-P. (2009). Graph kernels based on tree patterns for molecules. Machine learning, 75(1):3–35.
Neuhaus, M. and Bunke, H. (2006). Edit distance-based kernel functions for structural pattern
classification. Pattern Recognition, 39(10):1852–1863.
Neuhaus, M. and Bunke, H. (2007). Bridging the gap between graph edit distance and kernel machines, volume 68. World Scientific.
Ralaivola, L., Swamidass, S. J., Saigo, H., and Baldi, P. (2005). Graph kernels for chemical
informatics. Neural networks, 18(8):1093–1110.
Ramon, J. and G¨artner, T. (2003). Expressivity versus efficiency of graph kernels. InProceedings of the first international workshop on mining graphs, trees and sequences, pages 65–74.
Rogers, D. and Hahn, M. (2010). Extended-connectivity fingerprints. Journal of chemical information and modeling, 50(5):742–754.
Sch¨utt, K. T., Arbabzadah, F., Chmiela, S., M¨uller, K. R., and Tkatchenko, A. (2017).
Quantum-chemical insights from deep tensor neural networks. Nature communications, 8:13890.
Weininger, D. (1988). Smiles, a chemical language and information system. 1. introduction to
methodology and encoding rules. Journal of chemical information and computer sciences, 28(1):31–36.