cell function
Hongyu Luo, … , Johanne Tremblay, Jiangping Wu
J Clin Invest.
2004;
114(12)
:1762-1773.
https://doi.org/10.1172/JCI21846
.
So far, there is very limited knowledge about the role of Eph kinases, the largest family of
receptor tyrosine kinases, in the immune system. Here, using
EphB6
–/–mice, we
demonstrated that in vitro and in vivo T cell responses such as lymphokine secretion,
proliferation, and the development of delayed-type skin hypersensitivity and experimental
autoimmune encephalitis in
EphB6
–/–mice were compromised. On the other hand, humoral
immune responses, such as serum levels of different Ig isotypes and IgG response to
tetanus toxoid, were normal in these mice. Mechanistically, we showed that EphB6
migrated to the aggregated TCRs and rafts after TCR activation. Further downstream, in the
absence of EphB6, ZAP-70 activation, LAT phosphorylation, the association of PLC
g
1 with
SLP-76, and p44/42 MAPK activation were diminished. Thus, we have shown that EphB6 is
pivotal in T cell function.
Article
Immunology
Find the latest version:
Research article
EphB6
-null mutation results in
compromised T cell function
Hongyu Luo,1 Guang Yu,1 Johanne Tremblay,2 and Jiangping Wu1,3
1Laboratory of Immunology, Centre de Recherché, 2Laboratory of Cardiovascular Research, and 3Nephrology Service, Centre Hospitalier de l’Université de Montréal, Montréal, Québec, Canada.
So far, there is very limited knowledge about the role of Eph kinases, the largest family of receptor tyrosine
kinases, in the immune system. Here, using
EphB6
–/–mice, we demonstrated that in vitro and in vivo T cell
responses such as lymphokine secretion, proliferation, and the development of delayed-type skin
hypersen-sitivity and experimental autoimmune encephalitis in
EphB6
–/–mice were compromised. On the other hand,
humoral immune responses, such as serum levels of different Ig isotypes and IgG response to tetanus toxoid,
were normal in these mice. Mechanistically, we showed that EphB6 migrated to the aggregated TCRs and rafts
after TCR activation. Further downstream, in the absence of EphB6, ZAP-70 activation, LAT phosphorylation,
the association of PLC
γ
1 with SLP-76, and p44/42 MAPK activation were diminished. Thus, we have shown
that EphB6 is pivotal in T cell function.
Introduction
Erythropoietin-producing hepatocyte (Eph) kinases are the larg-est family of cell surface receptor tyrosine kinases. Their ligands, called ephrins (EFNs), are also cell surface molecules (1). Eph kinases are classified into A and B subfamilies according to the sequence homology; the former has 9 members (EphA1–9) (1), and the latter, 6 members (EphB1–6) (1). EFNs are also grouped into A and B subfamilies: the former has 6 members (EFNA1–6), which are GPI-anchored membrane proteins; the latter has 3 members (EFNB1–3), which are transmembrane proteins (1, 2). Although they are ligands, EFNBs can also transduce signals reversely into cells (2, 3). As human genome sequences have revealed 14 Eph entries and 8 EFN entries (4), it is likely that most Eph kinases and EFNs have already been identified. Eph kinases and EFNs have loose specificity. In general, EphAs interact with multiple EFNA ligands, and EphBs with multiple EFNB ligands (2, 3), although a few exceptions are observed (4, 5).
Since Eph kinases and EFNs are cell surface molecules, their interaction is restricted to adjacent cells; not surprisingly, there is a large body of evidence showing that these kinases and ligands guide cell pattern formation during tissue and organ develop-ment (3, 6–10). Much of the evidence derives from studies on the CNS, where many Eph kinases and EFNs have high levels of expression and are found to guide or repel neuron outgrowth (3, 6–10). EphB4 and its ligand EFNB2 are also essential in capillary network formation during angiogenesis (11). Recently, EphB2 and EphB3 were found to be critical in controlling cell position-ing in the intestinal epithelium (12).
Some Eph kinases and EFNs are expressed in immune organs and leukocytes. EphA1 (13), EphA2 (14), EphA3 and EphA4 (15), EphB2 (16), EphB4 (17), and EphB6 (18) are expressed in the thymus. EphB6 is expressed on mature T cells (19, 20). EphA3 is
expressed in pre-B cell lines (13), and EphA4 and EphA7 are sig-nificantly expressed in B cells (21). EphA2 (21) and EphB1 (22) are expressed in certain types of dendritic cells. Some Ephs, such as EphA3 (23), EphB4 (24), and EphB6 (20, 25), are expressed in leukemia cells. As for EFNs, EFNA1 (26), EFNA3 and EFNB1 (27), and EFNA2, EFNA4, and EFNA5 (15) are expressed in the thymus, and EFNA4 can be detected in peripheral T and B cells (21).
Despite the expression of some Eph kinases and EFNs in the immune system, an understanding of their roles in immune regu-lation has only just begun, and limited publications are available in this regard (15, 19, 25, 28–30). We recently explored EphB6 function in T cell function in vitro. EphB6 cross-linking by mAbs results in Jurkat cell apoptosis (25). In normal resting human T cells, such cross-linking enhances the T cell response to TCR liga-tion (19). Solid-phase EFNB2 and EFNB3, which are ligands of EphB6, similarly enhance the T cell response, as with mAbs (28, 31). Munoz et al. reported that soluble EphA1, EphA2, EphA3, and EFNA1 induce thymocyte death in rat thymic organ culture (15). Sharfe et al. documented that EFNA1 modulates T cell chemotaxis toward SDF-1α in vitro (29). However, so far, no in vivo functional study has been reported on the roles of any Eph kinase or EFNs in immune regulation.
Here, we generated EphB6–/– mice to investigate EphB6
func-tions in immune responses, and to explore the signaling pathway of EphB6. The lack of EphB6 gene product in these mice allowed us to distinguish the role of EphB6 from those of other Eph family members, which often have overlapping functions.
Results
Generation of EphB6–/– mice. The targeting construct to generate
EphB6–/– mice is illustrated in Figure 1A. A segment starting from
exon III, which contains the start codon until the end of intron IV in the EphB6 gene, was replaced by a GFP and neomycin expression cassette. Strain 129/sv embryonic stem cells were transfected with the targeting construct, selected with G418, and screened by PCR. Correctly targeted clones were injected into C57BL/6 blastocysts. Two chimeric mice were obtained; both achieved germ-line trans-mission. Offspring from 1 chimeric founder was expanded. Tail DNA was digested with HindIII and analyzed by Southern blotting
Nonstandard abbreviations used: DP, double positive; DTH, delayed-type hypersensitivity; EAE, experimental autoimmune encephalitis; EFN, ephrin; Eph, erythropoietin-producing hepatocyte; SP, single positive; TT, tetanus toxoid.
Conflict of interest: The authors have declared that no conflict of interest exists.
(Figure 1B). Deletion of exons III and IV was confirmed by a 6.6-kb band, while the WT allele was detected as a 10-6.6-kb band. PCR was used for routine genotyping of EphB6 mutants. The primer pair PTK3 and TK15 was used to detect a 1.6-kb band derived from the WT allele, and the primer pair Neo1 and TK15 was applied to detect a 1.2-kb band derived from the mutated allele (Figure 1B). The EphB6–/– mice generated not only had null EphB6 expression
but also presented EphB6 promoter–driven GFP expression. In most experiments involving EphB6–/– mice, WT littermates served
as controls, unless described otherwise.
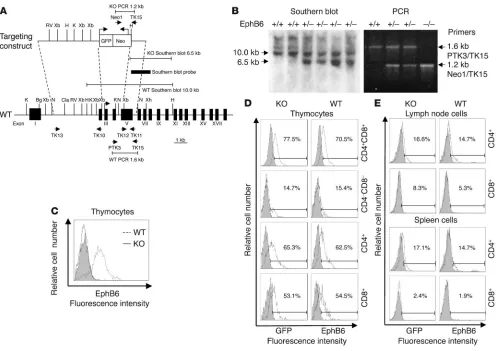
EphB6 expression on thymocyte and mature T cell surfaces was examined by flow cytometry. High EphB6 expression was detected in WT but not in EphB6–/– thymocytes, as illustrated in
Figure 1C. This confirms that EphB6 gene expression had been successfully knocked out at the protein level. Figure 1D (right column) reveals that in thymocytes, CD4+CD8+ double positive
(DP) cells had the highest EphB6 expression (70.5% positive), fol-lowed by CD4+ single positive (SP) cells (62.5%) and then CD8+
SP cells (54.5%). EphB6 expression in CD4–CD8– double negative
cells was relatively low (15.4%). Such an order of expression was mirrored by EphB6 promoter–driven GFP expression in all these
thymocyte subpopulations (Figure 1D, left column): 77.5% GFP+
in CD4+CD8+ cells, 65.3% GFP+ in CD4+ SP cells, 53.1% GFP+ in
CD8+ SP cells, and 14.7% GFP+ in CD4–CD8– cells. In mature T
cells, EphB6 surface expression was lower than in thymocytes. As
[image:3.585.44.540.80.431.2]shown in Figure 1E (right column), lymph node CD4+ cells and
Figure 1
Generation of EphB6–/– mice. (A) Illustration of the targeting construct, primers, and probes. Primer pairs TK13/TK10 and TK12/TK11 were used to retrieve genomic sequences with PCR for the targeting construct. Primer pair Neo1/TK15 was applied to identify a 1.2-kb fragment derived from the targeted allele with PCR, and primer pair PTK3/TK15 served to identify a 1.6-kb fragment derived from the WT allele. The region of the Southern probe is shown as a thick bar; the null-mutated allele was detected as a 6.6-kb band and the WT allele as a 10.0-kb band. Primer pairs are shown as arrows. K, KpnI; Bg, BGIII; N, NcoI; Cla, ClaI; Xb, XbaI; Xh, XhoI; RV, EcoRV; H, HindIII. (B) Genotyping of EphB6–/–, EphB6+/–, and EphB6+/+ mice by Southern blotting and PCR with tail DNA. (C) Lack of EphB6 protein expression on EphB6–/– thymocytes. EphB6+/+ (dot-ted line) and EphB6–/– (solid line) thymocytes were stained with goat anti–mouse EphB6, followed by PE-conjugated donkey anti-goat IgG. The shaded area represents the isotypic control (goat IgG). (D and E) EphB6 expression in thymocytes and lymph node and spleen T cells from
research article
CD8+ cells were 14.7% and 5.3% EphB6+, respectively; spleen CD4+
cells and CD8+ cells were 14.7% and 1.9% EphB6+, respectively.
Again, the pattern of expression was consistent with that of EphB6 promoter–driven GFP expression (Figure 1E, left column). These data indicate that EphB6-null mutation results in loss of EphB6 expression at the protein level. In WT mice, EphB6 expression is very high in CD4+CD8+ DP, CD4+ SP, and CD8+ SP thymocytes;
once T cells mature, their EphB6 expression decreases, with CD4+
cells expressing more EphB6 than CD8+ cells.
General status of EphB6–/– mice. EphB6–/– mice were fertile and had
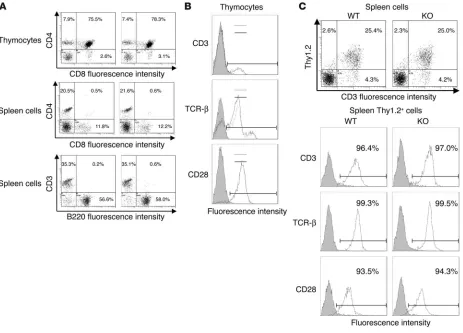
no visible anomaly upon visual inspection. Their lymphoid organs were of normal size and cellularity, compared with those of WT littermates (data not shown). In EphB6–/– mice, the CD4+ SP, CD8+
SP, and CD4+CD8+ DP populations in the EphB6–/– thymus, the
CD4+ and CD8+ populations in the spleen, and the T cell (CD3+)
versus B cell (B220+) ratio in the spleen were similar to those in WT
mice (Figure 2A). The percentages of monocytes/macrophages and polymorph nuclear cells in the EphB6–/– spleen were in the normal
range (data not shown). The EphB6–/– and EphB6+/+ thymocytes
had similar levels of CD3, TCR-β, and CD28 levels (Figure 2B). CD3, TCR-β, and CD28 intensity and percentage in the Thy1.2+ T
cell population were similar in EphB6–/– and EphB6+/+ spleen cells
(Figure 2C). The blood biochemistry parameters of EphB6–/– mice,
such as aspartate aminotransferase, alanine aminotransferase, total bilirubin, albumin, alkaline phosphatase, triglycerides, urea, creatinine, amylase, glucose, and creatine kinase, were tested for possible liver, kidney, pancreas, and heart abnormalities, but these parameters were all in a range similar to that in WT mice (data not shown). The pancreata of EphB6–/– mice had normal islet
struc-ture, and the islets of EphB6–/– mice released insulin normally upon
glucose challenge (data not shown). There was no abnormal iron deposition in heart or liver (data not shown). The EphB6–/– mice
performed normally in rotarod and edge-exploration tests, which indicates that neurological functions reflected by these tests were not compromised in these mice.
Compromised in vitro function of EphB6–/– T cells. To gain an
in-depth understanding of EphB6 function in the immune system, we first compared EphB6+/+ and EphB6–/– spleen T cells for their
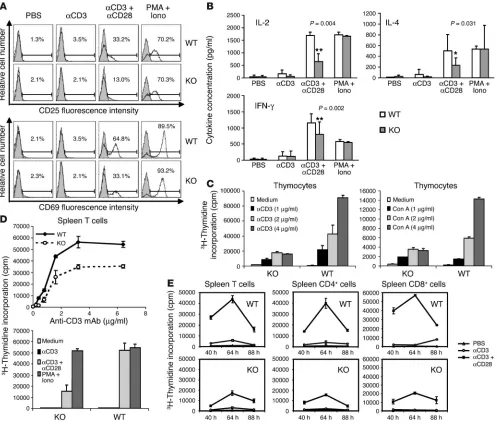
CD25 and CD69 expression upon activation by solid-phase anti-CD3 Ab (at a suboptimal concentration) and anti-CD28 Ab. As shown in Figure 3A, anti-CD3 Ab alone at low concentration did not affect CD25 or CD69 expression in T cells. A combi-nation of anti-CD3 and anti-CD28 Abs prominently enhanced CD25 and CD69 expression in EphB6+/+ T cells (33.2% and 64.8%,
[image:4.585.64.527.82.415.2]respectively) at 24 hours but failed to significantly augment CD25 (13.0%) and only partially upregulated CD69 (33.1%) in
Figure 2
EphB6–/– T cells. This was not due to a shift of expression
kinet-ics in the EphB6–/– T cells, since at 48 hours, these molecules
were not further upregulated (data not shown). Ionomycin and
PMA stimulation overcame the defect in EphB6–/– T cells and
upregulated their CD25 and CD69 to levels comparable to those of EphB6+/+ T cells (Figure 3A, last column). On the other hand,
there was no discernible difference in the expression of CD54
and CD44 between EphB6–/– and EphB6+/+ spleen T cells, either
before or after TCR activation (data not shown). Since EphB6–/–
and EphB6+/+ T cells had similar levels of CD3 and C28, the CD3
and CD28 expression did not affect the results of this or of other experiments using anti-CD3 and anti-CD28 stimulation. These data demonstrate that EphB6–/– T cells are defective in
[image:5.585.47.544.82.507.2]expres-sion of certain early activation markers.
Figure 3
Compromised in vitro function of EphB6–/– T cells. (A) CD25 and CD69 expression according to flow cytometry. Purified spleen T cells from EphB6–/– or WT mice were cultured in wells precoated with PBS, anti-CD3 mAb (suboptimal), anti-CD3 mAb (suboptimal) plus anti-CD28 mAb, or PMA plus ionomycin (iono), as indicated. CD25 and CD69 expression was assessed after 24 hours by 2-color flow cytometry. The percentages represent posi-tive populations among Thy1.2+ cells, after deduction of background staining (shaded areas; isotypic Ab). (B) Lymphokine production by EphB6–/– and
EphB6+/+ T cells. Supernatants of T cell cultures were collected after 48 hours, and IL-2, IL-4, and IFN-γ in the supernatants were measured by ELISA. Samples were in duplicate. The pooled results of 7 independent experiments are shown. Paired Student’s t test was performed. *Significant difference (P < 0.05). **Highly significant difference (P < 0.01). (C–E) Proliferation of EphB6–/– and EphB6+/+ thymocytes and spleen T cells. (C) Thymocytes from
research article
The secretion of lymphokines by EphB6+/+ and EphB6–/– spleen T
cells was assessed next. To mimic the physiological condition of T cell activation, a suboptimal concentration of solid-phase CD3 along with an optimal concentration of solid-phase anti-CD28 was used to stimulate IL-2, IL-4, and IFN-γ production by
EphB6–/– and WT T cells. Under such a condition, EphB6–/– T cells
had reduced IL-2, IL-4, and IFN-γ secretion at 48 hours after the activation, compared with that by EphB6+/+ T cells (Figure 3B);
this indicates an important role of EphB6 in secretion of these lymphokines. The reduced lymphokine levels were not due to an increased consumption by the T cells or a kinetic shift in the lymphokine secretion, since for both EphB6–/– and EphB6+/+
T cells, the secretion of these lymphokines was always lower at 24 hours or 72 hours than at 48 hours (data not shown). PMA and ionomycin overcame the defect of cytokine secretion in the
EphB6–/– T cells (Figure 3B).
Next, the proliferation of EphB6–/– thymocytes and T cells was
investigated. As seen in Figure 3C, EphB6–/– thymocytes presented
compromised proliferative responses to stimulation with vari-ous concentrations of either solid-phase anti-CD3 Ab (left panel) or soluble concanavalin A (Con A; right panel), compared with
EphB6+/+ littermate thymocytes, when assayed at 72 hours after the
activation. Again, the compromised proliferation was not due to a kinetic shift, since the proliferation measured at 48 hours or 96 hours presented a similar pattern, albeit with decreased counts per minute, in all the groups tested (data not shown).
Purified EphB6+/+ spleen T cells strongly and dose-dependently
responded to stimulation of solid-phase anti-CD3, but such response was diminished with EphB6–/– spleen T cells (Figure 3D,
upper panel). When stimulated with a suboptimal concentration of solid-phase anti-CD3 Ab plus an optimal concentration of solid-phase anti-CD28 Ab, EphB6–/– T cells showed significantly
compromised proliferation compared with EphB6+/+ littermate T
cells, which proliferated vigorously (Figure 3D, lower panel; Figure 3E, left column). The difference was not due to a kinetic shift, as proliferation of EphB6–/– T cells from 40 hours to 88 hours after
culture was always lower than that of EphB6+/+ T cells. PMA and
ionomycin effectively rescued the defective proliferation of EphB6–/–
T cells (Figure 3D, lower panel). The compromise occurred in both
EphB6–/– CD4 and EphB6–/– CD8 cells, as depicted the last 2
[image:6.585.74.514.81.364.2]col-umns in Figure 3E. These results indicate that EphB6 is critical for optimal T cell proliferation in vitro.
Figure 4
EphB6 was essential for DTH and EAE, but not humoral immune response. (A) DTH against FITC was reduced in EphB6–/– mice. EphB6–/– mice (n = 9) and their WT littermates (n = 7) were assayed for DTH against FITC. The increase of ear thickness of each mouse is presented, and horizontal bars mark the median increase. The difference between the 2 groups was statistically significant (P < 0.05, 2-tailed Student’s t test). (B) Reduced severity of EAE development in EphB6–/– mice. EAE was induced in EphB6–/– mice (n = 14) and their WT littermates (n = 14), and its clinical manifestation was scored daily in a 2-way blind fashion. The percentage of mice in each group with severe EAE was plotted. From day 14 to day 35, the difference of disease severity in the 2 groups was statistically significant (P < 0.05, Mann-Whitney rank sum test). (C and
D) Serum Ab isotype levels in EphB6–/– mice were similar to those in EphB6+/+ mice. Serum Ab isotypes, as indicated, of EphB6–/– and EphB6+/+ mice were measured by ELISA, and means ± SD are shown. There were no significant differences in the Ab isotype levels between EphB6+/+ and EphB6–/– mice (P > 0.05 for all the comparisons, Student’s t test). (E) No significant difference in anti-TT Ab production between EphB6–/– and
Defective in vivo cellular, but not humoral, immune responses in EphB6–/–
mice. We investigated, for the first time to our knowledge, the in vivo
function of an Eph kinase in the immune system, using EphB6–/–
mice. The cellular immune response was first studied by an in vivo assay for delayed-type hypersensitivity (DTH). The mice were paint-ed with FITC on their shavpaint-ed abdomens, and 7 days later, their ears were restimulated with FITC. Ear thickness was measured immedi-ately before and 24 hours after painting. The increase in ear thick-ness is plotted in Figure 4A. The results showed that EphB6–/– mouse
ears had significantly reduced swelling, a sign of compromised DTH response (P < 0.05, 2-tailed Student’s t test).
The cellular immune response of EphB6–/– mice was also
investi-gated in an experimental autoimmune encephalitis (EAE) model. Female EphB6–/– and EphB6+/+ mice were immunized with MOG
35–55
twice at a 1-week interval, and EAE development was scored in a double-blind fashion. The incidence of severe EAE (with scores equal to or higher than 5) was registered and is plotted in Figure 4B. Although both EphB6+/+ and EphB6–/– mice showed
compara-ble speed of EAE onset, the latter presented significantly reduced severity (P < 0.05, Mann-Whitney rank sum test), starting from day 14. This result indicates again that the cellular immune response in EphB6–/– mice is compromised.
To evaluate whether EphB6 was important in humoral immune responses and Ig isotype switching, serum levels of different Ig isotypes in EphB6–/– and EphB6+/+ mice were measured. As shown in
Figure 4, C and D, serum levels of IgG1, IgG2a, IgG2b, IgG3, IgA,
IgM, and IgE of the EphB6–/– mice were not significantly different
from those of EphB6+/+ mice. Antigen-specific humoral response was
next assessed. EphB6–/– mice and their WT littermates were
immu-nized with tetanus toxoid (TT). As shown in Figure 4E, EphB6–/– and
EphB6+/+ mice had similar levels of anti-TT IgG levels on days 1, 11,
18, 25, 32, and 39 after the immunization (Figure 4E). These data suggest that the role of EphB6 in the humoral immune response is limited, that it does not affect B cell isotype switching, and that it has no significant effect on the Th1/Th2 balance.
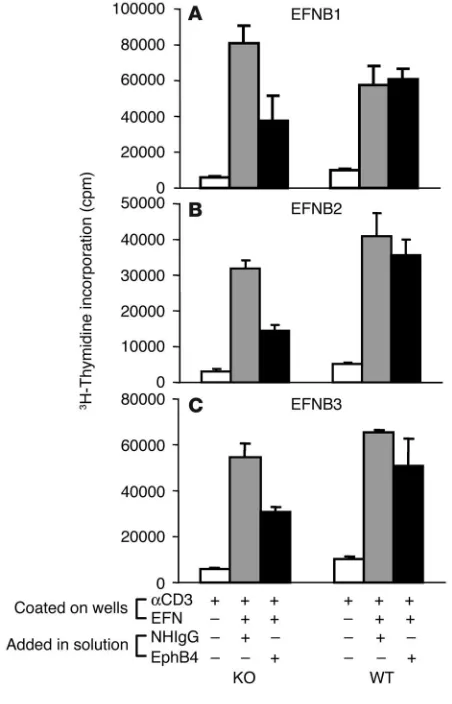
The signaling mechanisms of EphB6. EphB6 is known to interact with EFNB2 in in vitro binding assays (32); it has been reported that EphB6 could also form dimers with EphB1, which could in turn interact with EFNB1 (33). We investigated which EFNB(s) could trigger T cell costimulation via EphB6. EFNB1, EFNB2, and EFNB3 were coated on wells in the presence of a suboptimal con-centration of solid-phase anti-CD3. They could all enhance WT T cell response to the suboptimal anti-CD3 stimulation (Figure 5, A–C, WT column, white bars versus gray bars). Interestingly, these EFNBs could similarly enhance EphB6–/– T cell response to the
sub-optimal anti-CD3 stimulation (Figure 5, A–C, KO column, white bars versus gray bars), which suggests that EphB6 is not obligatory for the costimulation initiated by EFNB1, EFNB2, and EFNB3, and that other EphB members are involved in such costimulation. EphB4 is one of the other EphB family members known to be expressed in the T cell compartment (34). We therefore added sol-uble EphB4 to the culture to block the interaction between EFNBs and EphB4. As shown in the KO column of Figure 5, A–C, the costimulation of EphB6–/– T cells by all 3 of these EFNBs (Figure
5, A–C, KO column, gray bars versus black bars) was repressed in the presence of soluble EphB4, which shows that the elimination of both EphB6 (by null mutation) and EphB4 (by blocking with the soluble EphB4) compromised T cell response to the EFNB1, EFNB2, and EFNB3 costimulation. However, soluble EphB4 alone did not block EFNB1-, EFNB2-, or EFNB3-costimulated EphB6+/+ T
cell proliferation (Figure 5, A–C, WT column, gray bars versus black bars), probably because of the existence of EphB6 or additional Ephs on T cells. This finding indicates that EphB6 is involved in the EFNB1-, EFNB2-, and EFNB3-triggered T cell costimulation; that EphB4 has overlapping function with EphB6 in this regard; and that the role of EphB6 and EphB4 in such costimulation can be revealed only if both EphB6 and EphB4 are incapacitated.
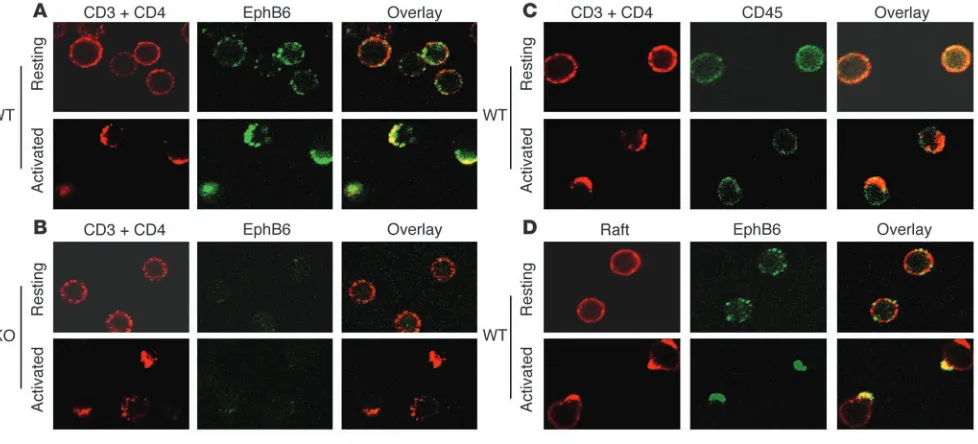
To understand the mechanisms of EphB6 in augmenting TCR signaling, we assessed the interaction between EphB6 and TCR using confocal microscopy (Figure 6). For this purpose, thymocytes were used, since they had higher EphB6 expression than mature T cells. In unstimulated EphB6+/+ thymocytes (Figure
[image:7.585.51.277.83.435.2]6A, top middle panel, WT resting cells), EphB6 was evenly distrib-uted on the cell surface, as was CD45 (Figure 6C, top right panel). EphB6, as expected, was not detectable in either unstimulated or activated EphB6–/– cells (Figure 6B, middle column, KO resting
Figure 5
research article
and activated cells), and this proved the specificity of the anti-EphB6 Ab. After the thymocytes were cross-linked with anti-CD3 and anti-CD4 for 2 minutes at 37°C, the TCR complex (accord-ing to anti-CD3 and anti-CD4 stain(accord-ing) rapidly formed capp(accord-ing on 1 side of the cell surface (Figure 6A–C, bottom left panels). EphB6 migrated to the capping at the same time (Figure 6A, bottom middle panel), while the control surface marker CD45 remained evenly distributed (Figure 6C, bottom middle panel); this indicates that cocapping of EphB6 with TCR was not due to nonspecific trapping of EphB6 by TCR over–cross-linking. It is to
be noted that more than 80% of the thymocytes were CD4+CD8+
DP cells, and that EphB6 and CD3 cocapping could be observed in more than 70% of the thymocytes; these observations indicate that the cocapping occurred in CD4+CD8+ DP cells.
We next investigated the relationship between EphB6 and rafts, which function as a scaffold to host many signaling molecules. As shown in Figure 6D, rafts, which were stained by cholera toxin in red, were evenly present on the WT resting T cell surface; after 2 minutes of cross-linking at 37°C with anti-CD3 and anti-CD4, they congregated and formed capping. EphB6, which was stained in green, also formed capping after CD3 and CD4 cross-linking. The EphB6 capping overlapped with the raft capping, indicat-ing that now EphB6 had migrated into the rafts. This provided a morphological basis for the EphB6 signaling pathway to interact with the TCR signaling pathway. We wondered whether EphB6 was necessary for raft aggregation but could not find significant difference in raft-capping formation after TCR cross-linking in
EphB6–/– versus EphB6+/+ T cells (data not shown).
In the experiments described above, we used anti-CD3 plus anti-CD4 to stimulate the thymocytes. On the DP thymocytes, the CD3 expression level was lower than on the mature T cells,
and the addition of anti-CD4 better stimulated TCR, although anti-CD3 still activated the thymocytes to achieve TCR and raft aggregation, albeit to a lesser extent (data not shown).
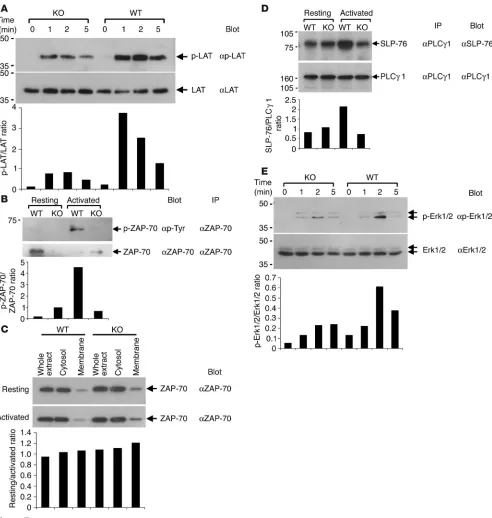
Next, we investigated the molecular basis for EphB6 to enhance TCR signaling. We have previously demonstrated that Grb2, an adaptor protein, is associated with EphB6 (25). Since Grb2 directly interacts with phosphorylated LAT (35), the LAT phosphorylation after TCR activation with anti-CD3 and anti-CD4 was examined. In
EphB6+/+ thymocytes, anti-CD3 and anti-CD4 cross-linking strongly
enhanced tyrosine phosphorylation of LAT; however, in EphB6–/–
thymocytes, LAT phosphorylation was significantly compromised, with the total LAT protein remaining constant (Figure 7A). LAT is the substrate of ZAP-70 kinase (36). The compromised LAT phosphorylation prompted us to examine the activation of ZAP-70. As shown in Figure 7B, ZAP-70 was effectively phosphorylated after CD3 and CD4 cross-linking in EphB6+/+ but not in EphB6–/–
thymocytes, while the total ZAP-70 protein of the 2 samples was similar. ZAP-70 is recruited to the cell membrane after TCR activa-tion. We wondered whether there was a defect in the ZAP-70 brane translocation in the absence of EphB6. Cytosolic and mem-brane proteins of thymocytes cross-linked by CD3 and CD4 for 20 minutes, which is the optimal duration for observation of ZAP-70 membrane translocation (37), were fractionated, and their ZAP-70 content was assessed by immunoblotting. As shown in Figure 7C, no significant difference between EphB6+/+ and EphB6–/– thymocytes was
observed in this regard, which indicates that the defective ZAP-70 activation is not due to compromised membrane translocation.
Since phosphorylated LAT binds PLCγ1, which has increased
association with SLP-76 via Itk during TCR activation (36), we
also assessed the amount of SLP-76 associated with PLCγ1 in
[image:8.585.49.538.83.305.2]thymocytes, using immunoprecipitation. In the resting status,
Figure 6
Figure 7
research article
EphB6+/+ and EphB6–/– thymocytes had similar amounts of SLP-76
associated with PLCγ1 (Figure 7D); when the cells were cross-linked
with anti-CD3 and anti-CD4, the amount of PLCγ1-associated
SLP-76 was greatly increased in EphB6+/+ but not in EpbB6–/–
thymocytes, while the amount of precipitated PLCγ1 remained the same. This indicates that EphB6 is necessary to optimally recruit
SLP-76 to PLCγ1. Further downstream of the initial signaling
events occurring the membrane, we found that Erk1/2 activation in EphB6–/– thymocytes after anti-CD3 and anti-CD4 stimulation
was compromised compared with that in EphB6+/+ thymocytes
(Figure 7E). This is consistent with the previous reports that LAT tyrosine phosphorylation is critical for Erk1/2 activation.
Discussion
In this study, we investigated the function of EphB6, a member of the Eph family of receptor tyrosine kinases, in the immune system. EphB6 shares about 30% amino acid identity with other EphB family members (18, 38), but human EphB6 and mouse EphB6 have more than 90% amino acid similarity (18, 38). This suggests that EphB6 must have important conserved functions, even though it has no kinase activities because of a mutation in its kinase domain (18, 38). Indeed, we showed that EphB6 was essential in T cell function.
We have demonstrated here that EphB6–/– T cells were
defec-tive in their response to TCR stimulation in vitro and in vivo. One might argue that the compromised T cell response seen in
EphB6–/– mice is due to defective T cell development, not to lack
of EphB6 expression on the mature T cells. Our data show that this is unlikely: when T cells from normal individuals were sorted
by flow cytometry according to EphB6 expression, EphB6–/– T
cells responded poorly to anti-CD3 and anti-CD28 stimulation, compared with EphB6+/+ T cells (19), which suggests that EphB6
is essential for the function of normally developed T cells. We previously assessed the expression of EphB6 and its ligands in
both CD45RA+ and CD45RO+ T cells. Although the expression
on CD45RA+ cells was higher than that on CD45RO+ cells (58%
versus 28%), they had similar proliferative response to anti-EphB6 costimulation (19). This suggests that both memory and naive T cells require EphB6 for optimal function.
Although the T cell proliferation and lymphokine production in vitro, and the T cell–mediated cellular immune response in vivo (such as DTH and EAE induction), were compromised in the
EphB6–/– mice, the T cell–dependent humoral response, such as
anti-TT IgG production and serum IgG, IgA, and IgE levels, in these mice was not defective. A likely explanation to this seem-ingly contradictory observation is that the T cell functions are reduced but not totally ablated in the EphB6–/– mice, and the
remaining capacity of the T cell function is sufficient to support the T cell–dependent humoral response. The T cell–independent Ab production, as shown by the serum IgM level, in the EphB6–/–
mice was also normal, further indicating that EphB6 is not essen-tial for B cell function. This is consistent with the low expression of EphB6 and EFNBs on B cells (19, 28, 31). We attempted to investigate the Th1 versus Th2 differentiation of EphB6–/– T cells
in vitro. However, as these T cells could not proliferate well, they could not be driven into either Th1 or Th2 status in vitro using conventional protocols. As an alternative, we tested their serum Ig isotypes, including IgE. These parameters in the EphB6–/– mice
were comparable to those in the WT mice, which suggests that the lack of EphB6 does not skew the Th1/Th2 balance.
Recent findings based on anti–IFN-γ Ab administration or IFN-γ– or IFN-γ receptor–null mutation indicate that IFN-γ has a protective role in EAE induction (39–42). In our study, although IFN-γ secre-tion by EphB6–/– T cells was reduced, EAE induction in the EphB6–/–
mice was diminished. How do we reconcile these 2 phenomena? It is possible that the degree of IFN-γ reduction in EphB6–/– mice is
not as severe as in those published EAE models, in which IFN-γ or IFN-γ receptor levels were increased or suppressed on more drastic scales; moreover, EphB6–/– mice have other defects, such as decreased
IL-2 production and T cell proliferation. As a result, the observed decrease of EAE severity in EphB6–/– mice is the sum of all these
defects and is not only related to the reduced IFN-γ level.
We demonstrated, using EphB6–/– T cells, that all 3 EFNBs could
trigger T cell costimulation via EphB6; such an effect of the EFNBs on EphB6 was only revealed in the presence of soluble EphB4, which could block the interaction between the plate-bound EFNBs and EphB4 on the cells. It is to be noted that even in the absence of EphB6 and the blocking of EphB4, the inhibition of the costimulation by EFNBs was still not complete, which suggests the involvement of other Ephs in EFNB-triggered costimulation. These results demonstrate that, as with other Eph kinases, EphB6 binds multiple ligands for its function in T cells; they also suggest that the EFNBs can exert their costimulation through EphB6 as well as other Ephs. As EFNB family members are cell surface mol-ecules and can function as receptors to reversely transduce signals into cells using their normal receptors, Eph kinases, as ligands (3), the phenotype of the EphB6–/– mice could, in theory, be caused by
either or both of the following 2 mechanisms: (a) lack of EphB6 as a receptor to receive stimulation from its ligands (e.g., EFNB1, EFNB2, and/or EFNB3); or (b) lack of stimulation from EphB6 to EFNB1, EFNB2, and/or EFNB3. The immunological phenotype of the EphB6–/– mice is likely due to the former mechanism, since
we have proven that mAb or the EphB6 ligand EFNB2 on wells can costimulate T cells (19, 28) but EphB6 on wells failed to have any effect on T cells (data not shown).
We have shown here that after TCR activation, EphB6 translocated into aggregated rafts, to which TCRs also migrate. This provides a morphological basis for the signaling pathways of EphB6 and TCR to interact. Moreover, rafts function as a scaffold for many signaling molecules; the migration of EphB6 to rafts may allow it to interact with these signaling molecules for its signaling. We examined the raft aggregation after TCR activation in EphB6+/+ and EphB6–/– T
cells, but no significant difference was found (data not shown); this indicates that EphB6 is not essential for raft aggregation. The move-ment of rafts during TCR activation is a cytoskeleton-dependent process. We did not find any abnormality in actin polymerization in EphB6–/– T cells during TCR ligation (data not shown); further,
EphB6 cross-linking alone did not result in apparent actin polym-erization, which suggests that the essential function of EphB6 is not related to cytoskeleton reorganization.
Through our study, a putative model is emerging to explain the mechanism of EphB6 costimulation of T cells. It seems that EphB6 is an essential component of the TCR signaling complex, which is now often referred to as the TCR signalosome. During T cell activation, EphB6 is recruited to the raft in which the
sig-nalosome resides; ZAP-70, LAT, PLCγ1, SLP-76, and TCR are all
respon-sible for LAT phosphorylation; without EphB6, ZAP-70 activa-tion and, subsequently, LAT phosphorylaactiva-tion were compromised, even under strong TCR stimulation. (In our experiments, strong TCR stimulation was mimicked by CD3 plus CD4; anti-CD3 alone was effective, but less so than anti-anti-CD3 plus anti-CD4 [data not shown].) EphB6 itself has a mutated kinase domain and thus has no intrinsic kinase activity (18, 32); how EphB6 activates ZAP-70 remains to be elucidated. There are 2 obvious possibili-ties. (a) As we have demonstrated (25), EphB6 is associated with a number of adaptor molecules, such as CrkL, CrkII, Grb2, and Cbl. Any of these adaptors could associate with certain kinases that initiate the cascade of EphB6 signaling. (b) EphB6 can form dimers with EphB1 (33), which has competent kinase activity; with such dimerization, EphB6 is no longer kinase-incompetent. The phosphorylation of LAT is pivotal for recruitment of other
sig-naling molecules such as SLP-76 via PLCγ1, and for downstream
MAPK activation (36); indeed, we showed that in the absence of EphB6, these further signaling events could not develop to a full scale. We attempted to assess whether EphB6 cross-linking alone could increase LAT phosphorylation and augment SLP-76 binding to PLCγ1 in WT thymocytes; however, in our liquid cross-linking system (i.e., the cross-linking of TCR and EphB6 was conducted in solution by secondary Ab or streptavidin), the increase was not obvious. The likely reason is that it was difficult to adjust the TCR cross-linking to a suboptimal level to reveal the effect of EphB6 in this system. However, it is conceivable that under a physiological condition, EphB6 might be cross-linked by EFNBs on the neigh-boring cells. Such cross-linking results in activation of ZAP-70 followed by augmented LAT phosphorylation, and in association
between PLCγ1 and SLP-76.
The significance of our study with respect to the immune system is as follows: That all 3 ligands of EphB6 are prominently expressed on T cells (refs. 28, 31, and data not shown) suggests that interac-tion between EphB6 and EFNB is important for T cell–T cell coop-eration during T cell activation. The necessity of such coopcoop-eration is often neglected but can well explain the fact that T cells need to reach a certain density in in vitro activation, and the fact that T cells are best activated in lymphoid organs where they are tightly packed and have ample opportunity to interact with fraternal EphB6 ligand–expressing T cells. In our in vitro activation model (Figure 3), highly purified CD4 and CD8 cells (more than 98.5% pure) were used, and the lack of EphB6 in these cells led to reduced proliferation upon stimulation; this proves that T cell–T cell col-laboration via EphB6 and its ligands is essential in optimizing T cell activation and proliferation. In vivo, it is possible that EphB6 on T cells will receive signals not only from other T cells, but also from APCs, since APCs express some of the EphB6 ligands as well (28, 31). The overall effect of EphB6 seems to reduce the threshold of T cell response to antigen stimulation.
Methods
Generation of EphB6–/– mice. All the animal studies, including the generation
of EphB6–/– mice, were approved by the Animal Protection Committee of
Centre Hospitalier de l’Université de Montréal. A 19-kb EphB6 gene frag-ment from the 129/sv phage genomic library was subcloned into pBluescript SK– and was named pEphB6-19K. A 4.6-kb arm upstream of EphB6 exon III,
which contains the start codon, was obtained by PCR amplification, using pEphB6-19K as a template and the primer pair TK13/TK10 (GCTAAAAT-GTTACATATCTCTG/CTCTTCGGCACTCCCAACCATTG). Similarly, a 1-kb downstream arm derived from exon V and intron V was retrieved by
PCR with the primer pair TK12/TK11 (TTACTACCGGCAGGCTGATGA/ GTCCTGAGAGCCAGTCTCTACCTC). The 4.6-kb upstream arm, the GFP
and neomycin resistance cassette, and the 1-kb downstream arm were cloned into vector pSP72 to form the targeting construct. The construct was trans-fected into 129/sv embryonic stem cells. After G418 selection, the surviving clones were screened by PCR, using the primer pair PTK3/TK15 (TGTTC-CAGCCCTGGGTGTGAGTGG/GAGGTAGAGACTGGCTCTCAGGAC) to identify a 1.6-kb fragment derived from WT alleles; the primer pair Neo1 (TGCGAGGCCAGAGGCCACTTGTGTTAGC) and TK15 were applied to identify a 1.2-kb fragment derived from mutant alleles. The targeted clones were injected into C57BL/6 blastocysts. Offspring from chimeric founders was expanded. Tail DNA was screened by PCR for genotyping. Southern blot-ting confirmed the genotyping; a 3-kb fragment corresponding to a region from exon V through exon VII was retrieved with PCR, using the primer pair TKPro3/TKPro4 (GATGTCTAATGCAGGCTGGCTGG/CAGGAGG-TAGAGACTGGCTCTC), and served as a probe for Southern blotting. When tail DNA was digested with HindIII, deletion of exon III and IV resulted in a 6.6-kb band, while the WT allele was detected as a 10-kb band.
Lymphocyte preparation and culture. Thymocytes, lymph node cells, and spleen cells were prepared as described elsewhere (28). Spleen T cells, CD4 cells, and CD8 cells were purified with a magnet-activated cell sorter (Miltenyi Biotec Inc.) according to the manufacturer’s instructions. In some cases, T cells were cultured in wells coated with 0.5 μg/ml anti-CD3 mAb (clone 145-2C11) alone or with 5 μg/ml anti-CD28 mAb (clone 37.51.1). In some experiments, T cells were cultured in the presence of PMA (10 nM) and ionomycin (1 μg/ml). 3H-thymidine uptake was
mea-sured as described previously (43).
Flow cytometry. One-color flow cytometry was used to confirm the lack of EphB6 expression on thymocytes, which were stained with goat anti– mouse EphB6 (R&D Systems Inc.), followed by PE-conjugated donkey anti-goat IgG (Jackson ImmunoResearch Laboratories Inc.). Three-color flow cytometry was used for measurement of EphB6 expression in different cell populations. The cells were first stained with biotinylated anti-CD4 mAb (clone GK1.5) and goat anti–mouse EphB6 Ab. After washing, the cells were stained with Quantum Red–conjugated streptavidin (Sigma-Aldrich), PE-conjugated anti–mouse CD8a (clone 53-6.7), and Alexa Fluor 488–con-jugated donkey goat IgG (Invitrogen Corp.). FITC-con488–con-jugated anti-CD4 mAb and PE-conjugated anti-CD8 mAb were used to assess anti-CD4 and CD8 populations in the thymus and spleen. FITC-conjugated anti-Thy1.2 mAb (clone 53-2.1) was used in conjunction with PE-labeled anti-CD3 (clone 145-2C11), PE-labeled anti–TCR-β (clone H57-597), and hamster anti-CD28 mAb (clone 37.51.1), followed by PE-labeled goat anti-hamster IgG to determine CD3, TCR, and CD28 expression levels in EphB6–/– and
EphB6+/+ T cells. CD25 and CD69 expression was assessed by 2-color flow
cytometry, using PE-labeled anti-Thy1.2 and FITC-labeled anti-CD25 or anti-CD69 Abs. All mAbs were from BD Biosciences — Pharmingen.
Cytokine measurement. Supernatants of T cells cultured in wells coated with anti-CD3 and/or anti-CD28 were harvested 24–72 hours after the initia-tion of culture. IL-2, IL-4, and IFN-γ in the supernatants were quantified by ELISA (R&D Systems Inc.) according to the manufacturer’s instructions.
FITC-induced ear swelling. FITC-induced ear swelling was conducted as described by Erdmann et al. (44). EphB6–/– mice or their WT littermates were
sensitized with FITC by painting of the shaved abdomen with 0.4 ml 0.5% FITC in acetone/dibutyl phthalate (1:1 ratio). After 6 days, DTH was elicited by painting of both sides of an ear with 0.5% FITC. After 24 hours, the increase in ear thickness was measured using a Mitutoyo Corp. digital caliper.
Induction of EAE. Eight- to ten-week-old female EphB6–/– mice or their female
littermates were injected with 150 μg MOG35–55 peptide
research article
Mycobacterium tuberculosis H37 Ra (Difco Laboratories). The emulsion (0.2 ml) was injected s.c. in 1 flank. In addition, on the day of immunization and 2 days later, the mice received 500 ng of pertussis toxin (List Biological Labora-tories) in 0.2 ml PBS i.p. They were boosted with MOG35–55 in CFA s.c. in the
opposite flank 1 week after the first immunization. EAE development was scored daily in a double-blind fashion between days 0 and 35 according to a scale ranging from 0 to 8, as described by Teige et al. (45).
Serum Ab and antigen-specific Ab measurement. Different serum Ig isotypes of EphB6–/– mice and their WT littermates were measured by the Ig
iso-typing ELISA kit and OptEIA IgE kit (BD Biosciences) according to the manufacturer’s instructions. To trigger the anti-TT Ab response, the mice were immunized s.c. with absorbed TT (0.5 Limes flocculation unit per 0.1 ml per immunization; Institut Armand-Frappier, Laval, Québec, Canada) on days 1, 11, and 25. Mouse serum samples were collected on days 1, 11, 18, 25, 32, and 39, and measured with ELISA for anti-TT IgG, as described previously (46).
Generation of recombinant EphB4-Fc and EFNB1-Fc. The coding sequence of the extracellular domain of mouse EFNB1 and EphB4 from positions 255 to 803 (accession number U12983) and from positions 85 to 1679 (accession number Z49085), respectively, was cloned in-frame upstream of the human IgG1-Fc coding sequence in an expression vector, pCMVhFc.
The constructs and pcDNA3 were then cotransfected into CHO/dhfr– cells
with Lipofectamine. The rest procedures were described previously (28, 31). The fusion protein was verified by N-terminal peptide sequencing (Shel-don Biotechnology Centre).
Confocal microscopy. For EphB6 staining, EphB6+/+ and EphB6–/– thymocytes
were reacted first with goat anti–mouse EphB6 Ab (R&D Research Inc.) and then with Alexa Fluor 488–conjugated donkey anti-goat IgG. For CD45 staining, these cells were reacted with FITC-conjugated rat anti– mouse CD45 mAb (clone 30-F11; BD Biosciences — Pharmingen). These stained cells were then resuspended in ice-cold RPMI supplemented with 5% FCS, 10 μg/ml biotinylated anti-CD3 mAb (clone 145-2C11; Cedarlane Laboratories Ltd.), and 10 mg/ml biotinylated anti-CD4 mAb (clone GK1.5; BD Biosciences — Pharmingen). After 30 minutes of incubation on ice, the cells were washed and cross-linked with Alexa Fluor 594–con-jugated streptavidin (40 μg/ml; Invitrogen Corp.) at 37°C for 2 minutes. Rafts in these cells were stained with Alexa Fluor 594–conjugated chol-era toxin (Invitrogen Corp.). The cells were immediately fixed with 4% paraformaldehyde and examined with confocal microscopy.
Immunoblotting. EphB6+/+ and EphB6–/– thymocytes were cross-linked with
biotinylated anti-CD3 and anti-CD4 mAbs on ice, and then reacted with
streptavidin at 37°C for 0–5 minutes. The cells were lysed and the cleared lysates were either resolved directly (50 μg/lane) in 12% SDS-PAGE fol-lowed by immunoblotting, or first immunoprecipitated with anti-PLCγ1 Ab (100 μg lysate per sample) and then resolved in 10% SDS-PAGE fol-lowed by immunoblotting. In some experiments, cells were fractionated into cytosol and membranes, as detailed by Meller et al. (37). Briefly, the cells were sheared with a 25-gauge needle for 25 passages, and the lysates were centrifuged at 280 g for 7 minutes. The supernatants were further centrifuged at 16,000 g for 20 minutes, and the supernatants of this cen-trifugation represented the cytosolic fraction. The pellets were washed and lysed in a buffer containing 1% NP-40. After incubation on ice for 30 minutes, the lysates were centrifuged again at 16,000 g. The supernatant of this centrifugation represented the cell membrane fraction. Rabbit Abs against phospho–ZAP-70, total ZAP-70, PLCγ1, SLP-76, and total Erk1/2 were from Santa Cruz Laboratories Inc., rabbit Abs against phospho-LAT and phospho–Erk1/2 were from New England Biotechnology Inc., and mouse mAbs against total LAT (clone 45) and phosphotyrosine were BD Transduction Laboratories mAbs (BD Biosciences).
Acknowledgments
The authors sincerely thank Ovid Da Silva and Robert Boileau for their editorial assistance and statistical analysis, respectively. This work was supported by grants from the Canadian Institutes of Health Research (CIHR; MOP57697); the CIHR/Canadian Blood Service Partnership Program; the Kidney Foundation of Canada; the Heart and Stroke Foundation of Québec; the Roche Organ Transplantation Research Foundation, Switzerland (ROTRF number 590934439); and the J.-Louis Levesque Foundation (to J. Wu). This work was also supported by a grant from the CIHR for the New Emerging Teams in Transplantation. J. Wu is a National Researcher of Fonds de la recherche en santé du Québec.
Received for publication April 9, 2004, and accepted in revised form October 5, 2004.
Address correspondence to: Jiangping Wu, Laboratory of Immu-nology, Research Centre, Notre Dame Hospital, Centre Hospitalier de l’Université de Montréal, Pavilion DeSève, Room Y-5616, 1560 Sherbrooke Street East, Montréal, Quebec H2L 4M1, Canada. Phone: (514) 890-8000 ext. 25164; Fax: (514) 412-7596; E-mail: [email protected].
1. Eph Nomenclature Committee. 1997. Unified nomenclature for Eph family receptors and their ligands, the ephrins. Cell.90:403–404.
2. Wilkinson, D.G. 2000. Eph receptors and ephrins: regulators of guidance and assembly. Int. Rev. Cytol.
196:177–244.
3. Flanagan, J.G., and Vanderhaeghen, P. 1998. The ephrins and Eph receptors in neural development.
Annu. Rev. Neurosci.21:309–345.
4. Venter, J.C., et al. 2001. The sequence of the human genome. Science.291:1304–1351.
5. Gale, N.W., et al. 1996. Eph receptors and ligands comprise two major specificity subclasses and are reciprocally compartmentalized during embryogenesis. Neuron.17:9–19.
6. Xu, Q., and Wilkinson, D.G. 1997. Eph-related recep-tors and their ligands: mediarecep-tors of contact depen-dent cell interactions. J. Mol. Med.75:576–586. 7. Leighton, P.A., et al. 2001. Defining brain wiring
patterns and mechanisms through gene trapping in mice. Nature.410:174–179.
8. Kullander, K., et al. 2001. Kinase-dependent and kinase-independent functions of EphA4 recep-tors in major axon tract formation in vivo. Neuron.
29:73–84.
9. Holmberg, J., Clarke, D.L., and Frisen, J. 2000. Regu-lation of repulsion versus adhesion by different splice forms of an Eph receptor. Nature.408:203–206. 10. Gerlai, R. 2001. Eph receptors and neural plasticity.
Nat. Rev. Neurosci.2:205–209.
11. Wang, H.U., Chen, Z.F., and Anderson, D.J. 1998. Molecular distinction and angiogenic interaction between embryonic arteries and veins revealed by ephrin-B2 and its receptor Eph-B4. Cell.93:741–753. 12. Batlle, E., et al. 2002. Beta-catenin and TCF medi-ate cell positioning in the intestinal epithelium by controlling the expression of EphB/ephrinB. Cell.
111:251–263.
13. Lickliter, J.D., Smith, F.M., Olsson, J.E., Mackwell, K.L., and Boyd, A.W. 1996. Embryonic stem cells express multiple Eph-subfamily receptor tyrosine kinases. Proc. Natl. Acad. Sci. U. S. A.93:145–150. 14. Andres, A.C., et al. 1994. Expression of two novel
eph-related receptor protein tyrosine kinases in mammary gland development and carcinogenesis.
Oncogene.9:1461–1467.
15. Munoz, J.J., et al. 2002. Expression and function of the Eph A receptors and their ligands ephrins A in
the rat thymus. J. Immunol.169:177–184. 16. Fox, G.M., et al. 1995. cDNA cloning and tissue
dis-tribution of five human EPH-like receptor protein-tyrosine kinases. Oncogene.10:897–905.
17. Ciossek, T., Lerch, M.M., and Ullrich, A. 1995. Cloning, characterization, and differential expres-sion of MDK2 and MDK5, two novel receptor tyrosine kinases of the eck/eph family. Oncogene.
11:2085–2095.
18. Gurniak, C.B., and Berg, L.J. 1996. A new member of the Eph family of receptors that lacks protein tyrosine kinase activity. Oncogene.13:777–786. 19. Luo, H., Yu, G., Wu, Y., and Wu, J. 2002. EphB6
cross-linking results in costimulation of T cells. J. Clin. Invest.110:1141–1150. doi:10.1172/JCI200215883. 20. Shimoyama, M., et al. 2000. T-cell-specific expres-sion of kinase-defective Eph-family receptor pro-tein, EphB6 in normal as well as transformed hematopoietic cells. Growth Factors.18:63–78. 21. Aasheim, H.C., Terstappen, L.W., and Logtenberg,
T. 1997. Regulated expression of the Eph-related receptor tyrosine kinase Hek11 in early human B lymphopoiesis. Blood.90:3613–3622.
hybridiza-tion reveals the expression of immunoglobulin-like transcript 7, Eph-B1, granzyme B, and 3 novel transcripts in human plasmacytoid dendritic cells.
Blood.100:3295–3303.
23. Wicks, I.P., Wilkinson, D., Salvaris, E., and Boyd, A.W. 1992. Molecular cloning of HEK, the gene encoding a receptor tyrosine kinase expressed by human lymphoid tumor cell lines. Proc. Natl. Acad. Sci. U. S. A.89:1611–1615.
24. Steube, K.G., Meyer, C., Habig, S., Uphoff, C.C., and Drexler, H.G. 1999. Expression of receptor tyrosine kinase HTK (hepatoma transmembrane kinase) and HTK ligand by human leukemia-lymphoma cell lines. Leuk. Lymphoma.33:371–376.
25. Luo, H., Wan, X., Wu, Y., and Wu, J. 2001. Cross-linking of EphB6 resulting in signal transduction and apoptosis in Jurkat cells. J. Immunol.
167:1362–1370.
26. Shao, H., Pandey, A., O’Shea, K.S., Seldin, M., and Dixit, V.M. 1995. Characterization of B61, the ligand for the Eck receptor protein-tyrosine kinase.
J. Biol. Chem.270:5636–5641.
27. Davis, S., et al. 1994. Ligands for EPH-related receptor tyrosine kinases that require membrane attachment or clustering for activity. Science.
266:816–819.
28. Yu, G., Luo, H., Wu, Y., and Wu, J. 2003. Ephrin B2 induces T cell costimulation. J. Immunol.
171:106–114.
29. Sharfe, N., Freywald, A., Toro, A., Dadi, H., and Roifman, C. 2002. Ephrin stimulation modulates T cell chemotaxis. Eur. J. Immunol.32:3745–3755. 30. Sharfe, N., Freywald, A., Toro, A., and
Roif-man, C.M. 2003. Ephrin-A1 induces c-Cbl phosphorylation and EphA receptor down-regula-tion in T cells. J. Immunol.170:6024–6032. 31. Yu, G., Luo, H., Wu, Y., and Wu, J. 2003. Mouse
eph-rinB3 augments T-cell responses to T-cell receptor ligation. J. Biol. Chem.278:47209–47216. 32. Munthe, E., et al. 2000. Ephrin-B2 is a candidate
ligand for the Eph receptor, EphB6. FEBS Lett.
466:169–174.
33. Freywald, A., Sharfe, N., and Roifman, C.M. 2002. The kinase-null EphB6 receptor undergoes trans-phosphorylation in a complex with EphB1. J. Biol. Chem.277:3823–3828.
34. Ciossek, T., Lerch, M.M., and Ullrich, A. 1995. Cloning, characterization, and differential expres-sion of MDK2 and MDK5, two novel receptor tyrosine kinases of the eck/eph family. Oncogene.
11:2085–2095.
35. Samelson, L.E. 2002. Signal transduction mediated by the T cell antigen receptor: the role of adapter proteins. Annu. Rev. Immunol.20:371–394. 36. Zhang, W., Sloan-Lancaster, J., Kitchen, J., Trible,
R.P., and Samelson, L.E. 1998. LAT: the ZAP-70 tyrosine kinase substrate that links T cell receptor to cellular activation. Cell.92:83–92.
37. Meller, N., et al. 1996. Direct interaction between protein kinase C theta (PKC theta) and 14-3-3 tau in T cells: 14-3-3 overexpression results in inhibi-tion of PKC theta translocainhibi-tion and funcinhibi-tion. Mol. Cell. Biol.16:5782–5791.
38. Matsuoka, H., et al. 1997. Expression of a kinase-defective Eph-like receptor in the normal human brain. Biochem. Biophys. Res. Commun.235:487–492.
39. Begolka, W.S., and Miller, S.D. 1998. Cytokines as intrinsic and exogenous regulators of pathogenesis in experimental autoimmune encephalomyelitis.
Res. Immunol.149:771–781.
40. Willenborg, D.O., Fordham, S., Bernard, C.C., Cowden, W.B., and Ramshaw, I.A. 1996. IFN-gamma plays a critical down-regulatory role in the induction and effector phase of myelin oligo-dendrocyte glycoprotein-induced autoimmune encephalomyelitis. J. Immunol.157:3223–3237.
41. Ferber, I.A., et al. 1996. Mice with a disrupted IFN-gamma gene are susceptible to the induction of experimental autoimmune encephalomyelitis (EAE). J. Immunol.156:5–7.
42. Krakowski, M., and Owens, T. 1996. Interferon-gamma confers resistance to experimental allergic encephalomyelitis. Eur. J. Immunol.26:1641–1646. 43. Luo, H., et al. 1992. Inhibition of in vitro
immuno-globulin production by rapamycin. Transplantation.
53:1071–1076.
44. Erdmann, I., et al. 2002. Fucosyltransferase VII-deficient mice with defective E-, P-, and L-selectin ligands show impaired CD4+ and CD8+ T cell migration into the skin, but normal extravasation into visceral organs. J. Immunol.
168:2139–2146.
45. Teige, I., et al. 2003. IFN-beta gene deletion leads to augmented and chronic demyelinating experimen-tal autoimmune encephalomyelitis. J. Immunol.
170:4776–4784.