© 2016, IRJET | Impact Factor value: 4.45 | ISO 9001:2008 Certified Journal | Page 201
Automatic Detection of Glaucoma Using 2-D DWT
Kiran S M
1, Dr. D N Chandrappa
21
PG Student, Dept of ECE, SJB Institute of Technology, Banglore, India
2
Professor, Dept of ECE, SJB Institute of Technology, Banglore, India
---***---Abstract -
Glaucoma is dangerous eye disease causespermanent blindness when it is untreated in earlier stages. Until the disease reaches to an advanced stages it shows no symptoms hence regular eye test is very important. Since glaucoma damages an optic nerve head, the disease can be detected automatically by analyzing retinal fundus images. The automatic analysis involves using structural and texture features of retinal images. This paper compiles an automatic system for glaucoma analysis using texture features extracted from retinal images. The texture features are extracted using 2-D discrete wavelet transforms. The image features obtained from five different wavelet filters Daubechies (db3), Symlet (sym3) and biorthogonal (Bior 3.3, Bior 3.5, Bior 3.7) are used to classify the images as glaucomatous and non glaucomatous. The system is able to detect the disease with an accuracy of 91.66%.
Key Words
:
Glaucoma, Optic nerve head, Fundus images,
structural features, texture features and wavelet
1.
INTRODUCTION
Along with the development of information technology, many computer-aided healthcare systems are implemented to provide a solution in the developing areas where medical resources are scarce. An example is about the diagnosis and treatment of glaucoma.
Glaucomais a group of eye diseases with common characteristics that result in damage of human visual system. The changes occurred in retinal structures such as eye’s optic nerve, which gradually lead to blindness or vision loss Glaucoma is the second largest cause of blindness in the world. According to survey around 2.3% of the total population got affected by glaucoma and is predicted to affect around 11.1 million people (around 2.86%) by 2020 [1]. Among the retinal diseases 13% of cases being affected by glaucoma.
Very dangerous thing about glaucoma is that it shows no symptoms in earlier stages. That is no pain, no vision change etc. If remain untreated, the patient may start losing his side vision. Gradually he feels like looking through a tunnel. Glaucoma is non reversible but can be controlled by detecting the disease in earlier stages. In advanced stages glaucoma patient usually shows thinness of the cornea, high eye pressure and abnormal optic nerve anatomy.
The main cause for glaucoma is increased intraocular pressure in the eye. To maintain healthy vision human eye produces a small amount of fluid called aqueous fluid or aqueous humour. It plays very important role in maintaining intraocular pressure and provides nutrition for various tissues. An imbalance is created in fluid flow when drainage system is blocked or eye produces an excess of fluid and hence pressure is increased inside the eye. Due to this high intraocular pressure optic nerve head is progressively damaged and causes vision loss.
Based on how the introcular pressure is increased, glaucoma is classified as two types. (1) Open-angle glaucoma: This type of glaucoma can also be named as chronic glaucoma. It is most common type of glaucoma and symptoms are very slow to develop. It causes when an aqueous fluid is over produced or when eye drainage system is clogged over time. Due to this the fluid can’t thrown out of the eye. Around 80% of glaucoma patients are suffering from chronic glaucoma. (2) Closed-angle glaucoma: This is also called as acute narrow angle glaucoma. Around 10% of glaucoma patients are affected by Narrow angle glaucoma. Although it is rare it is very serious form of disease. It occurs in the people who have very narrow space between iris and cornea. As the eye ages, the pupil grows this leads to blocking of this narrow space. Hence, fluid flow is restricted this leads to increase in intraocular pressure. Because of sudden increase in pressure inside the eye, this type of glaucoma is very painful. There are three different methods are available for glaucoma detection, they includes: a) Assessment of raised intraocular pressure (IOP):
Glaucoma can be present with or without increased intraocular pressure. Therefore intraocular pressure assessment is not effective tool for glaucoma detection. b)Assessment of abnormal visual field: Abnormal visual
field test requires special equipments only present in territory hospitals hence it is unsuitable for glaucoma screening.
c) Assessment of changes in retinal structure: In the inner surface of the eye, retina has light sensitive neuron layers. Eye diseases such as diabetic retinopathy, macular degeneration and glaucoma affect the neuron layer. Hence an eye retinal fundus images are analysed for detection of glaucoma. There exist two central issues to glaucoma recognition using fundus images:
© 2016, IRJET | Impact Factor value: 4.45 | ISO 9001:2008 Certified Journal | Page 202
model etc) for a binary classification betweenglaucomatous and healthy subjects.
ii. Second strategy is based on clinical indicators such as vertical cup-to-disc ratio, disc diameter, peripapillary atrophy etc.
2.
RELATED WORK
One of the major glaucoma symptoms is that the cup area enlarges and occupied the most of the disc area [2]. Many techniques are developed to identify the enlargement of optic cup. This is done by calculating the ratio of optic cup to disc area or ratio of cup-disc vertical diameter. Larger ratio indicates the occurrence of disease.
M. Lalonde et al [3], made an initial attempt for Optic disc detection using shape based template matching by assuming OD as elliptical or circular object. This approach fails to detect exact OD boundary due to blood vessels present in and around the OD portion. To overcome this, Morris et al [4], suppressed the blood vessels by using morphological-based pre-processing techniques prior to template matching. The shape of the optic disc will change due to the effect of some disease. Therefore shape-based modeling fails exact disc boundary.
Jun Cheng et al [1] proposed a method for glaucoma detection using CDR. In this method optic disc is segmented using super pixel classification. Superpixels are generated from nearby pixels using simple linear iterative clustering (SLIC). Each superpixel is classified as disc or non-disk regions using histograms and centre surround statistics. The experimental result indicates that cup and disc are segmented with overlapping error of 24.1% and 9.5% respectively. The authors in [5] shows that glaucoma can be detected by using ratio between neuroretinal rim and optic disc.
Few efforts are available for classification between normal and glaucomatous patients based on texture features extracted from retinal images. Bock has major contribution [6], initially Principal Component Analysis (PCA) is applied on each pixel to reduce dimensionality. As a pre-processing step, they correct intensity inhomogeneity and dillumination. Later they added features such as image texture, FFT coefficients, histogram models and B-spline coefficients. Glaucoma Risk Index (GRI) is calculated based these features. At the end normal and glaucomatous images are classified using Naïve Based Classifier, k-Nearest Neighbor Classifier and Support Vector Machines. SVM is found to be less prone to sparsely sampled feature space.
The texture feature based techniques for glaucoma detection have been proven successful but still it is a challenge to generate generalized textural and structural features of retinal images. Therefore wavelet transforms are applied on retinal images for texture feature extraction. The first attempt on use of wavelet transforms for fundus image analysis is done by Liye Guo et al [7]. Sketch based methods
and wavelet transforms are applied on fundus image to extract high frequency components for cataract classification. It consists of fundus image pre-processing, feature extraction, followed by cataract classification and grading. S Dua [8] used Wavelet-Based Energy Features to compare the performance of different classifiers in glaucoma detection: Naïve Based Classifier, k-Nearest Neighbor Classifier and Support Vector Machines (SVM), Random Forests and Sequential minimal optimization (SMO). Here energy features are extracted from retinal images using five different wavelets (Daubechies, Symlet Bior 3.3, Bior 3.5 and Bior 3.7). They observed minimum classification efficiency from SMO.
3.
PROPOSED METHODOLOGY
In this work, glaucoma is detected using retinal fundus images. These images are captured by ophthalmologists using special optical cameras. The images are pre-processed and then texture features are extracted using wavelet transforms. Based on these features images are classified as glaucomatous or non glaucomatous images. The block diagram of proposed algorithm is shown in fig 1.
Fig 1: Block diagram of proposed algorithm
a) Image Acquiring and reading:
The color images of interior surface of eye are captured using special fundus cameras through dilated pupil of the patient. A retina or fundus camera is a low power microscope, which captures the photograph of interior surfaces of eye including the retina, optic disc, retinal vasculature, optic nerve head and macula. These images are used for documentation of presence of disorders such as diabetic retinopathy, glaucoma, age related macular degeneration, macular edema and to monitor their changes over time. A sample of color fundus image is shown in fig 2. Color fundus photography is done through a dilated pupil because widening (dilating) a patient’s pupil increases the angle of observation. This allows the technicians to image a much greater area and have a clearer view of the back of the eye. Captured images are read into MATLAB using an inbuilt function imread.
Image Acquiring and Reading
Pre-Processing
Feature Extraction
© 2016, IRJET | Impact Factor value: 4.45 | ISO 9001:2008 Certified Journal | Page 203
Fig 2: Retinal fundus imageb) Pre-processing:
Intelligent use of image pre-processing can provide benefits and ultimately lead to better feature detection. It has dramatic positive effect on feature extraction and results on image analysis. Two basic pre-processing steps: image resizing and RGB to GRAY conversion are used in this work. Image resizing is a technique used to create a new version of an image with different size, in which changed as per the requirement. Generally, in image processing all the images are resized to a standard value to make analysis easier. Here, before feature extraction the input fundus image is resized to 256*256 using nearest neighbor image resizing technique.
RGB images having three basic color components: Red, Green and Blue. To represent each pixel in an image 24 bits are required (8 bits for each color). Hence memory required for RGB image is very large and also operations on three color components are time consuming. Therefore RGB images are converted to gray scale images using formula
IGray= 0.2989IR + 0.5870IG + 0.1140IB (1) Where IGray represents a pixel intensity in gray image. IR, IG and IB are intensity of red, green and blue colors in RGB image.
In Gray scale images, pixel intensity is represented using 256 intensity values, with 0 representing black and 255 representing white. Only 8 bits are enough to represent each pixel value and hence the memory required is comparatively less and operations on 8 bit pixels consumes less time than 24 bit RGB images.
c) Feature extraction:
Feature extraction is an important step in image classification. Here the feature means, a significant representative of an image which can be used to distinguish the images. Any image features can be classified into two types such as structural features and texture features. Structural features are related shape and size of various parts in image. Texture features are depends on pixel values, which includes average or different energy values. Generally texture features are extracted from images by using Fourier and wavelet transforms.
A wavelet is a simple function with wave like structure which is scalable and translatable. In this work, texture features are extracted from pre-processed retinal images using 2-dimensional discrete wavelet transforms (DWT). Discrete wavelet transforms have capability to capture both special and frequency information of a signal. This special property of DWT allows as extracting texture features very accurately. In 2-D wavelet transforms image is considered to be a 2-D signal with rows and columns. The main advantage of using 2-D DWT is its capability to store the information of a signal in less number of coefficients.
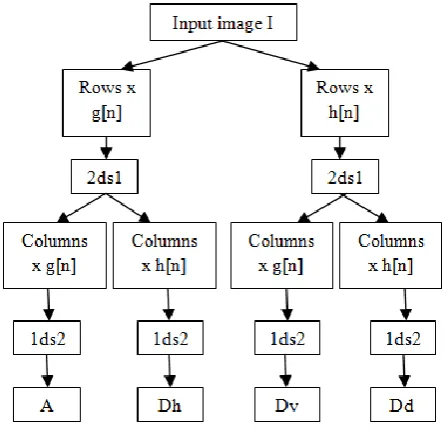
The discrete wavelet transform of a signal is evaluated by passing the signal through series of down sampling low pass and high pass filters. Input signal is decomposed into approximation (low pass frequency contents) and detail (high pass frequency contents) coefficients at first level. Further, next level approximation and detailed coefficients are obtained by decomposing the first level approximation. For images, 2-D wavelet transform is achieved by applying 1-D wavelet transform on rows and columns separately with separate filters. On applying the first level 2-D wavelet transform on retinal image four transform coefficients are obtained, which includes three detail coefficients and one approximation coefficient. The decomposition of an image using 2-D DWT is shown in fig 3.
Fig 3: 2-D DWT Decomposition
In the fig 3, I represent an input image, g[n] is low pass filter and h[n] is high pass filter. 2ds1 indicates rows are down sampled by 2 and columns by 1, 1ds2 means rows are down sampled by 1 and columns by 2. In this work the results from level 1 itself yield significant result. A is an approximation coefficient. Dh, Dv and Dd are the horizontal, vertical and diagonal detail coefficients respectively.
[image:3.595.89.236.97.207.2] [image:3.595.322.546.411.629.2]© 2016, IRJET | Impact Factor value: 4.45 | ISO 9001:2008 Certified Journal | Page 204
such as: daubechies wavelet (db3), symlet wavelet (sym3)and biorthogonal wavelets (Bior 3.3, Bior 3.5 and Bior 3.7). Each of these wavelets is defined by different wavelet function (mother function) and scaling function (father function) in time domain. The wavelet function is like a band pass filter and scaling this filter for each level halves its bandwidth with scaling function.
As a representative feature we need a single number, but number of elements in each matrix is high. Therefore, averaging method is used to determine a single valued feature. The average and energy is calculated using
Where M and N are the number if rows and columns in an input image I(x,y) respectively. and are horizontal and vertical components obtained at first level of decomposition. These average and energy signatures are the good indication of the intensity values distributed in an image. This energy based approach assumes that different texture patterns have different energy distribution in space-frequency domain.
[image:4.595.62.265.242.335.2]d)Classification:
Table 1: Range of feature values for normal images
Based on the calculated energy and average values, the retinal images are classified as glaucomatous and non glaucomatous images. Many times all the features are not very important for classification. Hence before classification important features are selected by eliminating the features with little or no predictive information. Here sequential
forward selection is used as feature selection algorithm. It is simplest algorithm, initially no features are selected. The features are selected one by one in such a way that each newly added feature must decrease the error the most, until any further addition do not significantly decrease the error. This selection algorithm performs best when the subset contains fewer features.
Here fourteen features are selected for classification. The classification is done by defining fixed range for each feature. For all fourteen features, if the feature value is occurred in that fixed range, the input image is considered to be normal or non glaucomatous image. If the feature value is out of this fixed range the image is said to be abnormal or glaucomatous image. The range of all fourteen feature values for normal images is listed in table 1.
4.
RESULTS AND DISCUSSIONS
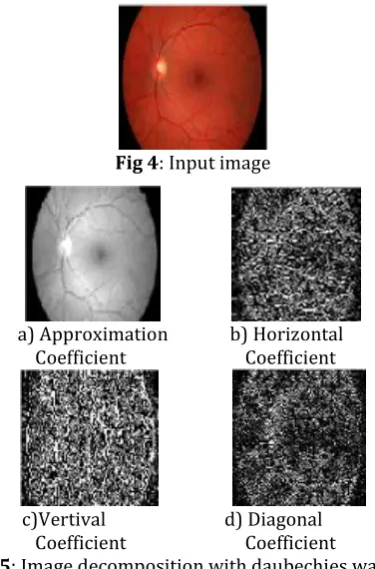
The experimental results obtained from feature extraction and classification are briefly described in this section. As explained in previous section the energy features are extracted from retinal images using 2-D discrete wavelet transforms. The 2-D DWT decomposes an image in to approximation and detail coefficients. Input image is shown in fig 4 and the output obtained in decomposition with daubechies wavelet is shown in fig 5
Fig 4: Input image
a) Approximation b) Horizontal Coefficient Coefficient
c)Vertival d) Diagonal Coefficient Coefficient
[image:4.595.337.525.422.707.2] [image:4.595.47.272.481.689.2]© 2016, IRJET | Impact Factor value: 4.45 | ISO 9001:2008 Certified Journal | Page 205
The evaluation metrics are calculated by using true positive, [image:5.595.32.295.155.244.2]true negative, false negative and false positive values defined in table 2.
Table 2: Definition of TP, TN, FN and FP
Definition Input Image Output obtained True Positive (TP) Glaucomatous Glaucomatous True Negative (TN) Normal Normal False Negative (FN) Glaucomatous Normal False Positive (FP) Normal Glaucomatous
Sensitivity: The probability of abnormal images classified as abnormal is given by sensitivity. It also defined as the proportion of true positives are correctly detected by the system. It shows how good the system detecting the disease. It is calculated using Eq. (5).
Specificity: Specificity gives the probability of normal images being classified as normal. Which can also be defined as the proportion of true negatives are correctly detected. Specificity is useful to know how good the system detects normal condition. It is calculated using Eq. (6).
Accuracy: Accuracy defines how well the system gives correct results. It is defined by Eq. (7)
The classification results are shown in table 3
Table 3: Classification results Parameter Value
Total images 24
Trained images 12
Tested images 12
Successful cases 10
True Positive (TP) 10 True Negative (TN) 12 False Negative (FN) 2 False Positive (FP) 0
Sensitivity 83.33%
Specificity 100%
Accuracy 91.66%
From the table it is found that the proposed system gives the results with accuracy of 91.66%, sensitivity 83.33% and specificity of 100%
5.
CONCLUSION
An automatic system for glaucoma detection is developed using image processing techniques. The features are extracted from retinal fundus images using 2-D discrete wavelet transforms. Wavelet transforms are very efficient for texture feature extraction. In this work, 24 images are processed and 14 features are extracted from each image. From the extracted features a range is defined for each feature of normal images. The images are said to be with abnormality if the energy feature value is out of the defined range. The features extracted using DWT gives a classification accuracy of 91.66%. The proposed system is simple to use, computational complexity is less and cost effective.
REFERENCES
[1]. Jun cheng, Jiang liu, et al, “Superpixel classification based optic disc and optic cup segmentation for glaucoma screening”, IEEE transactions on medical imaging, vol. 32, No. 6, june 2013.
[2]. Azin Poshtyar, Hamid Ahmadieh, Jamshid Shanbehzadeh, “Automatic Measurement of Cup to Disc Ratio for Diagnosis of Glaucoma on Retinal Fundus Images”,6th International Conference on Biomedical Engineering and Informatics, 2013. [3]. M. Lalonde, M. Beaulieu, and L. Gagnon, “Fast and
robust optic disc detection using pyramidal decomposition and hausd off-based template matching,” IEEE Trans Med Imaging., vol. 20(11), pp. 1193–1200, 2001.
[4]. T. Morris R. A. and Abdel-Ghafar, “Progress towards automated detection and characterization of the optic disc in glaucoma and diabetic retinopathy”, Informatics for Health and Social Care, vol. 32(1), pp. 19–25, 2007.
[5]. Ayushi Agarwal, Shradha Gulia, Somal Chaudhary,m “A Novel Approach to Detect Glaucoma in Retinal Fundus Images using Cup-Disk and Rim-Disk Ratio” International Work Conference on Bio-inspired Intelligence (IWOBI), 2015.
[6]. Bock R, Jorg M, Joachim H andGeorge M, “Glaucoma risk index:Automated glaucoma detection from colour fundus image”, ELSEVIER, Medical image analysis 2010.