CYCLE TIME REDUCTION FOR COIL SETUP PROCESS THROUGH
STANDARD WORK: CASE STUDY IN CERAMIC INDUSTRY
Puvanasvaran A. P., Ab. Hamid M. N. H. and Yoong S. S.
Faculty of Manufacturing Engineering, Universiti Teknikal Malaysia Melaka, Malaysia E-Mail: [email protected]
ABSTRACT
In this study, it found that the cycle time of the setup process in a pressing process is inconsistent. This is due to the absence of proper working instruction and workers perform the setup process in varying working steps. Therefore, a new method of the coil setup was developed and standardized which able to improve the efficiency and reduce the lead time of the process. The excessive steps and non-standardize working procedure of the workers in the coil setup needed to be eliminated and some internal steps should change to internal steps to reduce the cycle time. To achieve the objective of this study, the method used in this study is lean tools and techniques such as Time Measurement Sheet (TMS), Standard Work Combination Table (SWCT), Standard Work Chart (SWC) and Single Minutes Exchange Dies technique (SMED). The finding of this study is a new Standard Operating Procedure (SOP) that able to reduce the cycle time and increase the efficiency of the coil setup. This new SOP will be used for the future reference, and it will proliferate to the other similar operation in the department. Future research should conduct in this direction of examining the working mechanism of the workers by using Maynard’s Operation Sequence Technique (MOST) to get more accurate results and achieve continuous improvement.
Keywords: lead time reduction, standard work, ceramic industry.
INTRODUCTION
Standardized Work (SW) is one of the most powerful but least used lean tools, where it forms the baseline for the continuous improvement [1]. The baseline is the benchmark for the production team to measure the efficiency of the workers in performing tasks. Others, SW are a tool for optimization of the productivity, safety, and qualities. In order to ensure the real goals are met, SW is a set of detailed visualization and documented of routine procedures of a manufacturing process. A detailed and proper study of SW, enable managers and employees to follow the task completely while maintaining the productivity and efficiency by ensuring the uniformity so that the rate of production are consistent. By documenting the current best practice, SW forms the baseline for Kaizen or continuous improvement. As the standard is enhanced, the new standard turns into the baseline for further improvements [2]. Therefore, the continuous improvement plan can be made to achieve a better working performance of workers.
In pressing process, coil setup was done regularly after the coil is finished. The ceramic coil will be replaced by the machine operators. However, it is found that the cycle time to setup the coil is inconsistent. This is due to the unfixed and the inconsistency working method, where there is no specific SOP for the coil setup process. Without proper working method, the machine operators tend to forget certain working steps need to be done during the operation. This will lengthen the setup time. Without proper working method, machine operators will not confide to perform their task and frequent checking to the machine. Therefore, by applying for standard work, the variability in the processes could be reduced by eliminating the root causes of variability and permanently resolve the issue. Plus, it will give a clear direction to the workers to clear stop and start point for each process as
well as building their confidence levels in doing the jobs correctly and continuously [3].
LITERATURE REVIEW
Standard Work (SW)
SW is one of the most powerful lean implements that can be used to establish the best and most reliable work practice and sequences for each process, machine and worker, which contains a different way of delibration to motivate the entire organization to work more efficiently and deliver a higher quality at lower cost. As cited by Masaki Imai “there can be no Kaizen without standardization”, [4]. MacInnes has defined on the eight steps to developing standardized work:
a) Establish improvement teams. b) Determine your takt time. c) Determine your cycle time. d) Determine you work sequence.
e) Determine the standard quantity of your work in progress.
f) Prepare a standard workflow diagram. g) Prepare a standard operation sheet.
h) Continuously improve your standard operations.
Standardization work, able to minimize and control the variation in output, quality, WIP (Work In Process) inventory levels and cost as well as, for maintaining and improving that need to be done in the manufacturing area [5].
the resources able to utilize effectively and efficiently. An effective utilization of resources would mean the extent to which an individual/organization is able to meet its goal/objective [6].
As a simplification, the basic information about the man and machines are recorded and analyzed hence making Standard work a dominating tool in Lean manufacturing implementation [7]. The standardization process consists of several stages [8]:
a) Classification - grouping by similarity of product characteristics.
b) Unification - unification of design features and dimension machine elements in order to allow their interchangeability.
c) Typification - harmonize the structure in order to simplify production, reduce costs and facilitate operation.
Therefore, the aim of standardized work usually is to improve productivity, reduce variation in the work performance and improve the quality of the product [9]. The typical process of implementing standardized work:
a) Study the process and document the specific steps (problems and process wastes).
b) Analyze the problems, take action to solve the problems and reduce/eliminate the waste.
c) Implemented the identified solutions in the work. Establish new standards and measure the results. d) Repeat process cycle in an effort to achieve
continuous improvement.
There are certain steps that need to be taken in the implementation of standard work, which are the study of layout and material flow, data collection, analysis of data and decision making, implementation of actions decided and finally monitor and comparison of the results [7]. Below are the main tools used during developing the SW and descriptions of their functions [5]:
a) Time Measurement Sheet (TMS): Use to record and analyze a production process to be studied in terms of process sequences and cycle time (CT).
b) Periodical Task Check Sheet (PTCS): Use to record and analyze all the identified periodical tasks in a set of production processes.
c) Losses Analysis Check Sheet (LACS): This sheet is used to record and analyze the performance of the process in forms of operational availability and loss percentage.
d) Standardized Work Combination Table (SWCT): This sheet is used to demonstrate the time relationship between manual work, machine work and walking, and the takt time. It indicates the flow of operators work within the operation in a single work or known as element process to indicate precisely how much time is needed for each element. This SWCT is normally used as the main reference as a production area to aid operators by visualizing the work sequence
of the operation. It informs the operator how they should perform the task to keep the pace and to stay on schedule.
e) Operator Balance Chart (OBC): This chart is used to visualize all the workloads in a set of process and compare them between the workstation and to takt time. It also shows the time required to conduct every element during the process for each workstation. Through the OBC, the equilibrium of workloads between workstations can be easily shown. The best production line is when the workloads between workstations are totally equal or nearly equal and closely matches the line takt time.
f) Standardized Work Chart (SWC): This chart is used to visualize the layout of a production area to be studied. It also used to show the work sequence, the quantity of standard in-process part in the line and movement of the operator to complete a set of elemental process.
g) Production Capacity Check Sheet (PCCS): This sheet is used to determine machine's capacity and also to identify the bottleneck in the process. This is because one of the lean concepts is the operators and the machines must all be balanced to takt time. h) Cell Kaizen Target Sheet (CKTS): To record
identified lean metrics before and after an implementation of improvement activities.
i) Cell Debugging Checklist (CDC): Used as a checklist to evaluate an improved area.
Cycle time reduction
consistently, efficiently, safely while ensuring quality, defect-free and on-time delivery [1].
Cycle Time is the amount of time that the vehicle/unit is physically in the workstation [2]. According to Puvanasvaran, Teoh and Tay [11], cycle time difficult to be defined whereas the speed loss, minor stoppage, and idling are hardly to be differentiated from the waiting time. Fahmi and Abdelwahab [12] highlights that, reduction in work in process and cycle time helped key out many deficiencies. For example, the delay in product packing after processing was notified and the delay in coil transfer to the next process or the delay in quality decision was visible. By reducing the variability in the cycle time by using an estimation based on the time study, the accuracy of the delivery time increased because the production planning team is able to forecast the processing time with less deviation.
Less cycle time means that there are less action, less work in process, less rework and defects, less plant troubles, shorter time to respond to market changes, increase in on time delivery, increase in employee morale, and improvement of financial measures on the long term [4] [12]. By reducing the cycle time, it will increase the abilities of each worker towards the jobs on designated workstations for high productivity, and lower rejection rate. [13].
Van Goubergen state that it is very important to reduce machine setup time during the implementation of lean manufacturing because this time has a significant impact on manufacturing costs due to decreasing sizes of series orders [14]. The reduction of machine setup time can be justified by:
a. Greater flexibility of the company (the company can offer customers more products and their variants in smaller series).
b. Higher throughput through company bottlenecks (reduced setup times of bottleneck machines ensure higher throughput).
c. Increased efficiency of the company (by reducing machine setup time, the efficiency of these machines increases, which increases company income).
Furthermore, he state that the quality of machine setup is defined by three parameters which is:
a) The method used for machine setup (how).
b) Organization of work needed for machine setup (who, what, when).
c) Technical aspects of tools and devices.
METHODOLOGY
This case study was conducted at ceramic company, where the study was carried out in the pressing process at substrate department. The study is focusing on developing an efficient method in reducing the cycle time of coil setup at pressing machine in the pressing process. The execution of this study only concentrates on the production line that produces high value products. The study starts with an initial observation by observing the
worker, in order to identify the cause and the variety method that exists in the coil setup. Seconds, the cycle time of each method was recorded in the TMS. The time was recorded from the arrival of the raw material until the pressing machine starts running. The data from the TMS will be transferred into SWCT in order to identify the condition for each method. If the cycle time is exceeded the takt line in the SWCT, means that the method unable to satisfy the customer demand. Next, in order to identify the workflow and work sequence of the operator, the SWC was developed for each method based on the data from SWCT. Then, the cycle time for each method will be compared, and the methods that have the lowest cycle time will be chosen as a baseline. Lastly, a method that has the lowest cycle will be analyzed using SMED technique.
RESULT AND DISCUSSIONS
Observation
The observation was carried entirely on the pressing machine in the production line 1 which produces high value products. The process flow of the coil has been created in order to document the variation method for coil setup that exists in the process. It has been identified that there is a total of 4 different methods that the machine operator frequently done when setup the new coil, as show in Appendix A. Each method starts with the checking the WIP tag on the ceramic coil that contains the information about the dimension and the weight of the coil. This initial step is important to ensure the size and dimension of the ceramic coil is suitable with pressing machine.
Time Measurement Sheet (TMS)
The operation was timed for ten cycles for each four method in order to increase the accuracy of the data. Table-1 showed the average cycle time of the coil setup for each method.
Table-1. Average cycle time for coil setup.
Method Manual time (Second) Machine time (Second) Walking time (Second) Average cycle time (Second)
1 311 0 50 361
2 334 0 50 384
3 313 0 61 374
4 330 0 70 400
cycle time to complete the coil setup process is 400 seconds where it is equivalent to 6 minutes 40 seconds.
Takt Time
The line takt time was established by using the equation 1. The Table-2 showed how the takt time was calculated and details of information required calculating the takt time.
Takt Time = 𝑇𝑜𝑡 𝑇𝑖 𝑒 𝐴𝑣 𝑖𝑇 𝑒
𝑁 𝑖 𝐷 𝑦
Table-2. Takt time calculation.
Takt time calculation Working shifts
per day 2 Shifts
Hours per shift 12 Hours Break time per
shift 30 Minutes
Lunch time per
shift 30 Minutes
Planned downtime per
shift
10 Minutes
Customer
demand per day 220 Per coil Available time
per shift 720 Minutes Net working
time per shift
650 39,000
Minutes Seconds Net avaible time
per day 78,000 Seconds Takt time 355 Seconds per coil
In order to satisfy the customer demand, the machine operator needs to perform the coil setup operation in 355 seconds per coil. If the coil setup operation is more than 335 seconds, the bottleneck will occur for the pressing machine and this will delay the overall process and affect the product delivery time to the customer.
Standardize Work Combination Table (SWCT) Each method shows different cycle time, where the total cycle time for Method 1 is 358 seconds, Method 2 is 384 seconds, Method 3 is 374 seconds and Method 4 is 400 seconds. This is shown in the Figure-1. The SWCT for method 1 to 4 were shown in Appendix 1, 2, 3 and 4 respectively. By comparing SWCT of each method, the walking time for Method 1 and Method 2 is 50 seconds, which is much lower compared to the other methods and the walking time for the Method 4 is the longest. However, the cycle time for Method 1 is 5.93% lower compared to the Method 2 due to the differences manual time? Even though, Method 1 has the shortest cycle time, still it has exceeded the takt time of the process which is 355 seconds, where Method 1 unable to satisfy the customer demand.
Standard Work Chart (SWC)
The movement of the operators for each method has been mapped together with the sequence of the task. There is a total of five workstations; the Pressing Machine, Conveyor, Coil Stand, Fresh Coil Trolley and Dustbin. Thus, there are eight movements that operator performed in the Method 1 and Method 2, nine movements in Method 3 and 10 movements in Method 4. Therefore, the reason why the Method 4 has the highest total cycle time is due to the numerous movement of the operator, where the movement has contributed to the excessive walking time, which is 70 seconds.
Single Minute Exchange Dies (SMED)
There are four steps that have been used in implementing the SMED in the coil setup operation, which is identify plot area, identify the elements, separate external elements and lastly convert internal elements to external elements.
First, bar chart is used to identify plot area. The average cycle time for coil setup data of all method was translated into the bar chart to select which method will be the target area for the pilot of the SMED and act as a baseline time for the changeover. Figure-1 showed a bar chart of the coil setup time for each of the methods. The chart was used to compare and track the changes over time, between Method 1 until Method 4.
Figure-1. Coil setup time.
Based on the bar chart above, each of the coil cycle time of every method is inconsistence to each other. Furthermore, it has been identified that Method 1 has the lowest duration time for the coil setup compared to the other methods which is 361 seconds, equivalent to 6 minutes and 1 second. However, Method 4 have the highest duration of the coil cycle time, which is 400 seconds, equivalent to 6 minutes and 40 seconds. Therefore, Method 1 was selected as a benchmark for the changeover time and reference for the improvement using SMED method. 320 340 360 380 400 420
Method 1 Method 2 Method 3 Method 4
Table-3. Setup identification.
Operation
No. Description Activity
Time (sec)
1 Check coil WIP
tag External 3
2 Stop the pressing
machine Internal 1
3
Remove the finished ceramic
coil
Internal 15
4
Throw the finished coil into
the dustbin
Internal 7
5
Replace the fresh coil at the coil
stand
Internal 15
6 Setup coil sheet
on the conveyor Internal 49
7
Remove the leftover coil sheet at the
conveyor
Internal 11
8 Mold cleaning Internal 113
9 Adjust the
alignment Internal 13 10 Pre-pressing Internal 93
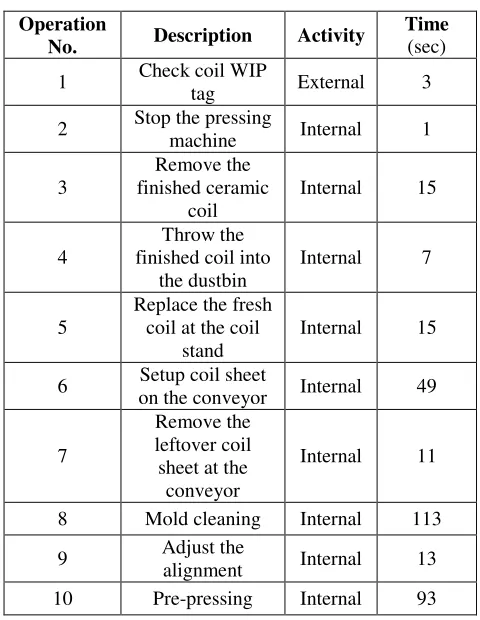
[image:5.596.49.289.107.417.2]A detail observation has been executed on the Method 1 in order to identify the external and internal setup of the process. Table-3 below showed that check coil WIP tag is the only external setup in the process element that exist in the Method 1, where the total time for the coil setup operation for Method 1 is 320 seconds without including the walking time and there’s only one external setup in the processes.
Table-4. Classification of setup.
External
setup Internal setup Check WIP Stop the pressing machine
Remove the finished ceramic coil Throw the finished coil into the
dustbin
Replace the fresh coil at the coil stand
Setup coil sheet on the conveyor Remove the leftover coil sheet at the
conveyor Mold cleaning
Adjust the alignment
Pre-pressing
The setup operations from Table-3 were analyzed in order not only to separate internal from external operations, as well as to identify external operations that were occurring together with internal operations. As a result, Table-4 shows the classification of the coil setup based on Table-3.
For the last phase of SMED, the current changeover process was carefully analyzed, so the internal setup of processes element in the Method 1 could be converted into external setup as much as possible. The element was selected with the consideration that the process element could be performed either with the minimal modification or no change, that it can be completed while the machine is running. Thus, it will result in a list of elements that are candidates for further action. This list has been prioritized so the most promising candidates could be acted on first.
Table-5. Conversion of internal setup to external setup.
External setup Internal setup
Check WIP Stop the pressing machine Remove the finished
ceramic coil
Setup coil sheet on the conveyor Throw the finished coil
into the dustbin
Remove the leftover coil sheet at the conveyor Replace the fresh coil at
the coil stand Mold cleaning Adjust the alignment
Pre-pressing
Table 4.5 shows the improvement that has been made in the coil setup operation of Method 1 by conversion of internal setup to external setup. Three processes element in the internal setup which is Remove the Finished Ceramic Coil, Throw the Finished Coil into the Dustbin and Replace the Fresh Coil at the Coil Stand have been converted into external element. It has been found that these three process elements could be done without interrupting or stopping the machine. Therefore, the processes element in the external setup was increased from one to four elements, and the internal setup was reduced to six processes element. The process steps and time required to complete one cycle of work were recorded in a SWCT as in Appendix 5.
ANALYZE AND DISCUSSION
[image:5.596.50.289.110.418.2] [image:5.596.307.546.318.463.2]Table-6. Summary of improvement results.
Before conversion After conversion Time
(second)
Percentage (%)
Time (second)
Percentage (%) External
setup 3s 1% 40s 12%
Internal
setup 317s 99% 280s 88%
Figure-2 below showed the cycle time for the new method is much lower compared to the other method which is 345 seconds equivalent to 5 minutes 45 seconds. Furthermore, the walking time for the new method is 28 seconds, which is 11% lower compared to the other method. Therefore, the new method is much more efficient compare to the other method. By comparing the SWC of the new method and Method 1, it has been founded the movement of the operator during the coil setup operation was reduced from eight places to seven places. Thus, not only the movement of the operator has been reduced, the walking distances also have been shortened up by 44%. Moreover, in by analyzing the new methods using SWCT, shown that the cycle time obtains from the new method was lower than the takt time by 15 seconds. Therefore, this new method is able to satisfy and meet the customer demand.
Figure-2. Cycle time of coil setup.
From the past studies that has been done by Halim et al. [1], it has been identified that by using the following method they able to reduce the cycle time by 16.0%, which is from 78.0 sec to 65.5 sec, and managed to be lower than takt time. Subsequently, the production output also increased from 45 pieces to 54 pieces per man hour and attainment from 95.79% to 98.95%. Furthermore, the average overtime of the workers was reduced from 193.56 hours to 55.0 hours per month. The last metrics show that the shop floor area was managed to reduce by 18.18%, which is from 22m³ to 18m³. In addition, by using a similar approach, Jaffar et al. [5] able to reduce the cycle time with a 5.97 % reduction in their studies. Besides that, with the aids of the SW tools such as SWCT, OBC, SWC, PCCS and CDC, total walk times were also reduced by 10.80%. Therefore, with the similar method and approach that have been used in this study, it has been identified that
the outcome of this study, able to obtain a similar result with the past studies, where the cycle time of the processes has been reduced by 4.43%, which is from 361.00 sec to 345 sec, and the cycle time managed to be lower than takt time. Plus, the walking time and the walking distance also have been reduced by 44%. Therefore the SOP was developed as shown in Figure 3 based on the new method that has been identified. Simple illustration is used to visualize the way to perform task and worker can understand the process steps with the SOP.
0 100 200 300 400 500
Method 1Method 2Method 3Method 4 New method Walking
Machine
Figure-3. New SOP.
Figure-4. Advantages of the new SOP.
Figure-4 above shows the advantages of the new SOP by comparing with the Method 1. The cycle time of the new method is much shorter compared to the Method 1 where the time taken to finish one coil by using new method is 345 seconds? Moreover, by using the new method, the non-added value of the processes is reduced from 81 seconds to 59 seconds. Therefore, the new method is much more efficient compared to the other methods.
CONCLUSIONS
It’s been identified that there are four different methods that the machine operators usually perform which lead to the inconsistent and vary in coil setup operation. A
new method has been developed through SMED technique by identifying the internal and external setup that exists in the process element, then converting the internal setup into external setup by using Method 1 as a baseline for the improvement. Thus, the coil setup time of the new method is 345 second, which is lower compared to the other method and it able to reduce the non-added value by 6.37%. Through this study, a new SOP has been developed for coil setup operation at the pressing machine. With the new SOP the machine operators able carry out the task correctly and ensure that there are no steps that are missed during the coil setup operations. Therefore, the SOP of the new method able to provide the machine operators detailed instructions on how to carry out a task and help to provide a reference resource for trainees.
ACKNOWLEDGEMENT
The author would like to express his acknowledgement to sponsor of a fund due to the financial support throughout the period at which research was carried out. The Fundamental Research Grant Scheme
(FRGS) provided is coded
FRGS_12015TK03FKP02F00279.
REFERENCES
[1] Halim N. H. A., Jaffar A., Yusof N., Jaafar R., Adnan A. N., Salleh N. A. M. and Azira N. N. 2015. Standardized work in tps production line. Jurnal Teknologi (Sciences & Engineering). 76(6): 73-78. doi: http://dx.doi.org/10.11113/jt.v76.5681.
[2] El-khalil R. and Zeaiter H. 2015. Improving automotive efficiency through lean management tools: A case study. International Journal of Social, Behavioral, Educational, Economic, Business and Industrial Engineering. 9(1): 314-321.
[3] Emiliani M. L. 2008. Standardized work for executive leadership. Leadership & Organization Development Journal. 29(1): 24-46. doi: 10.1108/01437730810845289.
[4] Johansson P. E., Lezama T., Malmsköld L., Sjögren B. and Ahlström L. M. 2013. Current state of standardized work in automotive industry in Sweden. Procedia CIRP, 7: 151-156. doi: 10.1016/j.procir.2013.05.026.
[5] Jaffar A., Halim N. H. A. and Yusoff N. 2012. Effective data collection and analysis for efficient implementation of Standardized Work (SW). Journal of Mechanical Engineering. 9(1): 45-78.
[6] Badrinarayan S. and Sharma S. 2014. Enhanced productivity through standardized work cell - A case 286
280
59 81
0 100 200 300 400
New Method Method 1
New Method Method 1
Added value 286 280
of standard work Kaizen applied to valve assembly process w.r.t to a valve manufacturing organization in Pune. GE - International Journal of Engineering Research. 2(3): 49-59.
[7] Kumar R. and Kumar V. 2014. Literature review and implications of standard work implementation in Indian industry- A case study. International Journal of Latest Trends in Engineering and Technology (IJLTET). 4(3): 50-63.
[8] Rewers P., Mandziuk M. and Trojanowska J. 2015. Applications use standardized work purpose of increase the production capacity - A case study. Poznan University of Technology. 5(2): 191-200.
[9] Kurilova J. 2010. Developing standardize work in casting department. (Master’s Thesis In the field of Quality Technology and Management Department of Manufacturing Management and Engineering Linkoping 201).
[10]Olson M. and Villeius E. 2011. Increased usage of standardized work instructions. (Master of Science Thesis in the Master Degree Programme, Production Engineering Malin Department of Product and Production Development Division of Production
Systems Chalmers University of Technology Göteborg, Sweden).
[11]Puvanasvaran P., Teoh Y.S. and Tay C.C. 2013. Consideration of demand rate in Overall Equipment Effectiveness (OEE) on equipment with constant process time. Journal of Industrial Engineering and Management. 6(2): 507-524. doi: http://dx.doi.org/10.3926/jiem.537.
[12]Fahmi S. M. and Abdelwahab T. M. 2012. Case study: Improving production planning in steel industry in light of lean principles. Proceeding of International conference on Industrial Engineering and Operation Management, Istanbul (Turkey), 3-6 July.
[13]Sihombing H., Akbar H., Perumal P., Yaakob M. Y. and Razak J. 2012. Real of simply assembly line balancing using fact-model. International Journal of Computer and Electrical Engineering. 4(6): 870-874. doi: 10.13140/2.1.1552.8961
Appendix 1
Appendix 3