Study of Spatial Variability into Contaminated Soil using
Kriging Techniques at Basrah
Ahmad Shukri Yahya, Fauziah Ahmad, Mohammed Khudheir
School of Civil Engineering, Universiti Sains Malaysia (USM), Engineering Campus, Nibong Tebal 14300, Penang, Malaysia
Abstract- Depleted Uranium (DU) ammunitions were used by the U.S.A and UK troops in an open environment for the first time in history against Iraq on civilians and military targets during Gulf wars in 1991-2003. Spatial distribution and risk assessment of soil in the estimated sites at Basrah Governorate with uranium contaminations have been screened using statistics and geographic information system (GIS) methods, and a performance model of predication distribution and potential distant values of DU and other polluted components were detected by data collection. An interpolation technique was practiced in order to accomplish certainties in the data set and to decrease the influence of outliers. After choosing a tailored model, parameters can be recycled with the data to estimate Uranium concentrations at unsampled locations using the kriging technique to define the weights of adjacent monitoring in the predicating underground surfaces similar to contaminated elements and radionuclides of uranium chains. The problem appears when were increased in the deaths and congenital malformations resulted from carcinogenic diseases among Basrah population, after 1994 of due to use of DU extensively in these regions. The primary purpose of this paper is to present the current state of the determine DU sites and to predict in adjacent points of specific locations using different techniques. A review is provided aiming to discuss the effect of pollution by DU and transferring the pollutants to groundwater.
Index Terms- Contaminated Soil; Kriging Technique; Spatial Variability; Depleted Uranium; Contaminants Transport; Groundwater prediction; Healthiness Risks
I. INTRODUCTION
[image:1.612.31.581.508.568.2]ranium is a severe silvery-white, ductile and lightly paramagnetic metal, which is pyrophoric when lastly involved it is slightly softer than steel and reacts with water when present in a finely divided state. In air, it naturally oxidizes and transforms shielded with a layer of oxide. All isotopes of uranium are radioactive. although generally believed of as infrequent is more ordinary in environment than other elements such as cadmium, selenium, cesium in addition to some of the infrequent elements (Bowen,1979; Kay and laby, 1995). DU is different from natural uranium by lesser percentage concentrations of 235U (0.7%) and 234U. In typical DU, the purport of 235U is about one-third of its original value (0.2– 0.3%). Subsequently, the activity of DU is about 60% of the activity of natural uranium. Depleted uranium may comprise traces of 236U and 239+240 Pu of cross-contamination. Metallic uranium is 65% more ambiguous, than instructor, has a high dissolving point (11328C) and is exceedingly pyrophoric as table1. (Burkart, et al., 2004).
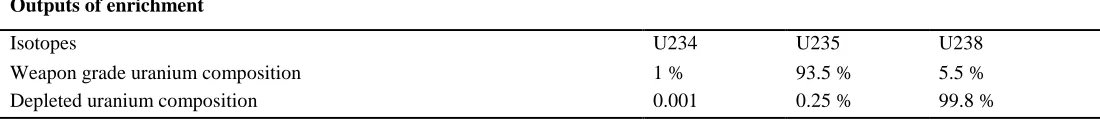
Table 1: Shows the Outputs of enrichment uranium isotopes:
Outputs of enrichment
U238 U235
U234 Isotopes
5.5 % 93.5 %
1 % Weapon grade uranium composition
99.8 % 0.25 %
0.001 Depleted uranium composition
The process of conducting the DU risk assessment which involves selecting reference values, obtaining concentrations in environmental media, and identifying exposure parameters. Additionally, it is associated with exposure models which include benchmarks, site characteristics and chemical properties. Exposure parameters have been formulated in the database, and then behavioral studies were based on remediation of these contaminants and exposure of any material radioactive (Paustenbach, 2000).
II. DISTRIBUTION OF CONTAMINATED SOILS BY DU
Different ways have contributed to spread of pollution, such as the migration of DU to the surface and underground water, it and can be incorporated ultimately into the food chain by corrosion process of ammunitions. Inhalation of DU dust through the war period, and ingestion contaminated water or food after the war also paid to spread contamination. Thus, groundwater based on several studies on formation the suitable method to simulate the groundwater zone, integrated assessment of thematic maps using a develop model based on GIS techniques is the most suitable procedure for groundwater potential zones prediction (Eliza et al., 2010).
Amounts of DU weapons were estimated at Iraq between 320 – 800 tons, which used against Iraq since the first Gulf War in 1991. The use of DU bullets and projectiles on Iraqi region hasn’t stopped since 1991, also the 1998 attack on Iraq. Then, big invasion was come in these areas at 2003 and spending more than last wars of DU weaponries (William, 2002). But USA Group green peace and Holland larka institute (1999) have been proved that about (700-800) ton of DU were used in southern operational of Iraq. These amounts of DU are containing of radiation to enough of (500000) case threaten in death. Big amounts of DU were led to high chemical toxicity more than 700000 times, of the dust dispersion in the DU projectiles factory at 1980, which follower to US defense ministry, collony city, New York.
USA and its allies militaries were used DU projectiles in seriously residential areas this time, such as in Basrah. So, Japanese scientists have been measured the radioactive nuclides for 238U and decay series. Many of the numbers of sampling was collected from different sites of the southern Iraq, they are
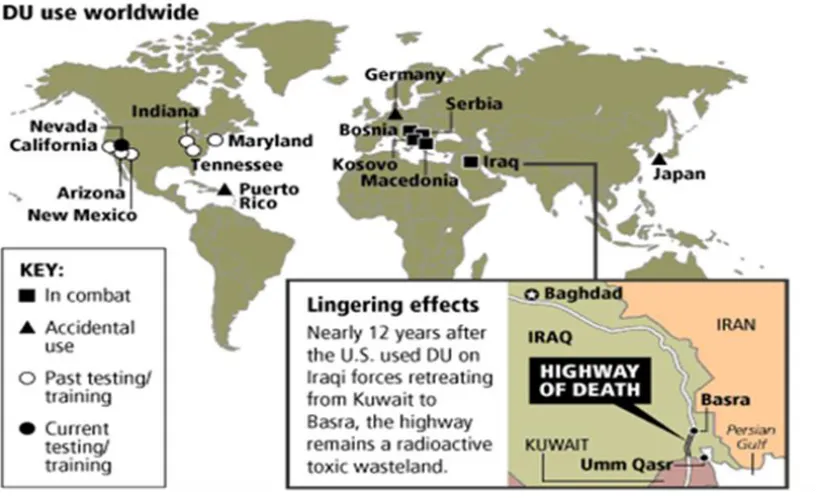
[image:2.612.103.513.282.531.2]utilized Gamma spectrometry High purity Germanium analyzer and they had gotten increases in the radionuclides concentrations in the core samples after 2003 war. Those are due to exist high amounts of DU fragments, bullets, missiles, and munitions, were all used in the locations of martial actions (Komura et al., 2003). The global DU waste stockpiles all around the world have been estimated to be 1.3 million tons in 2001 by a yearly upsurge of 50,000 tones [48]. Ecological administrations, groups, and campaigners have been occupied last twenty years to forbiddance DU arm. There are three US corporations that products great caliber DU rounds are provided most of the countries which they are consider assistance USA to implementation all their planners. So there are eighteen countries are supposed to have DU weaponries in their armed. These comprise of UK, USA, France, Russia, Bahrain, Egypt, Oman, Thailand, Kingdom Saudi Arabia, China, India, Taiwan, Greece, Turkey, Israel, Kuwait, Pakistan, and Jordan (Dug Weir, 2007) as in figure 1.
Fig. 1: Map of world explain Depleted Uranium in Iraq and around the world
III. DATA DESCRIPTIONS
The proposed study will include taking different contaminated samples of many of parameters that are soil, air, water, doses, cancer cases, and biological samples from diverse departments such as institutes, universities, environmental, and health ministries. Data collect and developed in the database to determine the DU concentrations which will leads to various carcinogenic hazards on human body. These samples will be taken from different locally registered data for the last twenty years and create a mathematical model representing them. The meant data will be modeled statistically, a further studies will be presented to show that possible future hazards on human health, plants and animals. Also may be continuous to decades or centuries due to transfer DU contaminants to underground water.
So there are many methods were used effectively to study contamination and attempt to define unsampled sites, one of these procedures are kriging techniques that uses to predict unknown points at specific locations.
The aim of this paper is to give an overview of the present features by employing geostatistical interpolation. Also, to utilize kriging technique in predictions of the supporting data and to develop the methodology and procedures in detail. Also, to a gain knowledge during a literature reviews about prediction of the contamination at Basrah governorate and define hot-spots in this areas, including the use of ancillary data.
IV. GEOSTATISTICAL INTERPOLATION TECHNIQUES
This paper presents an overview of interpolation techniques with a precise emphasis on the characteristics of significance to its implementations for determination of hazard in the mining manufacturing, but ,some sites has implementations that different from others, might be the pollutants elements are concentrated in these sites. Nevertheless, we as well briefly show the connotations of interpolation and diverse methods to interpolate unsampled pointes from other known points at specific locations. This is a review paper proposing to briefly the comprehensive field of geostatistical interpolation. As such, an extensive index is given. These indices exceeds the papers mentioned in the manuscript of this paper and is aimed to give people guidance of the main references. So, many researchers investigated the effect of pollutant elements on the properties of contaminated soil by conducted series of tests using geostatistical interpolation with many kinds of kriging techniques:
Geological methods, involving interpretation of geologic data and field exploration, represent an important first step in any groundwater investigation. The various surficial parameters prepared from remotely sensed data and ancillary data can be integrated and analyzed through GIS to predict the potential of groundwater zone, and to monitor and conserve this important pollutant resource. And also characteristics of underground water may be helpful to explore and understand the natural resources of groundwater and its potential area and the mapping of the area (Eliza et al., 2010).
Arc GIS geostatistical analyst 2001, can be used to explore data variability, look for outliers of data to examine global trends, and to investigate spatial autocorrelation and the correlation between multiple dataset. Also, It creates prediction of standard errors with the probability that particular threshold was exceeded. Quantity maps used various geostatistical interpolation techniques are based on statistics which not only produce prediction surfaces, but also error and indecision of surfaces. Thus, this analyst provides many tools and defaults which can be help to create surfaces quickly. GIS gives a very effective tool for generating maps and statistical reports from a database. However, GIS functionality far exceeds the purposes of mapping and report compilation, database management systems and automated cartography. The most significant uses of GIS are spatial analysis capabilities. As spatial information is prearranged in a GIS, spatial analysis is the vigorous part of GIS. It can be done in two ways; one is the vector-based and the other is raster-based analysis. Two essential tasks of GIS have been extensively recognized; cohort of maps and a cohort of tabular reports; Satellite Remote Sensing and GIS applications in agricultural meteorology (Raju, 2004).
The spatial distribution of soil nutrient factors laid a foundation for further assessment of soil fertility, the prediction
is made possible by the existence of spatial dependence between observations as assessed by the correlogram or Semivariogram. The variance analysis and the geostatistical methods are used to determine the relative interpolation accuracy of each soil nutrient factors. Thus, the appropriate lag size was found and it became the stationary parameters along with isotropy, transform methods and neighborhood reference in order to select the optimal interpolation model that ensures the accuracy of the kriged results acceptable (Shen and Sarris, 2009).
The object of probabilistic risk assessment is to discover a rational and scientifically justified method of dealing with uncertainty of variability; probabilistic method can be applied to explicate the uncertainty in the parameters within a specific exposure model, and how this uncertainty might be influencing to estimate the outcome. Choice of model and its structure is a basic uncertainty factor when evaluating exposure risks in contaminated land (US EPA, 2001).
V. CONTAMINATED ELEMENTS PREDICTION
There are many elements were occurred different types of contamination in the environment. So, some methods used to explore and study the spatial structure and predictions with these contaminated elements particularly decay series of 238U, such as radon gas of the soil in south Italy, by chosen a kriging algorithm. Then, compare the prediction models among ordinary kriging, lognormal kriging, ordinary multi-Gaussian kriging, and ordinary indicator cokriging. There are many measures of accuracy; the mean absolute error, the mean squared error of prediction, the mean relative error, and a measure of effectiveness. So, showed that the multi-Gaussian kriging was the most accurate approach among those considered. The first step to understand spatial variation of radon gas, and mapping radon potential at any site. To compare the prediction performance in other areas, studies need to relate spatial variation to the lithology. (Buttafuoco et al., 2007).
Maroju, (2001) defined the weights of neighboring observation in the prediction procedure of semivariogram model where kriging has been used successfully in predicting underground water surfaces and to determine under earth levels such as our bodies, soil nutrients and mechanism of element displacement. Also ordinary Kriging was chosen and geometric means of radon gas (Rn) were evaluated for unmeasured zip codes, and this technique was used on the radon datasets to obtain a prediction maps and to present the impact of these results.
Radium content usually ranges from 10 to 100 Bq kg−1 at surface soil and from 15.27 to 47.27 Bq kg−1 in rocks (Nazaroff 1992; Verdelocco et al., 2000). The total production rate of radon in soil is equivalent to the radium content (Nazaroff, 1992). Radon migration is known to be anomalously large on effectiveness faults (Baubron et al., 2002; King et al., 1996; Torgersen and O’Donnell, 1991) and shows temporal variation related to changing atmospheric conditions. As observed increases in spatial distribution of radon gas due to expose to natural radiological sources. It is difficult to use spatial variation of measured radon concentration in indoor air, as its distribution is based on many parameters that are difficult to evaluate, which are divided into two groups as locally dependent factors and time-dependent factors (Baixeras et al., 1996; Virk 1999; Zhu et al., 1998).
The latter was calibrated using a radioactive source of 226Ra having an equilibrium activity with 226Ra of 222.96 kBq with an efficiency of 74.5%. Lucas cells were also calibrated, later to ensure radioactive equilibrium, that “noise” of other isotopes with alpha-radiation emission in the decay was avoided (Winkler et al., 2001).The prediction set was used to create a spatial model and predict the radon gas at locations in the corresponding validation set, thus providing an independent assessment of the prediction quality. It is unlikely that one method will produce the best estimate at all locations. Comparing radon anomalies with lithology and fault locations, no evidence of a strict correlation between type of outcropping terrain and radon anomalies was found, except in the western sector where there were granitic and gneissic terrain. A statistical link between them would be enable to use geology as an indication of where radon levels (Badr et al., 1996).
A scatter plot of measured versus predicted values provided additional evidence on how well an estimation method has performed. The best possible estimates would match the measured values and therefore the slope of the scatter plot should be close to 1. Lastly the map of Rn concentration was computed on a 50 m×50 m grid using ordinary multi-Gaussian kriging. The nugget effect is a discontinuity at the origin of the variogram and relates to measurement errors and to spatial sources of variations at distances smaller than the shortest sampling interval (Journel and Huijbregts, 1978). Type of anisotropy is evident from the differences in sill in different directions; it reflects the effect of fractures and errors on the spatial distribution of radon gas, because they act as a preferred way of gas migration (Tansi et al., 2005).
Kriging interpolated map has shown areas with high values of lead Pb concentrations. The good variogram structure of Pb is observed, revealing that there are clear spatial patterns of Pb on the distribution map and also that the current sampling density is ample to reveal such spatial patterns. The probability map was produced depending on the kriging interpolation and kriging standard deviation that provides useful information for hazard assessment and decision support. So, explicit monitoring points were used to observe, assess the main sources and pollution levels in the polluted regions. Then mathematical models are applied to distinguish Unknown values and, and also to compare and combine all data to use in predications (Batmunkh et al., 2007).
A majority of the spatial variability and soil dependence in the landscape may have been caused by interactive effects of micro-topography and hydrologic conditions. As verified by the kriging analysis, plants that were grown in flooded plots with gypsum treatment had higher dry matter yields. The Variability of individual physicochemical properties of soil as indicated by CVs differed widely and significantly (p ≤ 0.01) among sampling sites and transects directions. The resulting landscape signatures and functional integrity may likely affect several abiotic and biotic components of a wetland ecosystem. The deleterious effects of Na on soil structure and plant growth have led to removal of Na from soils, usually by replacement with Ca. The emphasis in the reclamation of alkali soils is usually on reducing the Na to less than 15% of the exchange capacity (Sigua and Hudnall, 1991).
Lefohn et, al., (1987) used the method of Lagrange multipliers to solve the constrained optimization problem. The variograms used in kriging were derived from a linear rather than a spherical model. In 1982 monitoring sites were used in the kriging analyses and each cell was estimated using the nearest five monitoring sites. It could not be found within 500 km, the cell was estimated by using a site's 7-h average if the site was located within 30 km; the cell was not estimated if either of the two criteria was not met. There was a 1-ppb per degree latitude southerly increasing from Minnesota to Missouri. While trend-surface, triangulation, and moving average models are alternative approaches to the kriging method, assumptions built into each of the models may not provide completely satisfactory results. Zeng and Huang, (2007); Manthena et al., (2009) were showed that Kriging is a geostatistical interpolation performance which used to design model of variography, and to interpolate the value of a random fields at unobserved from observation values at neighboring locations. So, the spatial structure of the data was implemented predicting and quantifying by kriging. Based on the autocorrelation of the element concentrations between two points. Statistical and Spatial analyses were performed for the sampling data of these variables in detail, and the corresponding to interpolation model was determined after many tests.
Kriging is not a good estimator in those cases and precision differences by means of semivariograms for each soil type or a pooled Semivariogram are negligible. Predictions by using kriging interpolation show less bias. The predictions of these properties using soil maps are also less accurate than those obtained by kringing. Nevertheless, no improvement is obtained when using a soil-separated by Semivariogram in kriging predictions in Xhantic Ferralsols. Combined kriging soil-map procedure was reduced effectually the bias that found in soil map predictions. It seems to be related to the greater variability of these soils, as well as the small datasets were provided for Semivariogram calculations (Utset et al., 2000).
water content and net-precipitation can be used to improve interpolations. Coleman and Li, (1996) were used standard Matlab subspace trust region algorithm that depend on the interior-reflective Newton method to prevent the iteration, due to the initial choice of parameters which were fitted with 500 randomly chosen of initial parameter sets.
Kriging means spatial prediction used to soil properties. It is a form of weighted local averaging that provides estimates of values at unrecorded places without bias and with minimum and known variance. It has also been used to make regional estimates with substantial gains in precision over traditional practice, and to describe the structure of spatial dependence, both for isotropically varying soil properties and for anisotropic properties that vary in different locations (Vieira et al., 1983; Webster and Burgess, 1980). Ordinary Kriging is the most common geostatistical estimator. It assumes that the mean is unknown and computes the unsampled value as a linear combination of the neighboring observations (Goovaerts, 1997). Tomas Oberg & Boberback, (2010) indicated that radiation activities should be recognized and they should quantify the uncertainty to prediction of risks, also can be achieved by applying probabilistic methods. Therefore Kriging analyses of soil properties were suggested that both gypsum addition and water management should become a major part of marsh revegetation and restoration programs. Limiting the range of soil variables permits more accurate predictions for expected response to alternative soil management inputs and land contaminated use as in marsh, and to develop a stochastic model that may describe the potential capabilities of land use. The hazard foundation is the soil contaminant and the endangered object could be a human, an animal or plant species.
The function used to model the experimental variogram must be a conditionally negative definite to ensure that the kriging variances are positive, to build a model that describes the major spatial variations features under study. The best fitting function can be chosen by cross-validation, that verified by compatibility between the data and the model. It takes each data point in turn, removing it temporarily from the data set and using its adjacent information to predict the value of the variable at its location. The estimate is compared with the measured value by calculating the experimental error. The accuracy of spatial maps depends on many factors, such as sample density, sample configuration, and prediction methods (Gotway et al., 1996). Asymmetry is the most common form of departure from normality; positively skewed data are encountered in many fields. The variogram is sensitive to outliers in the data and its behavior is affected by a few very large or small values. Kriging chosen should depend on the characteristics of the data. Lognormal kriging (Dowd, 1982), multi-Gaussian kriging (Verly, 1983), and indicator kriging (Journel, 1983), could deal with skewed data, to explore the spatial structure of soil gas radon concentration in south Italy and to compare the prediction performances of the four different kriging algorithms (Webster and Oliver, 2001).
Kriging basics include stationary covariance process and compare kriging with regression, and summarize standard designs for kriging Meta models, by presenting unique designs that are consecutive and modified using cross-validation. Regression models such as polynomials are useful in the local
search for optimization and in screening for identification of the most important factors. In distribution-free bootstrapping, and investigating the effects of non-constant variances which occur in queuing simulations, common random numbers and non-normality, kriging uses maximum likelihood estimators of the weights, which assume normality. Comparisons of different Meta model types as polynomial regression, Kriging, splines, rational functions remain a challenging problem (Beers and Kleijnen, 2004).
VI. CONCLUSIONS
Many of techniques were used in the interpolation prediction such as geostatistical, geological, and kriging to predict unknown points of adjacent samples at specific locations. Kriging technique was considered the best estimator in the prediction and comprise of more kinds to interpolate soil properties, which are ordinary kriging, universal kriging, simple kriging, multi-Gaussian, ordinary indicator cokriging and linear regression models in combination with kriging. A spatial interpolation technique called kriging is widely applied in soil studies. It is uses to reduce the cost of sampling and analysis for mapping pollutant, and uses the semi-variogram to quantify the spatial variation of a regionalized variable.
In this paper we utilized kriging due to has ability to interpolate contaminated elements in different sites and for long terms. There are many measures of accuracy and cross-validation; like the mean absolute error, the mean squared error of prediction, the mean relative error, and a measure of effectiveness were used to compare prediction performance in different sites, define precision levels among them, and mapping contaminant elements potential at any site. So, showed that the multi-Gaussian kriging was the most accurate approach among those considered.
REFERENCES
[1] Batmunkh S., Garidkhuu J., Bekhtur M. Ecological map of Ulaanbaatar city (M1:10000) Institute 978-1-4244-3589-0/07 $20.00, 2007 IEEE 637 of Thermal Engineering and Industrial Ecology, Ulaanbaatar, 1995. Final Report .155 p.
[2] Badr, I., Oliver, M. A., & Durrani, S. A. (1996). Statistical evidence of the geological control over radon soil gas concentrations and its implications for mapping radon potential. Radiation Protection Dosimetry, 63, 281–291. [3] Baixeras, C., Font, L. I., Robles, B., & Gutierrez, J. (1996). Indoor radon
survey in the most populated areas in Spain. Environment International, 22, S671–S676.
[4] Baubron, J. C., Rigo, A., & Toutain, J. P. (2002). Soil gas profiles as a tool to characterize active tectonic areas: the Jaut Pass example (Pyrenees, France). Earth and Planetary Science Letters, 196, 69–81.
[5] Bowen HTJM (1979) Environmental Chemistry of the elements, Academic press, London.
[6] Buyong et. al., (2010), Kriging in Mass Appraisal for Rating, e prints UTM.my /5593/.
[7] Burkart W., P.R. Danesi, J.H. Hendry (2005) Properties, use and health effects of DU International Congress Series, 133-136, IAEA_ Dep. of Nuclear Sciences and Applications, P.O. Box 100, Vienna, Austria. [8] Buttafuoco G, Tallarico A, Falcone G (2007) Mapping Soil Gas Radon
[9] Coleman, T., Li, Y., 1996. An interior, trust region approach for nonlinear minimization subject to bounds. SIAM Journal on Optimization 6, 418–445.
[10] Carol A. Gotway , Richard B. Ferguson, Gary W. Hergert, Todd A. Peterson Vol. 60 No. 4, p. 1237-1247, July, 1996 Comparison of Kriging and Inverse-Distance Methods for Mapping Soil Parameters. SSSOAJ. [11] Dilip Varma Manthena, Akhil Kadiyala, and Ashok Kumar, Interpolation of
Radon Concentrations Using GIS-Based Kriging and Cokriging Techniques (DCE) the University of Toledo, Ohio 43606; 23 October 2009, in Wiley Inter Science 10.1002/ep.10407.
[12] Dug Weir, "The facts on depleted Uranium", new internationalist, Nov, 2007. 49 William Van Den Panhuysen. "Belgium Bans Uranium Weapons
and Armor". ISBUW, March 24, 2007.
[13] Dowd, P. A. (1982). Lognormal kriging—the general case. Mathematical Geology, 14, 474–500.
[14] Goovaerts, P. (1997). Geostatistics for natural resources evaluation (483 pp.). Oxford: Oxford University Press.
[15] Lefohn A.S., Knudsen H.P., Logan J.A., Simpson J., Bhumalkar C. (1987), An Evalution of the Kriging method to predict 7-h seasonal mean ozone concentratiobns for estimating crop losses, JAPCA vol.37 No.5:595-602. [16] Eliza nor Mohd Nadun, Ismail Maarof, Rosmadi Ghazali, Abd. Manan
Samad & Ramli Adnan, 2010, Sustainable Groundwater Potential Zone Using Remote Sensing and GIS, (UiTM Malaysia, International Colloquium on Signal Processing & Its Applications (CSPA), 6th, IEEE. [17] Fetter S, von Hippel F. (1999) after the dust settles. Bull at Sci ; 55(6): 42–
6.
[18] Journel, A. G. (1983). Non-parametric estimation of spatial distributions. Mathematical Geology, 15, 445–468.
[19] Journel, A. G. & Huijbregts, C. J. (1978). Mining geostatistics (600 pp.), San Diego, CA: Academic.
[20] Komura, K., Fujita, X, and Furkawa M., (2003). "Isotopic Ratio of DU used in Iraq war". Japan Radiation Research, vol. 46, no. 429, page 193, 2003. [21] Kay, G.W.C, and Laby, T.H. 1995. Tables of Physical and Chemical
Constants and Some Mathematical Functions (16th edition). Teddington: National Physical Laboratory.
[22] King, C. K., King, B. S., Evans, W. C., & Zang, W. (1996). Spatial radon anomalies on active faults in California. Applied Geochemistry, 11, 497– 510.
[23] Koul, S. L. and Chadderton, L. T. (1988). Radiation Effects. 104, 319. [24] Maroju S., (2007) Evaluation of Five GIS Based Interpolation Techniques
for Estimating the Radon Conc. for Unmeasured Zip Codes in the State of Ohio. Thesis masters in civil Eng. Toledo University.
[25] McGrath J, Saha S, Welham J, El Saadi O, MacCauley C, Chant D. A systematic review of the incidence of schizophrenia: the distribution of rates and the influence of sex, urbanicity, migrant status and methodology. BMC Med 2004; 2: 13. DOI: 10.1186/1741-7015-2-13.
[26] Nazaroff, W. W. (1992). Radon transport from soil to air, Reviews of Geophysics, 30, 137–160.
[27] Nazaroff, W. W. & Nero, A. V. (1988). Book, United States, pages 608. Radon and its decay products in indoor air (518 pp.). New York: Wiley. [28] Paustenbach DJ (2000): The practice of exposure assessment: A
state-of-the-art review. J Toxicol Env Health B 3, 179–291.
[29] Raju, P.L.N. (2004) Geoinformatics Division Indian Institute of Remote Sensing, Dehra Dun, Satellite Remote Sensing& GIS Applications in Agricultural Meteorology pp.151-174.
[30] Sander, P., Bergbäck, B. och T. Öberg, (2006) uncertain numbers and uncertainty in the selection of input distributions Consequences for a probabilistic risk assessment of contaminated land. Risk Analysis, 26: sid. 1363-1375.
[31] Shen and Sarris Shanghai, P. R. China 2009 World Congress on Computer Science and Information Engineering.
[32] Sigua GC, Hudnall WH (1991) Gypsum and water management interactions for revegetation and productivity improvement of brackish marsh in Louisiana. Comm Soil Sci Plant Anal 22(15–16): 1721–1739.
[33] Snepvangers, J.J.J.C., Heuvelink, G.BM, Huisman, J.A., 2003. Soil water content interpolation using spatio-temporal kriging with external drift. Geoderma 112, 253–271.
[34] Torgersen, T. & O’Donnell, J. (1991). The degassing flux from the solid earth: Release by fracturing. Geophysical Research Letters, 18, 951–954. [35] Tansi, C., Tallarico, A., Iovine, G., Folino Gallo, M., & Falcone, G. (2005).
Interpretation of radon anomalies in seismotectonic and tectonic-gravitational settings: The south-eastern Crati graben (Northern Calabria, Italy). Tectonophysics, 396, 181–193.
Van Beers, W.C.M. and J.P.C. Kleijnen (2004), Customized sequential designs for random simulation experiments: Kriging meta-modeling and bootstrapping. Available.
[36] Verfaillie E., I. Du Four, M. Van Meirvenne and V. Van Lancker, (2009) Geostatistical modeling of sedimentological parameters using multi-scale terrain variables: application along the Belgian Part of the North Sea. International J. of Geographical Info Science, Vol.23 No. 2, Feb. 135-150. [37] Verdelocco, S., Turkowsky, P., & Walker, D. (2000). The role of geological
factors and climatic variations in location of radon prone areas. Geologia Tecnica Ed Ambientale, 1, 45–52.
[38] Verly, G. (1983). The multi-Gaussian approach and its application to the estimation of local reserves. Mathematical Geology, 15, 259–286. [39] Virk, H. S. (1999). Indoor radon levels near the radioactive sites of
Himachal Pradesh, India. Environment International, 25, 47–51.
[40] Vieira et.al. 1983. Geostatistical theory and application to variability of some agronomical properties. Hilgardia 51:1-75.
[41] USEPA (2001): Risk assessment guidance for Superfund: Volume III – Part A, Process for conducting probabilistic risk assessment. US Environmental Protection Agency, Washington DC, report EPA/540/R-02/002.
[42] Utset A. et.al. (2000) Comparison of soil maps Kriging & a combined method for spatially predicting bulk density & field capacity of ferralsols in Havana. Geoderma 96, 199-213.
[43] Winkler, R., Ruckerbauer, F., & Bunzl, K. (2001). Radon concentration in soil gas: A comparison of the variability resulting from different methods, spatial heterogeneity and seasonal fluctuations. The Science of the Total Environment, 272, 273–282.
[44] Webster, R., Oliver, M.A., 2001. Geostatistics for Environmental Scientists. Wiley, Chichester.
[45] Webster, R. and T. M. Burgess, Journal of Soil Science, Volume 31, Issue 3, pages 505–524,Sep. 1980. Optimal interpolation and isarithmic mapping of soil properties III changing drift and universal kriging.
[46] William, Dai “Hazards of Uranium Weapons in the Proposed War on Iraq” full report. The Eoslife resources center. Oct, 2002.
[47] Zeng Huai-en, Huang Sheng-xiang. Research on spatial date interpolation based on Kriging interpolation [J]. Engineering of surveying and mapping, 2007.16(5):5-8.
[48] Zhu, H. C., Charlet, J. M., & Tondeur, F. (1998). Geological controls to the indoor radon distribution in southern Belgium. The Science of the Total Environment, 220, 195–214.
AUTHORS
First Author – Ahmad Shukri Yahya, School of Civil Engineering, Universiti Sains Malaysia (USM), Engineering Campus, Nibong Tebal 14300, Penang, Malaysia
Second Author – Fauziah Ahmad, School of Civil Engineering, Universiti Sains Malaysia (USM), Engineering Campus, Nibong Tebal 14300, Penang, Malaysia
Third Author – Mohammed Khudheir, School of Civil Engineering, Universiti Sains Malaysia (USM), Engineering Campus, Nibong Tebal 14300, Penang, Malaysia