APRIL - MAY, 2017, VOL. 4/21 www.srjis.com Page 5094 EVALUATION OF A YOUTH PROGRAM BY TEACHERS AND PARENTS
Mrs. Archana Vadeyar1 & Smita Phatak2, Ph. D.
1
Research Scholar, Tilak Maharashtra Vidyapeeth
2
Associate Professor, Tilak College of Education
The activities, that are planned for today’ s youth, need to be more experiential involving joyful interaction.As per review, youth want to spend their out-of-school time in activities, that engage their hearts, minds and bodies and to contribute to the work of the larger society and they also want to have fun.The purpose of this study is, to explore the concept of an experiential program of community interaction for youth and to evaluate it based on feedback from teachers, authorities and parents. A self-prepared and validated questionnaire was administered to a Purposive sample of 14 teachers, 5 authorities and 10 parents.Question-wise analysis was done and it was found that the program was valuable to the Institution. According to teachers, authorities and parents, the program was beneficial to youth and children as it gave joyful experiences and helped to inculcate values and sow seeds of responsibility in youth.
Keywords: Evaluation, Youth, Parents, Teachers, Experiential program.
1.1 INTRODUCTION
Through the years of teaching service, the researcher, has made certain observations about
our Junior College youth. They are fortunate enough, to enjoy many luxuries of life, for e.g.
wearing branded clothes, footwear, owning latest mobiles, tabs, laptops, bikes, etc. Yet, they
feel neglected, bored and disinterested (Lindner and Johns, 2002; as in Moksnes, Lohre,
Espnes, 2013)[8] in the daily activities. Lack of value-based and action-based experiences in
their educational schedule. The activities,that are planned for youth, need to be more
experiential involving joyfulinteraction. So, the researcher sensed a need to develop an
experiential program for the urban youth,and evaluate the program through feedbacks from
teachers, authorities and parents.
1.2 BACKGROUND OF STUDY
1.2.1 Education
The purpose of education is to ensure that all students gain access to knowledge, skills and
information that will prepare them to contribute to society(NVPIE, Nevada Partnership for
Inclusive education). [19]
Scholarly Research Journal's is licensed Based on a work at www.srjis.com
APRIL - MAY, 2017, VOL. 4/21 www.srjis.com Page 5095 1.2.2 Adolescents
Adolescence is an important developmental phase characterized by significant changes in
virtually every aspect of an individual’s life, calling for new psychological
adaptations.(Holmebeck & Greenley, 2002; as in Moksnes et al, 2013) [8]
1.2.3 Experiential education
Experiential learning is a process when a personally responsible participant cognitively,
affectively and behaviourally processes knowledge, skills, and/or attitudes in a learning
situation characterized by a high level of active involvement. (Hoover & Whitehead, 1975; as
in Caulfield and Woods, 2013)[1]Experiential learning is an ideal approach to achieving the
tenets of empowering education because the results of direct experience are often concrete,
easily identifiable and applicable.(Perrin, 2014)[11]
1.2.4 Community interaction
Service learning is an educational methodology with explicit academic learning objectives,
community work and deliberate reflection. (Benneworth and Charles, 2013; as
inNuangchalerm, 2014)[10]
1.3 RATIONALE OF STUDY
Experiential learning is an ideal approach to achieving the tenets of empowering education
because the results of direct experience are often concrete, easily identifiable and applicable.
Service entails mutuality and openness, student learning is enhanced through a careful
attempt of processing experiences, learning through service is something that student
constructs for themselves, with the guidance of peers and college staff and not merely
provided by administrators.(Perrin, 2014)[11]
Youth do want to spend their out-of-school time in activities that engage their hearts,
minds and bodies and they want to contribute to the work of the larger society and they also
want to have fun (Quinn, 1999 as in Morrissey, Werner-Wilson, 2005). [9]By fostering an
atmosphere that embraces our youth and provides them with opportunities to grow and to
demonstrate caring abilities, we can foster positive youth development. (Larson, 2000; as in
Morrissey, Werner-Wilson, 2005)[9]
Today’s education system at 10+2 stage seems to be too academic, exam oriented, far
more pressurizing and lacks all round developing curriculum. Together in Std. XIth and Std.
XIIth students are available for very less time for development. Within this period there is a
burden of completing loads of syllabus Board exam formalities and many exams to be
conducted. Precisely it indicates that the development programs and activities supposed to
APRIL - MAY, 2017, VOL. 4/21 www.srjis.com Page 5096
scope for some crucial activities needed for the student’s growth further demotivates the
teachers to plan for the same.So, the researcher felt a dire need to introduce anexperiential
program that involvedinteraction ofthe youthwith children in community as a part of
curricular activity.
1.4 OBJECTIVES
1) To develop an experientialyouth program of community interaction at +2 level.
2) To implement the developed experiential youth program of community interaction at +2
level.
3) To evaluate the experiential youth program of community interactionbased on feedback
from teachers and parents.
1.5 OPERATIONAL DEFINITIONS
1) Evaluation: It means to assess the successful implementation of the entire program from
design, orientation, planning to conduction of visits and reflective feedback.
2) Youth: For this Research, youth are students studying in Std. XI whose age group lies
between 15-16 years.
3) Experiential Program: It inlcudes orientation of youth, sensitization, mentoring,
planning and discussion of activities to be conducted for children and actual visit to
schools for children, who are challenged by demographic, physical or socio-economic
reasons. Youth get an opportunity to interact with the children and conduct educational
cum recreational activities for them.
4) Teachers: Teachers include, the mentors for the groups of youth students who have
participated in the experiential program and the heads and authorities of the Institution.
5) Parents: Includes the one of the parents or guardians of youth who have participated in
the experiential program.
1.6 REVIEW OF LITERATURE
Experiential education is that which surprisesstudents by exposure to situations and
information, that conflicts with their assumptions of the world thus, challenging them to
explore further(Eyler, 2002; as in Caulfield and Woods, 2013)[1]. Adolescence is an important
developmental phase characterized by significant changes in virtually every aspect of an
individual’s life, calling for new psychological adaptations. (Holmebeck & Greenley, 2002;
as in Moksnes et al, 2013)[8]
New perspective of Research is study of adolescence by directing increased attention
to the importance of building on adolescent strengths and abilities to promote positive
APRIL - MAY, 2017, VOL. 4/21 www.srjis.com Page 5097
concludes that when teachers use strategies to reduce stress and build a positive emotional
environment, students gain emotional resilience and learn more efficiently. In fact, the role of
adolescents in widest context such as community is a great importance and the most desired
social outcome of development (Ford et al., 1989)[20]. Adolescents in most Eastern countries
take entrance exams for both high school and college, which pressurizes the students.
(Chaudhary & Sharma, 2012)[16]
Future research could explore, how experiential learning may help students accept
responsibility, promote community involvement and develop community collaborations that
will aid students learning experiences.(Caulfield and Woods, 2013)[1]
1.7 RESEARCH METHODOLOGY
1.7.1 Research design
Being a qualitative type of data where researcher needed to explore the concept of developing
and implementing an experiential youth program, a Grounded Theory design was most
suitable. To evaluate the developed experiential youth program of community interaction at
+2 levela feedback using Questionnaire was most suitable method. It is supported by photos.
1.7.2 Procedure
After the pilot study, program was modified to overcome the previous challenges, after
feedback from students and teachers. Each class was divided into groups of 20-25 students
and one mentor teacher was allotted per group. Under guidance of mentor, students had to
plan and conduct few educational, informative, cultural and recreational activities for the
school children. Each group was allotted one school for visit, e.g. school for challenged,
underprivileged school, rural school in and around Pune.
Youth (between 16-17 years) were encouraged to plan interactive activities for school
children (6-12 yrs.) applying their own imagination and creativity. Planning ofactivities for
2-3 hours, per monthly visit had to be done.They formed teams of 2-4 students within the
group. The teams were told to prepare a plan of activities based on themes like-GK, language,
math, science, EE, fun games, quiz, puzzles, sports, art and craft, stories, song and dance,
poems, etc. A team of 2-4 students had to conduct activities for 10-15 children from given
class. Students were supposed to bring material needed for those many children to carry out
the activities. For e.g. sheets of book, pencils, drawing sheets, craft papers, etc.
Schedule for the visit was fixed, confirmed and conveyed to mentors and students, as
per the school/organization approval. The students visited the respective schools along with
their mentors and conducted activities as per given time schedule. Those days were
APRIL - MAY, 2017, VOL. 4/21 www.srjis.com Page 5098
their fond memories and as an evidence for conduction of EE project. After completion of the
entire program, questionnaires were administered to few teachers, authorities and parents.
1.7.3 Assumptions
All the selected students will be undergoing the interactive program.The students will be
taking part in the programme for a definite time. Some students may remain absent during the
program. Few students may be unable to complete the program.
1.7.4 Population
The population is teachers of Std. XI English medium students of any stream from co-ed
Junior Colleges affiliated to H.S.C Board Pune city of Maharashtra State.
1.7.5 Sample
Purposive sampling was used for this research study as its purpose was to explore a concept
of experiential youth program of community interaction for youth at +2 level. The program
was conducted after receiving permission from Dr. Kalmadi Shamarao Junior College, Pune.
Also, the authorities had funded the program partly. The sample size was14 teachers, 5 heads
and authorities and 10 parents of randomly selected students of Std. XI together from
Commerce and Science stream.
1.7.6 Data Collection Tool
For the present research study data was collected using self-prepared Questionnaire from few parents, teachers and school authorities.Questionnaire was prepared by the researcher under the guidance of educationists, experts from the field and colleagues. It was predominantly, a semi-structured questionnairecontaining few open and closed ended questions that were opinion based.Photographic evidences were recorded and collected to confirm the findings from both types of data.
A) Questionnaire Questionnaires were prepared for Parents, Teachers and Authorities by
[image:5.595.92.499.579.767.2]the researcher for the present study.
Table 1:Types of Questionnaire and details of questions
Type of Audience
Types of questions Questions
For Parents Questions referring to your ward (Q. 1-5) Questions based on Program (Q.6-8) Personal Questions (Q.9-10)
10
For teachers Questions based on activity (Q. 1-6) Questions based on Planning (Q.7-10)
Questions based on overall program (Q.11-15) Personal Questions (Q. 16-19)
19
For authorities Questions based on Institution level (Q. 1-3) Questions based on program (Q. 4-6)
Questions based on responses of students/teachers (Q. 7-9)
Personal Suggestions (Q. 10)
APRIL - MAY, 2017, VOL. 4/21 www.srjis.com Page 5099 80%
20%
Overall teachers response
a b
1.8 ANALYSIS OF DATA
The questionnaires that were filled by teachers, authorities and parents were studied,
responses were tabulated and analysed to evaluate the program for its value and benefit to
youth.
1.8.1 TEACHER’S RESPONSE
A) Responses to rating type questions
Table 2: Overall Teachers Pie diagram 1: Overall Teachers response
response to rating questions rating type of questions
Table 3:denoting enjoyment by children as reported by teachers
Table 4: denoting response of children to activities by youth
Options No %
a 112 80
b 28 20
Q.1 Enjoyment by
children No %
To great extent 12 86
To some extent 2 14
Q.2 Response of children No %
Good 13 93
Satisfactory 1 07
[image:6.595.78.504.203.528.2]Table 4 and Pie diagram 3 shows that 93% of teachers reported the response of children to activities as good and 7% as satisfactory. Table 2 and Pie diagram 1 denotes 80% of teachers selected ‘a’ option and 20% selected ‘b’ option. ‘a’ stands for great extent, good or agree while b stands for some extent, satisfactory or slightly agree.
APRIL - MAY, 2017, VOL. 4/21 www.srjis.com Page 5100 Table 5: denoting enjoyment by youthto interactionprogram
Table 6: denoting clarity of program details to teachers
Table 7: denoting timely distribution ofmaterial to teachers
Table 8: denoting enough time to planactivities
Table 9: denoting Proper scheduling ofprogram
Q.3 Enjoyment by
students No %
To great extent 9 64
To some extent 5 36
Q.7 Clarity of program
details No %
Agree 13 93
Slightly agree 1 07
Q.8 Timely distribution of
material No %
Agree 13 93
Slightly agree 1 07
Q.9 Enough time to plan
activities No %
Agree 10 71
Slightly agree 4 29
Q.11 Proper scheduling of
program No %
Agree 12 86
Slightly agree 2 14
Table 6 and Pie diagram 5 shows that 93% of teachers reported that they had clarity of program details and 7% slightly agreed.
Table 9 and Pie diagram 8shows that 86% of teachers agreed that program was properly scheduled and 14% slightly agreed.
Table 5 and Pie diagram 4 shows that 64% of teachers felt youth enjoyed interaction program to great extent and 36% enjoyed to some extent.
Table 7 and Pie diagram 6 shows that 93% of teachers agreed that they received the material for program well on time and 7% slightly agree. No other options were chosen.
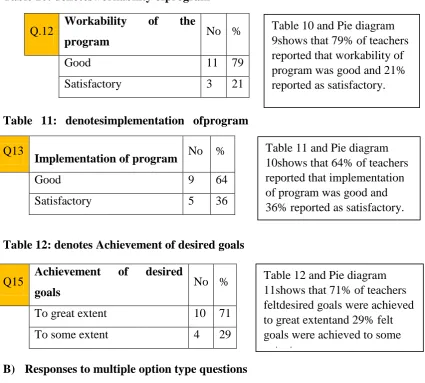
APRIL - MAY, 2017, VOL. 4/21 www.srjis.com Page 5101 Table 10: denotesworkability ofprogram
Table 11: denotesimplementation ofprogram
Table 12: denotes Achievement of desired goals
B) Responses to multiple option type questions
Table 13: denotes teachers’ response to feeling during student-childinteraction
Q.12 Workability of the
program No %
Good 11 79
Satisfactory 3 21
Q13
Implementation of program No %
Good 9 64
Satisfactory 5 36
Q15 Achievement of desired
goals No %
To great extent 10 71
To some extent 4 29
Q.4 Feeling during student-child interaction No
Satisfaction 10
Responsible 11
Apprehensive 3
Pleasant Surprise 5
Any other 5
Table 10 and Pie diagram 9shows that 79% of teachers reported that workability of program was good and 21% reported as satisfactory.
Table 11 and Pie diagram 10shows that 64% of teachers reported that implementation of program was good and 36% reported as satisfactory.
Table 12 and Pie diagram 11shows that 71% of teachers feltdesired goals were achieved to great extentand 29% felt goals were achieved to some extent.
Table 13 shows that 71% teachers felt satisfied during student-child
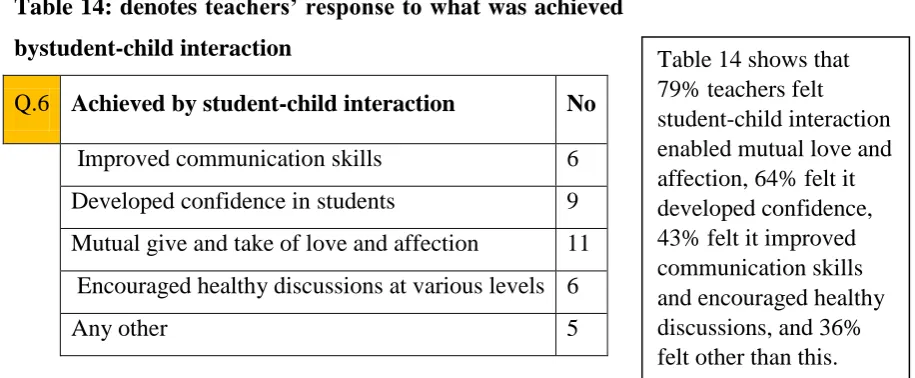
APRIL - MAY, 2017, VOL. 4/21 www.srjis.com Page 5102 Table 14: denotes teachers’ response to what was achieved
bystudent-child interaction
Q.6 Achieved by student-child interaction No
Improved communication skills 6
Developed confidence in students 9
Mutual give and take of love and affection 11
Encouraged healthy discussions at various levels 6
Any other 5
Table 15: denotes teachers’ response to challenging issues if any at planning stage
Q.10 Challenging Issues at planning
stage No
Attendance 6
Communication 4
Concentration 6
Cooperation 2
Any other 2
Table 16: denotes teachers’ response to what they think
was/were goal/s of program
Q.14 Goal/goals of this program No
Habituate students to contribute to society 13
Develop certain life-skills in students 5
Expose the students to harsh realities of life 9
Channelize student’s energy to fruitful
work 7
Any other 1
Table 14 shows that 79% teachers felt
student-child interaction enabled mutual love and affection, 64% felt it developed confidence, 43% felt it improved communication skills and encouraged healthy discussions, and 36% felt other than this.
Table 15 shows that 43% teachers reported challenging issues as attendance and concentration, 29% reported as
communication, and 14% reported as
cooperation and others.
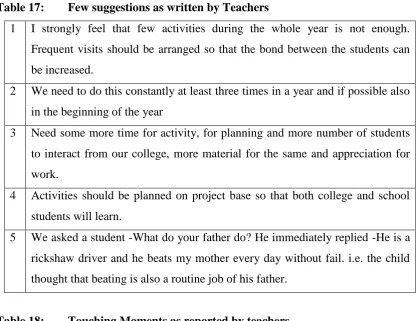
APRIL - MAY, 2017, VOL. 4/21 www.srjis.com Page 5103 Table 17: Few suggestions as written by Teachers
1 I strongly feel that few activities during the whole year is not enough.
Frequent visits should be arranged so that the bond between the students can
be increased.
2 We need to do this constantly at least three times in a year and if possible also
in the beginning of the year
3 Need some more time for activity, for planning and more number of students
to interact from our college, more material for the same and appreciation for
work.
4 Activities should be planned on project base so that both college and school
students will learn.
5 We asked a student -What do your father do? He immediately replied -He is a
rickshaw driver and he beats my mother every day without fail. i.e. the child
[image:10.595.74.497.378.769.2]thought that beating is also a routine job of his father.
Table 18: Touching Moments as reported by teachers
1 At school, a few of them asked questions to the head about the difficulties
faced by the children who were mentally challenged. They were pleased to
see a few grown-ups leading a good life with help and support of the school
by keeping them engaged.
2 A naughty student unexpectedly took up the task of asking students to paint or
colour. He was so good with them, that he was followed by them. All students
were prepared very well and took a lot of activities with the children. It was
very heart-warming to see mischievous students behave so very responsibly.
3 It was a life changing experience for students, touching moment for student
for they realized one phase of real life, good feeling while interacting with
students.
4 Children were very sharp and with high intellectual capacity. Inspite of
studying in schools with limited facilities, students were well versed with
different activities.
5 The overall visit was heart touching. The conditions of the school which is
very near Pune itself was bad. Yet, the love and affection we got from the
APRIL - MAY, 2017, VOL. 4/21 www.srjis.com Page 5104 1.8.2 Evaluation by Heads/Authorities
[image:11.595.71.480.344.501.2]A) Overall Response to Rating type of questions
Table 19: denotesOverallresponse of heads to rating questions
Pie diagram 2: Value to Institution Pie diagram 3: Expectations met by program
Pie diagram 2 shows that 60% heads felt that the program was of value to Institution to great
extent, 20% felt to some extent while 20% were undecided.
Pie diagram 3 shows that 80% heads felt that the program expectations were met to some
extent and 20% to small extent
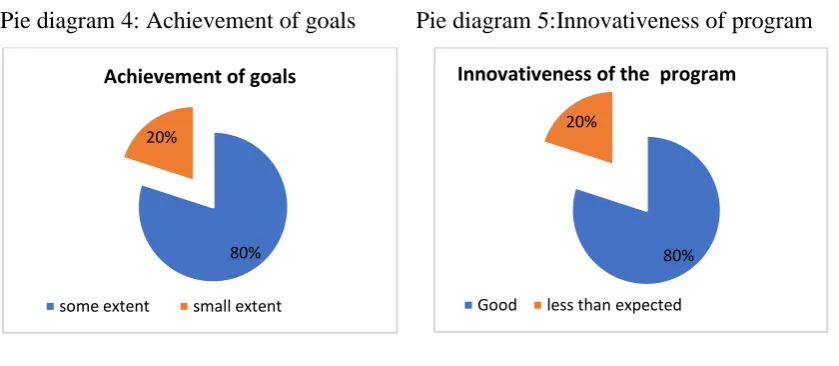
Pie diagram 4: Achievement of goals Pie diagram 5:Innovativeness of program 60%
20% 20%
Value of program to Institution
great extent some extent undecided
80% 20%
Expectations met by program
some extent small extent
80% 20%
Achievement of goals
some extent small extent
80% 20%
Innovativeness of the program
Good less than expected
Q1 Q3 Q5 Q6 Q7 Q8
a 3 - - 4 1 -
b 1 4 4 - 3 3
c 1 1 - - 1
d 1 - - 1 1 1
e - - - -
Table 19
[image:11.595.72.492.588.771.2]APRIL - MAY, 2017, VOL. 4/21 www.srjis.com Page 5105
Pie diagram 4 shows that 80% heads felt that goals were achieved to some extent and 20% to
small extent.Pie diagram 5 denotes 80% heads reported innovativeness of program as good
and 20% less than expected.
Pie diagram 6:Overall response of staffPie diagram 7:Program liked by students
Pie diagram 6 shows that 60% heads reported overall response of staff was satisfactory, 20 %
felt as good and less than expected. Pie diagram 7 shows that 60% heads felt that program
was liked by most students and 20% felt it was liked by many and few respectively
B) Response to Multiple option questions
Overall response
Graph 1:Overall response to multiple option questions
Graph 1 shows overall response of heads to multiple option questions, Q. 2, Q. 4 and Q. 9.
Individual question-wise analysis is given below.
Graph 2:Expectations from the innovative program
20%
60% 20%
Overall response of staff
Good satisfactory less than expected
60% 20%
20%
Liked by your students
Liked by most Liked by many
Liked by few
3 3
2
4
1 2 1
4
4 4
1
1 2 1
Q2 Q4 Q9
Response to multiple option questions
a b c d e
0 1 2 3 4 5
Develop life skills in your students.
Selfless contribution to the
society.
Instil values in students.
Any other Expectations from the innovative
program
Graph 2 reveals that expectations from program by 80% heads were Selfless
APRIL - MAY, 2017, VOL. 4/21 www.srjis.com Page 5106
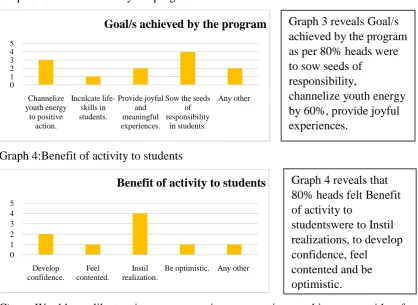
Graph 3:Goal/s achieved by the program
Graph 4:Benefit of activity to students
C) Would you like to give any suggestions or mention anything more with reference to
any of the above areas?
1) As the number of students was more, it is difficult to coordinate at times and so we
are unable to get maximum responses.
2) It would be an activity if included in curriculum for everyone. Then the benefits will
be manifold and deep-rooted instilling of value system.
3) This activity could be continued by having students reflect on their experiences. They
could start circle time, as reflective spaces could trigger spiritual development of the
students.
4) Very few groups were sensitized properly. Unless the need for these activities is felt by all of us it can’t be transformed to the students.
1.8.3 Evaluation by Parents
[image:13.595.73.492.83.388.2]A) Response to Rating type of questions
Table 20: Overall response Graph 5:Benefit
of activity to students
0 1 2 3 4 5 Channelize youth energy to positive action. Inculcate life-skills in students. Provide joyful and meaningful experiences.
Sow the seeds of responsibility
in students.
Any other Goal/s achieved by the program
0 1 2 3 4 5 Develop confidence. Feel contented. Instil realization.
Be optimistic. Any other Benefit of activity to students
Q1 Q3 Q4 Q5 Q6
a 9 6 6 7 6
b 2 5 5 4 5
Graph 3 reveals Goal/s achieved by the program as per 80% heads were to sow seeds of
responsibility,
channelize youth energy by 60%, provide joyful experiences.
Graph 4 reveals that 80% heads felt Benefit of activity to
studentswere to Instil realizations, to develop confidence, feel
APRIL - MAY, 2017, VOL. 4/21 www.srjis.com Page 5107 Table 21:Parents awareness about program
Q.1 Awareness about
program No %
Yes 9 81
No 2 19
Table 22:Extent to which Program was liked
by ward
Q.3 Extent of being liked by ward No %
To a great extent 6 55
To some extent 5 45
Table 23: denotes wards feedback about program
Q.4 Ward’s feedback about program No %
Good 6 55
Satisfactory 5 45
Table 24: denotes permission in future for such
program
Q.5 Permission in future No %
Yes surely 7 64
I may 4 36
Table 25: denotes programbeneficial for
ward
Q.6 Beneficial for ward No %
To a great extent 6 55
To some extent 5 45
0 2 4 6 8 10
Q1 Q3 Q4 Q5 Q6
Response to rating type questions
b a
Table 20 and graph 5 shows overall responses of parents. 62% of options chosen by parents was option ‘a’ and rest 38% was option ‘b’.
Table 21 shows that 81% of parents were aware about the program from their wards and 19% weren’t aware.
Table 22 shows that 55% parents reported that program was liked by wards to great extent and to some extent by 45% parents.
Table 23 shows that 55% parents reported that program was rated as good by wards and 45% as satisfactory.
Table 24 shows that 64% parents would surely give permission to ward to take part in program in future and 36% may give.
APRIL - MAY, 2017, VOL. 4/21 www.srjis.com Page 5108 B) Response to Multiple option questions
Graph 6: wards reaction about visit Graph 7:Benefits of program
Graph 6 shows that 91% parents think ward were eager to share experience about visit,
37%expressed that ward felt excited and looked satisfied and 9% think they were
exhausted.Graph 7 shows that 91% parents think program did benefit ward making him/her
more responsible, 64% felt it did instil realization, 46% expressed that ward developed
confidence and 27% felt wards looked contented.
Graph 8:Aim/aims of program
C) Would you like to share any of your ward’s experience or give any suggestions?
1) To share views and knowledge with school children is a very good experience.
2) Such programs should be organised more often. I suggest having connection with
same school throughout for 2 years of Jr. College.
3) My daughter was very excited to tell me about their experience. She felt very happy
that she got to spend quality time with those children and that she could help them in
activities.
4) The experience was different from their daily life.It left a deep impact on my ward as
she saw a childhood different from her own.
0 5 10 15
Felt excited Looked satisfied Eager to share experience Exhausted Any other
Ward’s reaction about the visit
0 2 4 6 8 10 12 To develop confidence.
To feel contented To instil realization To be responsible Any other
Benefits of program
0 2 4 6 8 10 12
Channelize youth energy to positive action. Inculcate certain life-skills in
students. Provide joyful and meaningful experiences.
Sow the seeds of responsibility in students.
Any other
Aim/aims of program Graph 8 shows that 91% parents think aim of program was to sow seeds of
APRIL - MAY, 2017, VOL. 4/21 www.srjis.com Page 5109
1.9 FINDINGS AND DISCUSSION
1.9.1 Evaluation of program by teachers
1) From Evaluation of program by teachers it was found that Children from schools
enjoyed the interactive activities to great extent (86%), there was a good response
from most of children (93%), youth too enjoyed the program to great extent (64%),
there was clarity about program details (93%), timely distribution of material for
activities(93%), there was enough time to plan activities (71%), program was properly
scheduled (86%), workability of program was good (79%), implementation of
program was good (64%) and desired goals were achieved (71%).
2) Teachers felt satisfied (71%) and responsible (79%) during student-child interaction,
what was achieved by this interaction was mutual love and affection (79%) and
develop confidence in youth (64%), challenging issues during program were
attendance (43%) and concentration (43%) goals of program as per teachers were,
habituate to contribute to society (93%), exposure to harsh realities (64%) and
channelize youth energy (50%).
3) Teachers expressed that they were pleased to see a few grown-ups leading a good life
with help and support of the school by keeping them engaged and was a life changing
experience for students, touching moment for students and recommended that such
activities and visits need to be planned more frequently for youth.
1.9.2 Evaluation of program by heads and authorities
1) From Evaluation of program by heads and authoritiesit was found that the program
was valuable for Institution (60%), expectations were met (80%), goals were achieved
(80%). Innovativeness of program was good (80%), overall response of staff was
satisfactory (60%) and program was liked by most of students (60%).
2) Expectations from program by heads and authorities were selfless contribution to
society (80%) and instil values in youth (80%), goals achieved by program were
sowing seeds of responsibility (80%) and provide joyful experiences to youth (60%),
and benefit of activity was to instil realizations in youth (80%).
3) Authorities suggested that activity can be included in curriculum for everyone,for
greater benefits and deep-rooted impact, and to involve more reflection on
APRIL - MAY, 2017, VOL. 4/21 www.srjis.com Page 5110 1.9.3 Evaluation of program by parents
1) From Evaluation of program by parentsit was found that they were aware of program
(81%), it was liked by their wards to great extent (55%), program was rated by wards
as good(55%), would give like wards to involve in such programs in future (64%), felt
it was beneficial to their wards (55%).
2) The parents felt that their wards were eager to share experiences of program (91%), it
benefitted their wards by making them more responsible (91%) and instilling
realizations in them (64%), aim of program was to sow seeding of responsibility in
youth (91%), channelize youth energy (72%) and inculcate certain life-skills in the
(64%).
3) Parents expresses that it was a different experience for their child, who was excited
and had a great impact on their minds. So, such experiences should be given more
often to them.
1.10 CONCLUSION
From the findings, it can be concluded that the program was liked by most of children,
students, teachers, authorities and parents. The programwas beneficial to youth and children
as it gave joyful experiences and helped to inculcate values and sow seeds of responsibility in
youth. More research is needed in adolescent educationto actively engage youth and habituate
them to contribute for betterment of society. Experiential learning can help students develop
positive attitudes towards life, encourage acceptance of responsibility, promote community
involvement, develop power of thought and help them understand their strengths and
weaknesses in a real-world context, thereby inspiring personal growth through the
development of global competencies(Eyler and Giles, 1999; as in Caulfield and Woods,
2013).[1]Such experiential programs followed by reflective exercises can instil realizations in
youth and help to fulfil dream of a peaceful and caring world.
1.11 ACKNOWLEDGEMENT
We express our gratitude towards IFUWA, who supported this study partly, through Dr.
Meena Muthiah Scholarship.Our sincere and deep-felt gratitude to the management, Principal
and staff of the Kalmadi Junior College, tothe primary schools for their co-operation and to
APRIL - MAY, 2017, VOL. 4/21 www.srjis.com Page 5111
1.12 REFERENCES
Caulfield. J. and Woods. T. (2013). Experiential learning: Exploring its long-term impact on socially responsible behaviour. Journal of Scholarship of teaching and learning, 13, 2, 31-48.
Durlak. J. A, Weissberg. R. P. and Pachan. M. (2010). A meta-analysis of after school programs that seek to promote personal and social skills in children and adolescents. Am. Journal of Community Psychology,45, 294-309.
Erozkan. A. (2013). The effect of communication skills and interpersonal problem-solving skills on social self-efficacy. Educational sciences, theory and practice, 13, 2, 739-745.
Fawcett.L. M., Garton.A. and Dandy.J. (2009). Role of motivation, self-efficacy and parent support in adolescent structured leisure activity participation, Australian Journal of Psychology, 61, 3, 175-182.
HamiltonS. and Fenzel.M. L. (1988). The Impact of Volunteer experience on Adolescent Social Development: Evidence of Program effects. Journal of Adolescent Research, 3, 65-80.
Harter.S., Waters.P. and Whitesell.N. R. (1998). Relational self-worth: Differences in perceive worth as a person across Interpersonal contexts among adolescents. Child development, Vol 69, No.3, 756-766.
Landrieu.M. and Demerath. P. (2014). Community based youth programs utilizing a culturally relevant framework to implement impactful learning opportunities for immigrant Latino Youth. PhD Dissertation.
Moksnes.U. K, Lohre.A. and Espnes. G. A (2013). The association between sense of coherence and life satisfaction in adolescents. Qualitative life Research, Vol 22, p 1331-1338.
MorrisseyK. and Werner-Wilson. R. J. (2005). The relationship between out of school activities & positive youth development: An investigation of the influences of communities and family. Adolescence, 40, No 157.
Nuangchelerm. P. (2014). Self-efficacy and Civic engagement in undergraduate students:Empirical result of a service learning program in Thailand. International journal for service learning in engineering, Vol 9, 2, 150-156.
Perrin. J. (2014). Features of Engaging and empowering experiential learning programs for college students. Journal of University Teaching & Learning practice, Vol 11, No 2, Article 2.
Sharma.S.(2003). Measuring life skills of adolescents in a secondary school of Kathmandu: an experience. Kathmandu University Medical journal, Vol 1, 3, 3, 170-176.
Shein. K,and Cheng.M. (2007). An empirical study of experiential value & lifestyles and their effects on satisfaction in Adolescents: an example of online gaming. Adolescence, 42, 165.
Singh. S. (2014). Creating Joyful Learning environment at Primary level. Shaikshik Parisamvad, 4, 1, p 10-14.
Singh. B. and Udainiya. R. (2009) Self-Efficacy and well-being of Adolescents Journal of the Indian Academy ofApplied Psychology. 35, 2, 227-232.
Book Chapter: Adolescence. Chapter 8, Section1-3, p 338-397. www.edam.com.tr/estp
http://ro.uow.edu.au/jutlp/vol11/tss2/2 https://www.leg.state.nv.us