An Overview of Methods of Reliability and Availability
Analysis based on Software Architecture
Neeraj Kumar Sharma ArunPrakashAgrawal
Amity University, Noida Amity University, Noida
ABSTRACT
When we talk about the User acceptance testing of the software then two quality matrices come into our mind. They are Reliability & Availability. These two parameters are the most important measures for evaluating the quality of the software system and represents user-oriented view of software quality. Reliability and availability must be engineered into software from the onset of its development, andpotential problems must be detected in the early stages,when it is easier and less expensive to implement modifications. For this reason, a method is needed for analyzing software architecture with respect to reliability and availability. In this paper, we survey and examine different methods of reliability & availability analysis based on software architecture.
Keywords:
Reliability and availability analysis, Software architecture,Software components
1. INTRODUCTION
Software systems are increasingly entering consumers’ everyday life. These systems are often highly complicated and distributed to different platforms over wired or wireless networks. A small error in the software sub system can cause a failure in the complete system that leads to disastrous failures which differ in their impact depending on the operations of an organization. Hence these systems must demonstrate high reliability and availability.
Reliability is defined here as the probability of the failure-free operation of a software system for a specified period of time in a specified environment [1]. Availability is used to indicate the probability of a system or equipment being in operating condition at any time t, given that it was in operating condition at t = 0. Reliability and availability are often defined as attributes of dependability, which is the ability to deliver service that can justifiably be trusted [2]. From an architecture point of view, reliability and availabilityare execution qualities of a software system. Several measures are traditionally used for reliability and availability, such as mean time to failure (MTTF), mean time to repair (MTTR) and failure rate. The traditional views and measures, however, might not scale up to the needs placed on today’s complex systems by their multiple stakeholders. Different stakeholders, such as end user maintainers, and developers might have different requirements for the value of reliability and availability indicators. Therefore, reliability and availability must be approached from a more global perspective.
Reliability and availability predictions are the challenging tasks due following reasons.
It is difficult to analyze software reliability and availability due to uncertain parameters like failure rates & repair rates.
The models generally assume that once a fault is discovered it is removed immediately i.e. software’s have instantaneous repair time. The reality is that applications executing in the field can take significant amount of time may be days or weeks to get a fault removed.
The problem, which is generally faced, is the quality of the failure data. For example repeat failures generally occur due to the fact that faults are not removed instantaneously.
Another problem is that operational profile testing is generally ignored i.e. it is assumed that the software is going to be tested in the same manner that it is used in the field, which is not true in practice.
Several analysis or prediction methods have been developed during recent decades for different types of purposes and by different communities. Consequently, they have different definitions and measures for reliability, architecture, inputs, outputs, notations, assumptions, users, etc. Here,the paper is comparing the architecture-based reliability and availability analysis methods and techniques. The purpose is to find a method or a set of methods that can be applied to today’s complex software systems, at the architecture level, as well as to discover the shortcomings of methods. Section
2describes the comparison framework for analysis methods. This framework is used to compare the selected characteristics of the reliability and availability analysis methods collected from the literature. Section 3gives a brief overview of reliability and availability prediction approaches. Section 4represents the comparison of methods and techniques for reliability & availability prediction and Section 5presents the results of comparison. Finally,in section 6, the conclusions are summarized.
2. A COMPARATIVE FRAMEWORK
FOR RELIABILITY AND
AVAILABILITY ANALYSIS METHODS
of the method itself. The last category, which is validation, focus on the evaluation of the method context, user, and
content. It validates the maturity of the method and the results of the method.
Table 1.A Comparative Framework for Reliability and Availability Analysis Method [4]
Category Elements Questions
Context
Goal What is the goal of the analysis method? Scope of applicability Is the method/technique applicable to the
different layers of software:Application, middleware, and infrastructure?
Application domain independency Is the method limited to any application domain?
Component-specificity Can the method be used to predict the reliability and availability of theindividual components? How does the method/technique treat black box components?
Architecture-specificity Can the method/technique be applied to software systems that are distributed to several (hardware) platforms? Are the different interactions between components considered? Platform/implementation technology
independency
Can the method/technique be used before making any implementation-related decisions? Is the method dependent on a certain platform or implementation technology?
User
Target group Who is the intended user of the method? Needed skills What skills are required for using the method? Expected benefits What are the benefits of using the method? Required resources How much extra work does the method require?
How much time doesthe use of the method require?
Contents
Language What notation is used in architecture descriptions?
Architectural viewpoints What views does the method use for predicting reliability and availability?How is the behavior modeled?
Analysis model Does the method provide a special model with which the analysis isperformed?
System usage Have the different ways and frequencies that were used for executingtasks been taken into account?
Variability Is the variation of architecture considered in the analysis? Can theanalysis be performed for different product variants by reusing existing knowledge?
Tool support Are there any tools that support the method? Analysis process How the analysis is performed (the inputs,
outputs and techniques)?
Limitations What are the assumptions and limitations of the method?
Validation Maturity of the method
Table1. Continued
Traceability of R&A(Reliability & Availability) requirements
When was the material of the method first published? Has the method been applied in the lab only or also in the development of large-scale products? How many times and to what size of applications has the method been applied? Is there evidence for the method’s benefits and costs?
Precision of prediction How close are the predicted values to the actual values when the method has been used?
3. OVERVIEW OF RELIABILITY AND
AVAILABILITY PREDICTION
APPROACHES
At a high level of abstraction, the reliability and availability analysis methods can be classified into quantitative and qualitative methods. Methods employing quantitative techniques have been used since the 1970s [5]. There is a lot of variation in the quantitative methods; some of the methods are applicable before, and some after, system implementation. System measurement based methods, which focus on failures and down times, are used for analyzing systems already in use and for making predictions on implemented systems that are usually run and tested in a lab. The effort in software reliability growth based models [20] is concentrated on statistical testing, and therefore the models are applicable in the late development phase. These types of methods are called black-box approaches, since they ignore the internal structure of software systems. Since today’s software systems are based on components and their interactions, these methods do not encompass the reliability and availability prediction of component based software architectures. The so-called white-box approaches consider the system’s internal structure in reliability prediction, computing the system level reliability based on the reliabilities of its components. Goseva-Popstojanova and Trivedi[6] provide a useful survey of architecture based approaches, categorizing them into state-based, path-based and additive models. The state-based models use the probabilities of the transfer of control between components to estimate the system reliability, whereas the path-based models compute the reliability of composite software based on the possible execution paths of the system. The additive models address the failure intensity of composite software, assuming that the system failure intensity can be calculated from component failure intensities. The additive
models, however, model failure intensities with mathematical algorithms, and therefore do not explicitly examine software architectures. The earliest methods of state-based and path based models [5] were proposed in the 1970s and new methods have evolved since then.
Qualitative analysis methods manipulate knowledge rather than numbers. This knowledge is usually specific for the system under study and can be explicit, i.e. documented; or tacit, undocumented. The tacit knowledge is only in the designers’ mind, which makes the analysis process highly human dependent and therefore prone to errors. Knowledge can also be abstract/general, or domain/application specific. Recently, there has been a tendency to document general knowledge, for example, by identifying and using architectural styles and patterns. There still exists a considerable lack of architectural styles and patterns that concentrate on solving the problems of reliability and availability.
4. COMPARISON OF RELIABILITY
AND AVAILABILITY PREDICTION
METHODS
Since numerous analysis methods are available for reliability. Hence we are defining the scope for the methods. Selections are made on the following basis.
• Concentrating on software reliability and/or availability
• Based on architectural view • User centric approaches for analysis • Provide clear and applicable analysis
Tables 2 and 3 represent the detailed comparison results of the selected six methods.
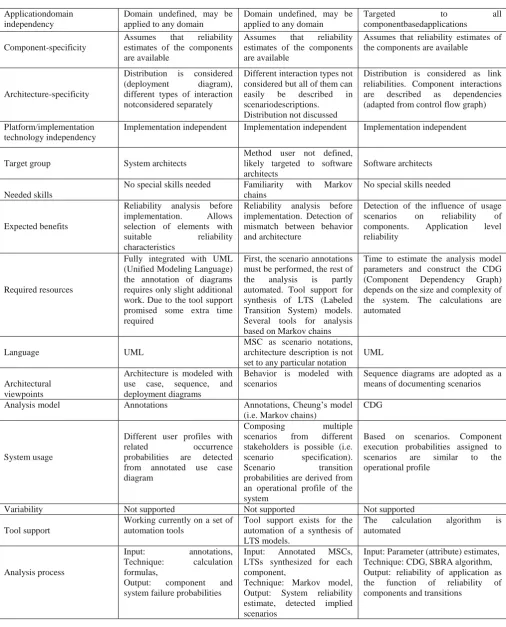
Table 2.Comparison summary of reliability analysis methods (part1/2)
Elements Cortellessa et al. [7] Rodrigues et al. [8] Yacoub et al. [9]
Goal
To predict system reliability based on component and connector failure rates
To predict software system reliability taking into account the component structure that is exhibited in the scenarios and concurrent nature of systems
To analyze the reliability of component-based applications as a function of their components and interfaces
Scope of applicability
Focused on the application layer but can also be applied toother layers of software
Not designed for any specific software layer
Table 2. Continued
Applicationdomain independency
Domain undefined, may be applied to any domain
Domain undefined, may be applied to any domain
Targeted to all componentbasedapplications
Component-specificity
Assumes that reliability estimates of the components are available
Assumes that reliability estimates of the components are available
Assumes that reliability estimates of the components are available
Architecture-specificity
Distribution is considered (deployment diagram), different types of interaction notconsidered separately
Different interaction types not considered but all of them can easily be described in scenariodescriptions.
Distribution not discussed
Distribution is considered as link reliabilities. Component interactions are described as dependencies (adapted from control flow graph)
Platform/implementation technology independency
Implementation independent Implementation independent Implementation independent
Target group System architects
Method user not defined, likely targeted to software architects
Software architects
Needed skills
No special skills needed Familiarity with Markov chains
No special skills needed
Expected benefits
Reliability analysis before implementation. Allows selection of elements with suitable reliability characteristics
Reliability analysis before implementation. Detection of mismatch between behavior and architecture
Detection of the influence of usage scenarios on reliability of components. Application level reliability
Required resources
Fully integrated with UML (Unified Modeling Language) the annotation of diagrams requires only slight additional work. Due to the tool support promised some extra time required
First, the scenario annotations must be performed, the rest of the analysis is partly automated. Tool support for synthesis of LTS (Labeled Transition System) models. Several tools for analysis based on Markov chains
Time to estimate the analysis model parameters and construct the CDG (Component Dependency Graph) depends on the size and complexity of the system. The calculations are automated
Language UML
MSC as scenario notations, architecture description is not set to any particular notation
UML
Architectural viewpoints
Architecture is modeled with use case, sequence, and deployment diagrams
Behavior is modeled with scenarios
Sequence diagrams are adopted as a means of documenting scenarios Analysis model Annotations Annotations, Cheung’s model
(i.e. Markov chains)
CDG
System usage
Different user profiles with related occurrence probabilities are detected from annotated use case diagram
Composing multiple scenarios from different stakeholders is possible (i.e. scenario specification). Scenario transition probabilities are derived from an operational profile of the system
Based on scenarios. Component execution probabilities assigned to scenarios are similar to the operational profile
Variability Not supported Not supported Not supported Tool support
Working currently on a set of automation tools
Tool support exists for the automation of a synthesis of LTS models.
The calculation algorithm is automated
Analysis process
Input: annotations, Technique: calculation formulas,
Output: component and system failure probabilities
Input: Annotated MSCs, LTSs synthesized for each component,
Technique: Markov model, Output: System reliability estimate, detected implied scenarios
Input: Parameter (attribute) estimates, Technique: CDG, SBRA algorithm, Output: reliability of application as the function of reliability of components and transitions
Table 2. Continued
Limitations components must be available. Independence of failures among different components
components has the Markov property. Failures are independent across transitions. There is only one initial and one final scenario for a system. Component reliability must be available
component reliability must be available. Does not consider failure dependencies between components or take into account the overall application reliability growth as a function of time
Maturity of method Validation is based on experimental evaluation performed by the authors
Validation is based on empirical evaluation performed by the authors
An experimental case study is used to illustrate the applicability of the approach
Traceability of R&A requirements
Not supported Not supported Not supported Precision of prediction Not compared with actual
values
Not compared with actual values
[image:5.595.50.556.72.221.2]Not compared with actual values
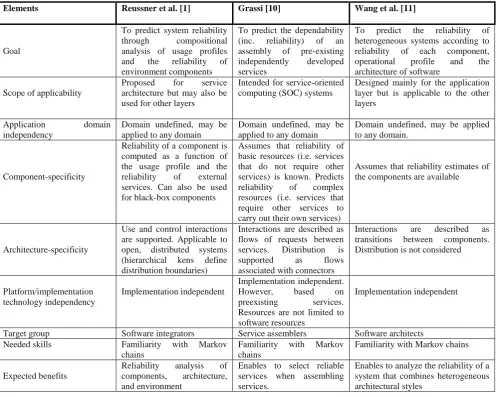
Table 3.Comparison summary of reliability analysis methods (part 2/2)
Elements Reussner et al. [1] Grassi [10] Wang et al. [11]
Goal
To predict system reliability through compositional analysis of usage profiles and the reliability of environment components
To predict the dependability (inc. reliability) of an assembly of pre-existing independently developed services
To predict the reliability of heterogeneous systems according to reliability of each component, operational profile and the architecture of software
Scope of applicability
Proposed for service architecture but may also be used for other layers
Intended for service-oriented computing (SOC) systems
Designed mainly for the application layer but is applicable to the other layers
Application domain independency
Domain undefined, may be applied to any domain
Domain undefined, may be applied to any domain
Domain undefined, may be applied to any domain.
Component-specificity
Reliability of a component is computed as a function of the usage profile and the reliability of external services. Can also be used for black-box components
Assumes that reliability of basic resources (i.e. services that do not require other services) is known. Predicts reliability of complex resources (i.e. services that require other services to carry out their own services)
Assumes that reliability estimates of the components are available
Architecture-specificity
Use and control interactions are supported. Applicable to open, distributed systems (hierarchical kens define distribution boundaries)
Interactions are described as flows of requests between services. Distribution is supported as flows associated with connectors
Interactions are described as transitions between components. Distribution is not considered
Platform/implementation technology independency
Implementation independent
Implementation independent. However, based on preexisting services. Resources are not limited to software resources
Implementation independent
Target group Software integrators Service assemblers Software architects Needed skills Familiarity with Markov
chains
Familiarity with Markov chains
Familiarity with Markov chains
Expected benefits
Reliability analysis of components, architecture, and environment
Enables to select reliable services when assembling services.
Enables to analyze the reliability of a system that combines heterogeneous architectural styles
Table 3. Continued
Required resources
Development of Markov chains for kens/composite kens. Not easily applicable (time-consuming) if the calculations are not
Development of three different models. Not easily applicable (time-consuming) if the calculations are not automated
[image:5.595.51.549.263.660.2]automated already exist, or tool support is not provided
Language
Uses RADL (Rich Architecture Definition language ), can be applied to UML as well
Does not require any specific architecture notation
Does not require any specific architecture notation
Architectural viewpoints
Describes architecture as a composition of kens
Describes architecture as an assembly of services
Architecture described as components and connectors
Analysis model Markov chains
Flows of request are modeled by a discrete time Markov
chain
Markov chains
System usage
Usage profiles are modeled as probabilities of calls to a provided service in a certain state
Services of complex resources are characterized by a flow modeling the usage profile of other services
Operational profile is taken into account as transition probabilities between components
Variability Not supported Not supported Not supported Tool support Not provided Not provided Not provided
Analysis process
Input: the reliability of basic kens, service FSMs, and usage profiles of provided services,
Technique: Markov chains, Output: Service reliability and overall reliability
Input: failure information of the service flows,
Technique: Markov chains, flow model,
Output: reliability of a service as the reliability of the services it requires
Input: integrated global state view of the system, Technique: transition Matrix, Output: reliability of the system
Limitations
Requires certain data for the architectural kens. Failures of services are independent
The failure rate of basic resources is known. Each request in a state must be fulfilled according to some completion models before a transition to the next state can take place
Assumes that the reliabilities of components and connectors are independent of the transition probabilities
Maturity of method Validation is based on empirical evaluation performed by the authors
Validation is based on a laboratory example used for illustrating the approach
Validation is based on experiments performed by the authors
Traceability of R&Arequirements
Not supported Not supported Not supported
Precision of prediction
In the example system, the deviation of the prediction from the measured value is below 1%
Not compared with actual values
Not compared with actual values
5. RESULTS OF THE COMPARISON
Reliability and availability, as well as other quality attributes, have just recently begun to be addressed at the architecture level methods, techniques and notations. Design approaches already exist that use quality attributes as primary requirements when designing software architecture [1], [12]. It has also been recognized that analysis from the architecture is only possible if the architecture is represented in a way that enables the analysis [13]. A standard notation extension is required in order to unify the different analysis methods and to avoid the development of an enormous amount of separate annotation and extension techniques. All of the surveyed methods require some additional work, mostly regarding the development of an analysis model or application of mathematical algorithms. It is obvious that approaches closer to UML require less additional work as UML being a widely used standard, and therefore, are more familiar to architects working in industry than the approaches that require a separate analysis model. It is also obvious that more tool support is needed in order to make reliability prediction a
6. CONCLUSIONS
Based on our literature survey, the paper concludes that the current analysis methods have several shortcomings limiting their use in industrial settings. The most common shortcomings were a lack of support for tools and variability, weak reliability analysis of software components, and weak validation of the methods and their results. In addition, there was no proof of the maturity of the methods as they were not validated or used in the industry. Furthermore, quantitative methods alone cannot provide a comprehensive prediction of the reliability and availability of a system. The comparison process using the framework was straightforward and simple. The framework is a valuable tool for anyone searching for an applicable analysis method. Based on the comparison using the framework the best suitable analysis method can be selected. The framework assists to pay attention to important issues of the analysis methods from the viewpoint of software architecture. Although the framework was not applied to availability analysis methods, but still believe that the framework is suitable for the evaluation methods of any quality attribute because its elements have been defined according to the needs of architectural evaluation, not from the viewpoint of any specific quality attribute. The framework also takes into account variability, the specific characteristic of product family architectures that are increasingly applied to software intensive systems in industry. In summary, future research activities are needed for developing availability analysis methods applicable for service oriented architectures, a standard notation describing reliability, availability and their variations in architectural descriptions, and for improving architecture modeling and analysis tools which are needed for providing architects with an integrated working environment. The main benefit of an integrated environment is that it enables the achievement of a better traceability of reliability and availability requirements, and therefore, a better applicability of the methods for large software products in the industry.
7. REFERENCES
[1] Reussner, R.H., Schmidt, H.W., Poernomo, I.H.: Reliability prediction for component-based software architectures. J. Systems Softw. 66(3), 241–252 (2003) [2] Avizienis, A.,Laprie, J.C.,Randell,B.: Fundamental
Concepts of Dependability. LAAS-CNRS. p. 21 (2001)
[3] Lyu, M. R. (2007), Software Reliability Engineering, A Roadmap, in proceedings of international conference on Future of Software Engineering, Washington, pp.153-170.
[4] Jayaratna, N.: Understanding and Evaluating Methodologies: NIMSAD: a Systematic Framework. McGraw Hill, London, 259 p (1994)
[5] Shooman, M.: Structural models for software reliability prediction. In: Proceedings of the 2nd International Conference on Software Engineering (1976)
[6] Goseva-Popstojanova, K., Trivedi, K.S.: Architecture based approach to reliability assessment of software systems. Perform. Evaluat. 45(2–3), 179–204 (2001)
[7] Cortellessa, V., Singh, H., Cukic, B.: Early reliability assessment of UML based software models. In: Third International Workshop on Software and Performance. Rome (2002)
[8] Rodrigues, G.N., Rosenblum, D.S., Uchitel, S.: Using scenariosto predict the reliability of concurrent component-basedsoftware systems. In: 8th International Conference on Fundamental Approaches to Software Engineering, FASE 2005. Springer Lecture Notes in Computer Science, Edinburgh,(2005).
[9] Yacoub, S., Cukic, B., Ammar, H.: Scenario-based reliability analysis of component-based software. In: Proceedings of 10th International Symposium on Software Reliability Engineering (ISSRE’99) (1999). [10]Grassi, V.: Architecture-based dependability prediction
for service-oriented computing. In: Proceedings of the Twin Workshops on Architecting Dependable Systems, International Conference on Software Engineering (ICSE 2004). Springer, Edinburgh, (2004)
[11]Wang, W.-L., Wu, Y., Chen, M.-H.: An architecture based software reliability model. In: Pacific Rim International Symposium on Dependable Computing. IEEE, Hong Kong (1999)
[12]Bachmann, F., Bass, L., Klein, M.: Moving from quality attribute requirements to architectural decisions. In: Second International Software Requirements to Architectures, STRAW’03. Portland, USA (2003) [13]Jazayeri, M., Ran, A., van der Linden, F.: Software
Architecture for Product Families. Addison-Wesley, Boston, 257 p (2000)
[14]Laprie, J.C., Kanoun, K.: X-ware reliability and availability modeling. IEEE Trans. Software Eng. 18(2), 130–147 (1992)
[15]Ledoux, J.: Availability modeling of modular software. IEEE Trans. Reliability 48(2), 159–168 (1999)
[16]ISO/IEC, Software Engineering - Product Quality. Part 1: Quality Model (2001)
[17]Suri, P.K. (2009), Simulator for Risk assessment of software project based on performance measurement, International Journal of Computer Science and Network Security, Vol.9 No.6, pp. 23-30.
[18]Taylor, R. and Vander, Hoek A. (2007), Software Design and Architecture: The Once and Future Focus of Software Engineering, International conference on Future of Software Engineering , IEEE-CS Press, pp. 226-243
[19]Yadav, A. and Khan R.A.(2009), Critical review on software reliability models, International Journal of recent trends in Engineering, Vol 2, No. 3, pp. 114-116. [20]Yamada, S., Ohtera, H. and Narihisa, H. (1986),