Comparative Study of Principal Component Analysis
and Independent Component Analysis
Sushma Niket Borade
Research Scholar
Dept. of Computer Science and I.T. Dr. Babasaheb Ambedkar Marathwada University,
Aurangabad – 431004, India
Ratnadeep R. Deshmukh,
Ph. D ProfessorDept. of Computer Science and I.T. Dr. Babasaheb Ambedkar Marathwada University,
Aurangabad – 431004, India
ABSTRACT
Face recognition is emerging as an active research area with numerous commercial and law enforcement applications. This paper presents comparative analysis of two most popular subspace projection techniques for face recognition. It compares Principal Component Analysis (PCA) and Independent Component Analysis (ICA), as implemented by the InfoMax algorithm. ORL face database is used for training and testing of the system. The results show that for the task of face recognition, ICA outperforms PCA in terms of recognition rate and subspace dimensionality.
General Terms
Image processing, Pattern Recognition, Face Recognition.
Keywords
Face recognition, PCA, ICA, subspace analysis methods.
1.
INTRODUCTION
A biometric system provides automatic identification for an individual based on a unique feature or characteristics possessed by the individual. Biometric systems have been developed based on eye, iris, retina, fingerprints, finger geometry, voice, hand geometry, palm, signature and the one presented in this paper, the human face. Among these systems, fingerprint analysis and retinal or iris scans are very reliable. But they rely on the cooperation of the participant, whereas face recognition system is effective because it does not require participant’s cooperation or knowledge. Face recognition is emerging as an active research area in the fields of image processing, pattern recognition, computer vision and neural network. Its applications range from static matching of controlled format photographs such as passports, credit cards, photo IDs, drivers licenses, and mug shots to real time matching of surveillance video images. Face recognition problem can be defined as the identification of one or more persons using stored database of face images. Zhao et al. has given detailed literature survey on face recognition techniques [1]. Face recognition methods [2] are categorized as: 1) Appearance-based or template matching methods: They compare the intensity values of the whole face or specific regions of face with the intensity values of the ones in the database. 2) Feature-based or structural matching methods: They extract the local features (brows, eyes, nose, mouth, cheeks etc.) and form the feature vectors using distances and angles between them.
Among various approaches to face recognition, appearance-based subspace methods give the most promising results. In these subspace projection techniques, probe image is projected on lower dimensional subspace and then recognition is done by finding its distance from gallery images. In this paper, two most popular subspace projection techniques for
face recognition are presented. They are: Principal Component Analysis (PCA) and Independent Component Analysis (ICA). PCA finds basis vectors such that when samples are projected on them, they retain most of the original information [3, 4]. ICA decorrelates both second and high order statistics of data and finds statistically independent basis vectors [5]. Basically PCA considers the 2nd order moments only and it uncorrelates data, while ICA also uncorrelates higher order statistics and identifies the independent sources from their mixtures.
This paper provides a comparative analysis of these two projection methods in equal working environment. Comparison is done using grayscale images of persons from ORL face database, which is a publicly available database. For fair comparison, same preprocessed images are used as input into these algorithms. Distance metrics used are Euclidean and cosine.
Why to perform comparative analysis of PCA and ICA? It is interesting to note that the literature on the subject is contradictory. For example, Liu and Wechsler [6], Barlett et al. [5,7], and Yuen and Lai [8] claimed that ICA outperforms PCA for face recognition. However, other research groups reported different findings on this subject. Baek et al. [9] claimed that PCA outperforms ICA. Moghaddam [10] and Jin [11] reported that there is no significant difference between the performances of these two methods. Socolinsky and Salinger recently showed that ICA outperforms PCA on visible light images, but PCA is better than ICA on infrared images [12]. Draper et al. [13] tried to relate previous comparisons to each other and to their work by testing PCA and ICA on FERET database. They showed that the performance of PCA and ICA depends on the task statement, the ICA architecture and the distance metric.
The rest of this paper is organized as follows: Section 2 describes the algorithms to be compared, Section 3 reports the details of methodology, Section 4 presents performance comparison of the described methods and Section 5 concludes the paper.
2.
ALGORITHMS
2.1
Principal Component Analysis
applied PCA to efficiently represent faces while Turk and Pentland used PCA for representing and recognizing faces. PCA finds a set of orthogonal basis vectors which best reconstructs the face images with smallest mean square error for given subspace. These orthogonal basis vectors are the eigenvectors of the covariance matrix of the face images. Due to the face like appearance of eigenvectors, they are also called as eigenfaces.
In this paper, face recognition using PCA is implemented as proposed by Turk and Pentland [3, 4]. Let the training set of M face images be Г1, Г2,…, ГM and average face of the set be
Ѱ. Each face differs from the average face by the vector 𝛷𝑖= 𝛤𝑖− 𝛹. Covariance matrix C is found as:
𝐶 = 𝐴𝐴𝑇, (1)
where matrix 𝐴 = 𝛷1𝛷2… 𝛷𝑀 . The size of covariance
matrix C is N2 by N2, and its intractable task for typical image sizes to find its N2 eigenvectors and eigenvalues. Therefore Turk and Pentland proposed computationally feasible method to find these eigenvectors. The eigenvectors vi of ATA are
considered such that
𝐴𝑇𝐴𝑣
𝑖= 𝜇𝑖𝑣𝑖 (2)
Premultiplying both sides by A, 𝐴 𝐴𝑇𝐴𝑣
𝑖= 𝜇𝑖 𝐴𝑣𝑖 (3)
where Avi are the eigenvectors and µi are the eigenvalues of
𝐶 = 𝐴𝐴𝑇. Now construct matrix 𝐿 = 𝐴𝑇𝐴 which is of size M
by M, and find its M eigenvectors, vi. The eigenvectors of
matrix L are used to find most significant M eigenvectors (i.e. eigenfaces) of covariance matrix C as:
𝑢𝑙= 𝑀𝑘=1𝑣𝑙𝑘𝛷𝑘, 𝑙 = 1, … , 𝑀 (4) This reduces calculations from number of pixels in image (N2)
to number of images (M) in training set. Practically, smaller number of eigenfaces (M') corresponding to largest eigenvalues are sufficient for face recognition. Eigenvectors corresponding to larger eigenvalues captures more of data variance. The eigenfaces form M dimensional subspace of the original N2 image space. Each image in training set is projected on this face space using equation,
𝑤𝑘 = 𝑢𝑘𝑇 𝛤 − 𝛹 , for 𝑘 = 1, … , 𝑀′ (5)
and its projection vector 𝛺𝑇= 𝑤1, 𝑤2, … 𝑤𝑀′ is stored in
database. For recognition, the given test image is normalized, mean subtracted and projected on the same subspace. Then its projection vector is compared to the stored projections of training images. Using similarity measure (Euclidean), test image is assigned the identity of closest training image.
2.2
Independent Component Analysis
While PCA uncorrelates data using second-order statistics only, ICA minimizes both second-order and high order dependencies of input. ICA is one powerful solution to blind source separation problem where task is to separate original source signals from their mixtures.
2.2.1
Motivation
Suppose two people are speaking simultaneously in a room having two microphones. The microphones give two recorded signals, x1(t) and x2(t), where x1 and x2 are amplitudes and t is
time index. Each recorded signal is a weighted sum of the speech signals, s1(t) and s2(t), emitted by the two speakers.
This can be expressed as linear equations:
𝑥1 𝑡 = 𝑎11𝑠1+ 𝑎12𝑠2 (6)
𝑥2 𝑡 = 𝑎21𝑠1+ 𝑎22𝑠2 (7)
where parameter aij depends on the distances between
microphones and the speakers. Here only recorded signals x1(t) and x2(t) are known. The goal is to estimate the two
original speech signals s1(t) and s2(t). This is called the
cocktail-party problem [16]. Here ICA can be used to estimate
the parameters aij. Once aijare known, the two original source
signals s1(t) and s2(t), can be easily separated from their
mixtures x1(t)and x2(t).
2.2.2
ICA Basic Model
In general, for n mixtures x1…xn of n independent sources,
linear equation is:
𝑥𝑗 = 𝑎𝑗1𝑠1+ 𝑎𝑗2𝑠2+ ⋯ + 𝑎𝑗𝑛𝑠𝑛, for all j. (8)
Here it is assumed that all mixtures and source signals are random variables instead of time signals. Using matrix notation, this mixing model is written as
𝑋 = 𝐴𝑆, (9) where A is matrix with elements aij. This is called ICA model.
Here mixing matrix A is unknown. Only known variable is X and goal is to estimate both A and S using it. It is assumed that source signals si are statistically independent of each other i.e.
value of one does not depend on value of other and unknown mixing matrix A is square and invertible. Once matrix A is obtained, its inverse, say W, can be estimated and independent sources can be found by:
𝑆 = 𝑊𝑋. (10) ICA can be used for performing blind source separation. A
"source" means an original independent signal. "Blind" means very little is known about mixing matrix.
2.2.3
Preprocessing for ICA
ICA is generalization of PCA. PCA decorrelates the data so that covariance is zero. This removes first and second order statistics of data. Complexity of problem is reduced by performing dimensionality reduction using PCA and whitening. Whitening is stronger constraint which makes covariance matrix of data equal to identity matrix. For whitening, X is passed through whitening matrix Wz which is
twice the inverse square root of the covariance matrix as:
𝑊𝑧 = 2 ∗ 𝐶𝑜𝑣 𝑋 − 1∕2
(11)
After whitening, the covariance matrix of X equals the identity matrix [5]. This ensures that mixed signals have unit variance and are uncorrelated. The uncorrelation removes the second-order dependencies between the observed signals.
2.2.4
InfoMax Algorithm
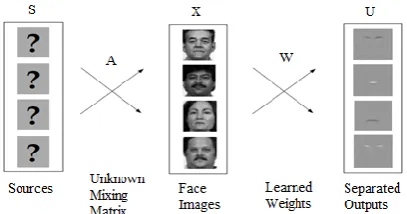
[image:2.595.325.529.584.691.2]For face recognition various ICA algorithms can be used like InfoMax, FastICA and JADE. Bell and Sejnowski proposed InfoMax algorithm. It is derived from the principle of optimal information transfer in neurons with sigmoidal transfer functions [17, 18].
Figure 1: ICA (InfoMax algorithm) - Image synthesis model for architecture I
basis) images from S. Let W be n by n invertible weight matrix. As seen earlier from eq. 10,
𝑈 = 𝑊𝑋. (12) Goal is to find matrix W such that 𝐼 𝑢𝑖, 𝑢𝑗 = 0 i.e. mutual
information between rows of U is zero.
Figure 2: Optimal information flow in sigmoidal neurons. Right: fy(y) is plotted for different values of the weight, w.
The optimal weight, wopt, transmits the most information
If each ui is passed through sigmoidal transfer (i.e. logistic)
function as (see Figure 2):
𝑦𝑖= 𝑓𝑖 𝑢 = 1 ∕ 1 + 𝑒−𝑢 , (13)
then output yi has maximum entropy. Joint entropy H(yi, yj)
is:
𝐻 𝑦𝑖, 𝑦𝑗 = 𝐻 𝑦𝑖 + 𝐻 𝑦𝑗 − 𝐼 𝑦𝑖, 𝑦𝑗 . (14)
Joint entropy is maximum when 𝐼 𝑦𝑖, 𝑦𝑗 = 0. Joint entropy
can be maximized by performing gradient ascent on it w.r.t. the weight matrix W. The gradient update rule for the W is:
∆ 𝑊 = 𝐼 + 𝑌𝑇 𝑊, where I is identity matrix. (15)
Now find W for which joint entropy is maximum. When there are multiple inputs and outputs, maximizing the joint entropy of the output Y encourages the individual outputs to move toward statistical independence [5]. Once W is known, U can be found as seen previously:
𝑈 = 𝑊𝑋. (16) U gives independent basis vectors.
For face recognition, two architectures of ICA are proposed by Barlette et al. [5, 7] as: Architecture I - statistically independent basis images (see Figure 1) and Architecture II - factorial code representation. Architecture I treats the images as random variables and the pixels as outcomes and Architecture II treats the pixels as random variables and the images as outcomes.
In this paper, ICA is implemented using InfoMax algorithm which is proposed by Bell and Sejnowski.Architecture I finds a set of independent basis images. All training images are stored in rows of matrix X and 𝑈 = 𝑊𝑋. ICA algorithm finds a weight matrix W such that the rows of U are as statistically independent as possible. As seen earlier (Figure 1), rows of U will have independent basis images which will represent faces. The number of Independent Components found by the ICA algorithm corresponds to the dimensionality of the input (n). This is intractable task. Therefore first dimensionality reduction is done using PCA and most significant m eigenvectors of training set are found. Then Independent Component Analysis is performed on these most significant m eigenvectors (instead of performing on all n training images). Here m<n. This produces m independent source (i.e. basis) images in the rows of U. Let Pm be matrix containing first m
eigenvectors in its columns. PC representation of set of images in X based on Pm is:
𝑅𝑚= 𝑋 𝑃𝑚 (17)
ICA algorithm produces matrix:
𝑊𝐼= 𝑊 𝑊𝑧 , (18)
where Wz is a sphering matrix as defined in eq. 11. The IC
representation of face images is given by rows of the matrix:
𝐵 = 𝑅𝑚𝑊𝐼−1. (19)
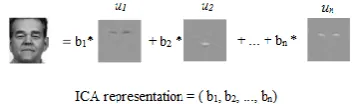
[image:3.595.339.517.248.300.2]These b’s are some scalar values. Basis vectors are in rows of U. Each image in training set X can be represented as weighted linear combination of all independent basis images, u, as shown over here.
Figure 3: InfoMax algorithm (architecture-I): The independent basis image representation
2.2.5
Recognition
For recognition, ICA representation of test image i.e. btestis
compared with ICA representations of all images in training database using cosine similarity measure as:
𝑐 = 𝑏𝑡𝑒𝑠𝑡.𝑏𝑡𝑟𝑎𝑖𝑛
||𝑏𝑡𝑒𝑠𝑡|| ||𝑏𝑡𝑟𝑎𝑖𝑛||. (20)
Test image is then assigned identity of closest training image.
3.
METHODOLOGY
3.1
Data
[image:3.595.317.542.571.666.2]Standard ORL face database [19] is used for recognition tests. It contains a set of face images taken at the AT & T Laboratories. It has grayscale images of 40 different persons with 10 images per person. The images are taken by varying the lighting, facial expressions (open / closed eyes, smiling / not smiling) and facial details (glasses / no glasses). All the images are in an upright, frontal position (with tolerance for some side movement). The size of each image is 112 x 92 pixels, with 256 grey levels per pixel. Some ORL face database images are shown in Figure 4.
Figure 4: Face samples from the ORL face database
3.2
Preprocessing and training
formed by considering one image of each person (from remaining five). It also had five images of unknown persons. Thus, test data set had total 35 images. After all the subspaces had been derived, all images from data sets were projected onto each subspace and recognition using nearest neighbor classification with various distance measures (Euclidean and Cosine) was conducted.
4.
RESULTS
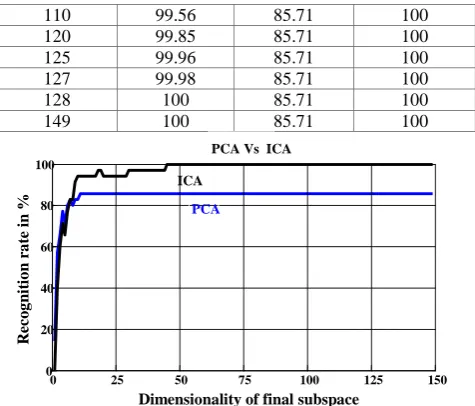
[image:4.595.312.550.70.273.2]Results of the experiment can be seen in Table 1 and Figure 5.
Table 1. Recognition rates corresponding to dimensionality of final subspace for PCA and ICA
Dimensions of final subspace
% of sum of all eigenvalues
PCA (Recognition
rate in %)
ICA (Recognition
rate in %)
1 20.33 14.29 0
2 33.60 57.14 40
3 42.78 65.71 60
4 49.84 77.14 71.43
5 56.24 71.43 65.71
6 60.34 80 77.14
7 63.79 82.86 82.86
8 66.55 80 82.86
9 69.22 82.86 91.43
10 71.45 82.86 94.29
11 73.30 85.71 94.29
12 74.98 85.71 94.29
13 76.98 85.71 94.29
14 77.77 85.71 94.29
15 78.99 85.71 94.29
16 80.19 85.71 94.29
17 81.25 85.71 94.29
18 82.15 85.71 97.14
19 83.02 85.71 97.14
20 83.85 85.71 94.29
21 84.60 85.71 94.29
22 85.32 85.71 94.29
24 86.59 85.71 94.29
25 87.19 85.71 94.29
26 87.73 85.71 94.29
27 88.23 85.71 94.29
28 88.73 85.71 94.29
29 89.16 85.71 94.29
30 89.56 85.71 97.14
31 89.94 85.71 97.14
32 90.31 85.71 97.14
33 90.64 85.71 97.14
34 90.96 85.71 97.14
37 91.82 85.71 97.14
38 92.09 85.71 97.14
39 92.34 85.71 97.14
40 92.58 85.71 97.14
41 92.80 85.71 97.14
42 93.02 85.71 97.14
44 93.44 85.71 97.14
45 93.64 85.71 100
52 94.91 85.71 100
59 95.90 85.71 100
68 96.93 85.71 100
80 97.97 85.71 100
90 98.63 85.71 100
96 98.97 85.71 100
105 99.37 85.71 100
110 99.56 85.71 100
120 99.85 85.71 100
125 99.96 85.71 100
127 99.98 85.71 100
128 100 85.71 100
[image:4.595.48.289.210.782.2]149 100 85.71 100
Figure 5: Recognition rates vs. subspace dimensions for PCA and ICA
Recognition rates were measured for subspace dimensionalities starting at 1 and increasing by 1 dimension up to a total of 149. For each approach, it was observed that rate of recognition increased as the dimensionality of final subspace (i.e. number of eigenvectors used) was increased.
As training set consisted of 5 x 30 = 150 images (M = 150), PCA derived, in accordance with theory, 𝑀 − 1 = 149 meaningful eigenvectors [3]. For PCA, maximum recognition rate achieved was 85.71% (using minimum 11 eigenfaces). It was calculated that 73.30% of original information (energy) was retained in those 11 eigenvectors. Even if the number of eigenfaces in the final subspace is increased, the recognition rate did not increase.
PCA is used as a preprocessing dimensionality reduction step for face recognition using ICA.This PCA subspace was used as input to ICA. 100% recognition rate was achieved using only 45 eigenvectors. It was calculated that 93.64% of original information (energy) was retained in subspace dimensionality of 45. Whereas for face recognition using PCA, maximum recognition rate achieved was 85.71% (even if all 149 meaningful eigenvectors were considered).
5.
CONCLUSIONS
This paper presented comparative study of two most popular appearance-based face recognition methods (PCA and ICA) in equal working environments. Following conclusions can be drawn from this research work: (1) Face recognition rate increases as the dimensionality of final subspace increases. (2) ICA greatly improves the performance of face recognition. It outperforms PCA in terms of recognition rate and subspace dimensionality. (3) This is because of the following advantage of using ICA for facial identity: much of the important information is contained in the high-order statistics of the images. In PCA only the second-order statistics are decorrelated. Whereas ICA considers high-order statistical dependencies such as the relationships among three or more pixels and decorrelates both second and high order moments.
0 0
ICA
Dimensionality of final subspace
25 50 75 100 125 150
20 40 60 80 100
R
ec
o
g
n
it
io
n
r
a
te
i
n
% PCA
REFERENCES
[1] Zhao, W., Chellappa, R., and Phillips, A. 2003. Face recognition in still and video images: a literature survey, ACM Comput. Surv. 35 (Dec. 2003), 399-458.
[2] Brunelli, R. and Poggio, T. 1993. Face recognition: features versus templates. IEEE Trans. Pattern Anal. Machine Intell. 15 (Oct. 1993), 1042-1052.
[3] Turk, M. and Pentland, A. 1991. Eigenfaces for recognition. J. Cogn. Neurosci. 3 (1991), 71-86.
[4] Turk, M. and Pentland, A. 1991. Face recognition using eigenfaces. In Proceedings of the IEEE Conference on Computer Vision and Pattern Recognition.
[5] Bartlett, M. S., Movellan, J. R., and Sejnowski, T. J. 2002. Face Recognition by Independent Component Analysis. IEEE Trans. Neural Networks. 13 (Nov. 2002), 1450-1464.
[6] Liu, C. and Wechsler, H. 1999. Comparative assessment of Independent Component Analysis (ICA) for face recognition. Int. Conference on Audio and Video Based Biometric Person Authentication, Washington D.C. USA.
[7] Barlett, M. S., Lades, H. M., and Sejnowski, T. J. 1998. Independent component representations for face recognition. In Proceedings of the SPIE Symposium on Electronic Imaging: Science and Technology Conference on Human Vision and Electronic Imaging III, San Jose, California.
[8] Yuen, P. C. and Lai, J. H. 2000. Independent Component Analysis of face images. IEEE Workshop on Biologically Motivated Computer Vision, Seoul.
[9] Baek, K., Draper, B. A., Beveridge, J. R., and She, K. 2002. PCA vs ICA: A comparison on the FERET data set. Joint Conference on Information Sciences, Durham, NC.
[10]Moghaddam, B. 2002. Principal manifolds and probabilistic subspaces for visual recognition. IEEE
Trans. Pattern Anal. Machine Intell. 24 (June 2002). 780-788.
[11]Jin, Z. and Davoine, F. 2004. Orthogonal ICA representation of images. In Proceedings of the 8th Int. Conference on Control, Automation, Robotics and Vision.
[12]Socolinsky, D. and Selinger, A. 2002. A comparative analysis of face recognition performance with visible and thermal infrared imagery. In Proceedings of the Int. Conference on Pattern Recognition, Quebec City.
[13]Draper, B. A., Baek, K., Bartlett, M. S., and Beveridge, J. R. 2003. Recognizing faces with PCA and ICA. J. Computer vision and image understanding, Special issue on Face Recognition. 91 (July 2003), 115-137.
[14]Sirovich, L. and Kirby, M. 1987. Low-dimensional procedure for the characterization of human faces. J. Optical Society of America. 4 (Mar. 1987), 519-524.
[15]Kirby, M. and Sirovich, L. 1990. Application of the Karhunen-Loeve procedure for the characterization of human faces. IEEE Trans. Pattern Anal. Machine Intell. 12 (Jan. 1990), 103-108.
[16]Hyvarinen, A. and Oja, E. 2000. Independent Component Analysis: algorithms and applications. J. Neural Networks. 13 (June 2000), 411-430.
[17]Bell, A. J. and Sejnowski, T. J. 1995. Fast blind separation based on information theory. In Proceedings of the Int. Symposium on Non-linear Theory and Applications, Las Vegas.
[18]Bell, A. and Sejnowski, T. 1995. An information-maximization approach to blind separation and blind deconvolution. J. Neural Computation. 7 (Nov. 1995), 1004-1034.