http://dx.doi.org/10.4236/ojmh.2015.54011
Variations in the Patterns of Precipitation in
the Watershed of the Ambato River
Associated with the Eruptive Process
of the Tungurahua Volcano in Ecuador
Iván Ríos García
1,2, Abel Solera
11Universidad Politècnica de Valencia, Valencia, Spain 2Universidad Nacional de Chimborazo, Riobamba, Ecuador
Email: [email protected]
Received 22 July 2015; accepted 23 October 2015; published 26 October 2015
Copyright © 2015 by author and Scientific Research Publishing Inc.
This work is licensed under the Creative Commons Attribution International License (CC BY). http://creativecommons.org/licenses/by/4.0/
Abstract
The Tungurahua, located in the Cordillera de los Andes, is the volcano with the most eruptive ac-tivity in Ecuador nowadays. 1993 records the eruptive initial process and in August of 1999, after almost 80 years of rest, the volcano begins an explosive eruptive period. This research examines the effects of the eruptive process of the volcano in the patterns of change in precipitation in the short term in a hydrographic watershed. Their results are intended to contribute to the studies carried out to understand the weather and the factors influencing its variability at local and global level. It aims also to contribute with technical data in the debate about experimenting with artifi-cial volcanoes to weather modification. The analysis demonstrates a process of redistribution of rainfall, with significant increases in rainfall from 42.25% on December, and significant decreases of 40.03% on September, during the presence of the eruptive process.
Keywords
Volcanic Eruption, Rainfall Variability, Tungurahua
1. Introduction
Ecuador is a country that is located in one of the areas of highest tectonic complexity, where the Nazca and South American plates generate a high seismic activity and have an impact on the activation of several of its volcanoes [1]. One of them is the Tungurahua volcano that after 80 years of resting begins its eruptive process in January 1993 and later; in August 1999, an explosive eruptive process began. This natural phenomenon marks a milestone in the field of Volcanology and Ecuadorian geology, information and technical results obtained which are used to safeguard human lives through respective evacuation alerts. At the provincial level the sectors identi-fied as those most affected by the volcanic phenomenon are those of health, agriculture, environment and tour-ism. However, farmers in the area, especially those who are located around the watershed of the Ambato River, perceive that the most important involvement is the change in rainfall patterns.
The economic losses in the local systems of production, the limited availability of water resources and the greater conflict by the use of water, are the main consequences of the variation of rainfall patterns due to the eruptive process of the Tungurahua volcano. In this sense it is essential to provide technical information and ap-propriate models of analysis and local forecast, with parameters that identify unique phenomena such as a vol-canic eruption that may alter the homogeneity of the time series of rain in the short term, and contribution to de-cision-making on behalf of the affected population.
2. Background
Various studies and research on the variability of local rainfall conclude that understanding complex phenomena depend mainly on the weather, wind, temperature and atmospheric pressure, and therefore rainfall presents high variability both in time and in space.
Additionally, in various areas of the planet, occur natural phenomena such as volcanic eruptions, which have an impact on changes and climate variability. Some researches and publications suggest that after large world-wide volcanic eruptions and over extended periods of time warming phenomena occur in the stratosphere of up to 2˚C with respect to the average. While in the troposphere and in the Earth’s surface of 0.2˚C - 0.6˚C, cooling processes occur mainly during the summer of the first three years after the eruption [2][3]. In relation to the ef-fects of a volcanic eruption on rainfall there is on enough information, it is known from three-dimensional si-mulations performed in the Goddard Institute for space studies of NASA, that global precipitation is suffering decreases during the first two years after volcanic eruptions [2][4].
In this context, the volcanic eruptive events produce effects on the climate and particularly temperature. In recent years, large investments have been made in the development of studies and research which contribute with ideas and proposals for the mitigation of the rapid, uncontrolled warming at the Earth’s surface, as result arises as an option the artificial modification of the weather conditions on the planet with the creation of artifi-cial volcanoes that simulate the effects that produce volcanic eruptions to artifiartifi-cially cool the Earth.
The present study demonstrates that at the level of watershed, a volcanic eruption produces an imbalance in local rainfall and consequently in the hydrological cycle, causing problems and uncertainty in planning and in-tegrated management of water resources.
3. Description of the Study Area
The province of Tungurahua is located in the central area of Ecuador (Figure 1), with an approximate area of 3.335 Km2, covers part of the Andean Valley and West and East Chain Mountain, which includes the Tungura-hua volcano and the snowcapped CariTungura-huairazo and Chimborazo [5].
The watershed of the Ambato River, located to the northeast of the province, in the western chain mountain, with an extension of 1.317 Km2, has an average temperature of 12.5˚C, July records less rainfall with a mean value 48 mm, while April with average values of 86, 67 mm is the month of greatest precipitation [5].
Figure 1. Geographical location ambato river watershed [5].
Figure 2. Eruptive events Tungurahua volcano year 2006 [7].
1999, the volcano began an explosive eruptive period with alternating phases of high volcanic activity, characte-rized by strong emissions of gas and ash, blasts type canon and episodes of fountain of lava, with low activity phases represented by weak emissions of steam and ash, and phases of complete tranquility Figure 2.
This research considers the main events of the eruptive volcano with large injections of tephra (ash and gravel) and SO2 into the atmosphere, since its composition affect the Earth radiative balance and climate. Bustillos
study [7], establishes important periods include: April-December 2007, January 2008, December 2008-February 2009, January 2010, May to June 2010.
(a)
(c)
[image:5.595.127.503.83.694.2](d)
load of ash with a speed of dispersion that lower than the speed of the wind, affecting mainly the south, center and east areas of the watershed.
Volcanic eruptions are measured through the volcanic explosivity index (VEI), which uses a scale of 0 - 8 to describe the volume and height of the plume of the eruption [9].
4. Methodology
Initially the methodology establishes to identify the period of study analysis considering the stage of the eruptive process of the volcano and its major explosive events. With the data of precipitation, the series are built and ex-ploratory analysis is done that allows an understanding the historical time series of precipitation. Tests of ho-mogeneity and consistency indicated that the statistical period of analysis is consistent and series are reliable. Analysis for the detection of outliers in order to find patterns of data that do not fit the expected behavior, the statistical test of Tukey, known as box plots that is a representative graph of data set distributions. It is used in its construction five descriptive measures: median, first quartile (Q1), third quartile (Q3), the maximum value and the minimum value.
Change detection analysis begins with the verification of the occurrence of changes in the data set, therefore we use analysis techniques with parametric and non-parametric tests, the first used methods based on data that require many assumptions and are sensitive to outliers, while the non-parametric tests using procedures based on a range that they require less assumptions and are less sensitive to outliers [10]. The tests used are:
4.1. Rank Sum Test
This is one of the frequently used powerful non-parametric test to detect the change point. This test developed by Wilcoxon (1945), is used to detect sudden changes in median [11].
(
1 2)
1 1 2 w n n n
µ
= + + (1)The standard error mean (SEM) of the sampling distribution of rank sums;
(
)
1 2 1 2 1
12
n n n n
SEM = + + (2)
where n1 is number of samples of smaller rank sum and n2 is number of sample of higher rank sum. In this test,
minimum 25 is the sufficient sample size to use existing tables for normal distribution to test the hypothesis. Test statistic z will be calculated as follows:
w W z SEM
µ
−= (3)
where W is smaller of the two rank sums.
4.2. Likelihood Ratio Test
This method test whether the means in two parts of a record are different for an unknown time of change. This test had been developed by Hawkins (1977) and Worsley (1979).
Suppose that X = X X1, 2,,Xn is a sequence of random variables. Mean of first k observations denoted by
k
X and the mean of last n−k observations by Xk′. Sum of the squares of observations difference for a group split at k is given by:
(
)
22 1
k
k i i k
S =
∑
= X −X (4)The sum of squares between the groups given by:
(
)
(
)
22
, 1, , 1
k k k
k n k
T X X
n k= n
−
′
= − − (5)
2 2
n
S =S (6)
To get test statistic:
1
max k , 1 1
V T k n
S
= ≤ ≤ − (7)
Since test static is given by:
(
)
2 2 1 V n W V − =− (8)
Analysis of changes of tendencies, which are those changes that occur gradually over time, is conducted using the Mann-Kendall test, in the set of data before and after the change, if a significant trend is detected, it is as-sumed that the trend will continue in the future.
4.3. Mann-Kendall Test
Mann-Kendall test is a non-parametric test for identifying trends in time series data [12]. This test compares the relative magnitudes of data rather than the data values themselves (Gilbert, 1987). One of the benefits of this test is that the data need not to confirm to any particular distribution. Moreover, data reported as non-detects can be included by assigning them a common value that is smaller than the smallest measured value in the data test. This test assumes that there exists only one data value for a time period. When multiple data points exist for a single time period, the median value will be used.
The data values are evaluated as ordered time series. Each data value is compared to all subsequent data val-ues. The initial of the Mann-Kendall statistic S is assumed to be 0. If a data value from a later time period is higher than a data value from an earlier time period, S is increased by 1. On the other hand, if the data value from the later time period is lower than a data valued sampled earlier, is decreased by 1. The net result of incre-ments and decreincre-ments yields the final value of S.
Let x x x1, 2, 3,,xn represent n data points, then the Mann-Kendall test statist S is given by;
(
)
1
1 1sgn
n n
j i i j i
S=
∑ ∑
=− = + x −x (9)where xj are the sequential data values, n is the length of the data set and,
(
)
1 if 0sgn 0 if 0
1 if 0
j i
j i j i
j i
x x
x x x x
x x
− >
− = − =
− − <
(10)
The standardized test statistic Z is computed by
( )
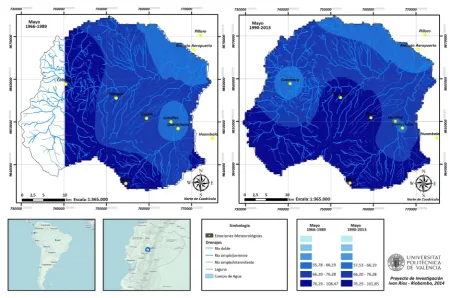
1 , 0 0, 0 1 , 0 ( ) S S Var S Z S S S Var S − > = = + < (11)The inverse distance method (IDW) is used to model the behavior of precipitation, the spatial interpolation can estimate rainfall in places where there are no records of rainfall using data from precipitation of nearby sta-tions. The accuracy of interpolation is in direct ratio of the distance from the known station and the point where you want to create Figure 6, Figure 9, Figure 11.
5. Discussion
5.1. Analysis of Rainfall
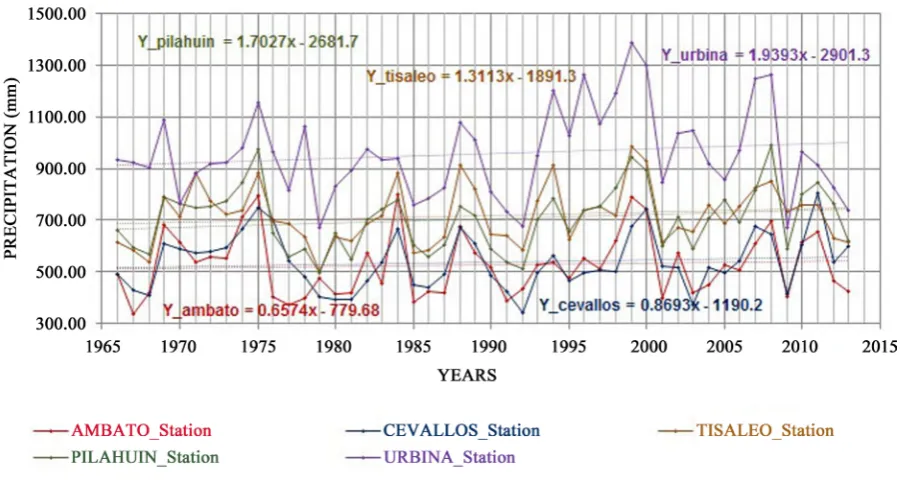
Figure 4 shows the annual rainfall at five weather stations. Ambato station is located to the northeast of the tershed a distance of 32.73 Km of the volcano, Cevallos and Tisaleo stations are located on the east of the wa-tershed at a distance of 23.40 Km, 28.88 Km and 21.31 Km to the volcano respectively, the Pilahuin station in the center of the watershed at a distance of 37.57 Km to the volcano, and Urbina station is located in the South of the watershed at a distance of 25.52 Km to the volcano. Two sub-periods for the analysis, based on the revival of the Tungurahua volcano, the sub-period-1 among 1966-1989 without eruptive event and a sub-period-2 among 1990-2013 with the eruptive process are established.
5.2. Analysis of the Annual Variability
An initial exploratory analysis was performed through the graphing time series of precipitation and obtaining descriptive statistics of annual average rainfall, for trends and changes in the series. Annual mean precipitation values are between 528.23 mm at Ambato station and 956.90 mm for station Urbina, corresponding to a dry- humid in the Andean region climate zone.
Measures of central tendency as variability and form of the series of annual precipitation, indicate that the samples come from a normal distribution, standard deviation values are between 1051 and 1.66 in the range −2 to +2, therefore there is no significant deviations from normality, this result is consistent with that obtained in statistical tests of Shapiro Wilk.
It is interesting to note that all stations located in the watershed are registered maximum rainfall between 1999 and 2000; 2006 to 2008; and 2010, 2011, years in which occurs a high volcanic activity of Tungurahua.
Analysis of precipitation data at weather stations for the period 1966-2013, shown in Figure 4, we can ob-serve that in North-East of the watershed station Ambato M-066 the range maximum precipitation occurred in 1984, when it reached a value of 801.30 mm, the rain next year was 1999, when it reached 792.10 mm, while the driest year was 1967 with 335.10 mm.
[image:8.595.90.542.466.706.2]In the East of the watershed, station Cevallos M-0128 for the analyzed period the maximum value of precipi-tation was 803.80 mm, in the year 2011, the rainier next year was 2000, with rainfall which reached 745.20 mm, the year 1992 was the driest with 344.60 mm. For station Tisaleo M-0377, maximum series precipitation was
recorded in the year 1999, which it reached a value of 983.70 mm, the following rainier year was 2000, which reached 927.80 mm, while the driest year was 1979, with 503.10 mm.
In the center of the watershed station Pilahuin M-0376 recorded maximum rainfall in 2008 which recorded 989.50 mm, in 1999 it scored a rainfall of 943.30 mm, by partner the year that recorded the minimum rainfall amounts was 1979 with 497.20 mm.
To the South of the watershed, the station Urbina M-0390, registers for the period analyzed an average of 956, 90 mm, the maximum precipitation occurred in the year 1999 which recorded 1384.80 mm, the next rainier year was 2000, it scored a value of 1298.20 mm, the year that recorded a minimum of precipitation amounts was 1979, which scored a value of 672.20 mm followed by the year 2009, which registered a value of 672.59 mm.
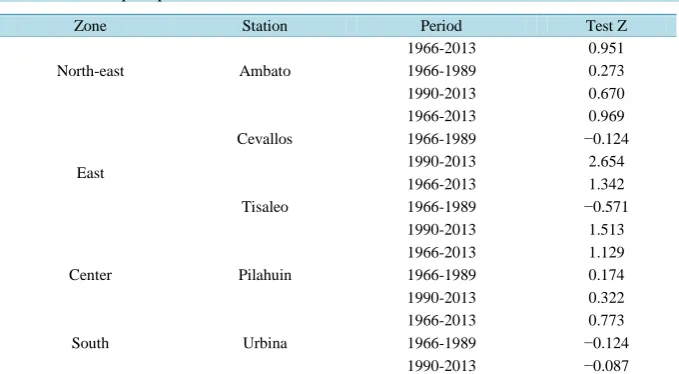
For the time periods listed in Table 1, using the Mann-Kendall method Equation (10), did not detects any sig-nificant positive trends in media annual precipitation in all stations of study. South of the watershed in the sta-tion Urbina identifies for the second sub-period a negative trend in the rainfall annual average.
[image:9.595.144.484.262.449.2]In Figure 5, we can see that for the second sub-period, in the center, east and south of the watershed, no
Table 1. Annual precipitation trends.
Zone Station Period Test Z
North-east Ambato
1966-2013 0.951
1966-1989 0.273
1990-2013 0.670
East
Cevallos
1966-2013 0.969
1966-1989 −0.124
1990-2013 2.654
Tisaleo
1966-2013 1.342
1966-1989 −0.571
1990-2013 1.513
Center Pilahuin
1966-2013 1.129
1966-1989 0.174
1990-2013 0.322
South Urbina
1966-2013 0.773
1966-1989 −0.124
[image:9.595.154.472.349.696.2]1990-2013 −0.087
Figure 6. Precipitation watershed Ambato river sub-period 1 (1966-1989) and sub-period 2 (1990-2013).
significant change points of the series occur in the years 1992 and 1998, which correspond to the initial eruptive and explosive process of the Tungurahua volcano, the average precipitation among the years 1993-2013, is higher than the average rainfall among the years 1966-1993.
In Figure 6, we can observe that in general the average annual rainfall in the watershed of the Ambato River presents a positive trend. In the North-East of the watershed where the Ambato station is located there is no vis-ible major changes in the patterns of precipitation between the sub-periods, the average stays between 579.85 mm and 670.57 mm in central and eastern parts of the watershed can be observed increases in precipitation for the second sub-period in values ranging from 852.04 mm to 1013.39 mm. However, it is interesting to note that while all weather stations for the tendency of rain increases in the second sub-period, station Urbina located to the South of the watershed, after the events of the years 1999; 2000; 2008; and 2010, the trend of precipitation according to the relevant statistics is negative.
For the second sub-period in presence of the volcano eruptive process, can be seen in Figure 7 the effects on surface temperature with decreases ranging from 0.3˚C to 0.6˚C for the Ambato station, between 0.32˚C to 0.61˚C to station Cevallos, in the years of the main explosive eruptive events of the volcano. This analysis indi-cates that during the second sub-period, there are events that produce anomalies in the behavior of precipitation in the watershed, generating some significant increases in specific cases and at other times decreases or down-ward trends. It’s interesting the coincidence of these moments with the eruptive process of the Tungurahua vol-cano especially in the initial phase of the years 1993-1998 and then in the explosive phase particularly in the years 1999; 2000; 2008; 2010 and 2011, in which are recorded decreases in surface temperature and specific precipitation increases.
5.3. Analysis of the Variability of Precipitation per Month
Figure 7.Anomalies in the surface temperature in the eruptive explosive events of tungurahua.
(a)
(c)
[image:12.595.92.537.313.534.2]Figure 8. (a) Monthly precipitation station Ambato; (b) Monthly precipitation station Cevallos Tisaleo Pilahuin; (c) Monthly precipitation station Urbina.
Table 2. Months with significant changes in the series of precipitation watershed Ambato river.
Zone Station Period Months
Trend Media Median
North-east Ambato
Per Dec Dec Dec
Sub1 Jun
Sub2 Dec Dec
East
Cevallos
Per Abr, Dec Apr, Dec Apr, Dec
Sub1 Jun
Sub2 Apr, Dec Apr, Jul, Sep, Dec Apr
Tisaleo
Per Apr Apr Apr
Sub1 Jun
Sub2 Apr Apr, Jul, Sep, Dec Apr
Center Pilahuin
Per Apr, May Apr Apr
Sub1
Sub2 Apr, Jul Apr, Jul Apr, Jul
South Urbina
Per Dec Dec Dec
Sub1
Sub2 Jan, Mar, May, Dec Jan, Mar, May, July, Dec Mar
Per = historic period 1966-2013; Sub1 = first sub-period 1966-1989; Sub2 = second sub-period 1989-2013; Jan = January; Mar = March; Apr = April; May = May; Jun = June; Jul = July; Sep. = September; Dic = December.
variations. That is why it is essential to establish a more specific analysis at monthly level, identifying the changes that effect the volcanic.
At stations located in different parts of the watershed Figures 8(a)-(c), can be seen clearly atypical annota-tions of precipitation occurring at times of major explosive erupannota-tions of the volcano Tungurahua occurred in May 2000, with a VEI = 3 Volcanic Explosivity Index [7]. In the Centre and East of the watershed is observed values atypical of precipitation in May and December of 2010 with a VEI = 2 Volcanic Explosivity Index [7].
Table 2 shows the changes described in the monthly precipitation series. In the sub-period 2 which occurs the eruptions of the Tungurahua volcano we see the most significant changes in precipitation in the months of April, May, September and December.
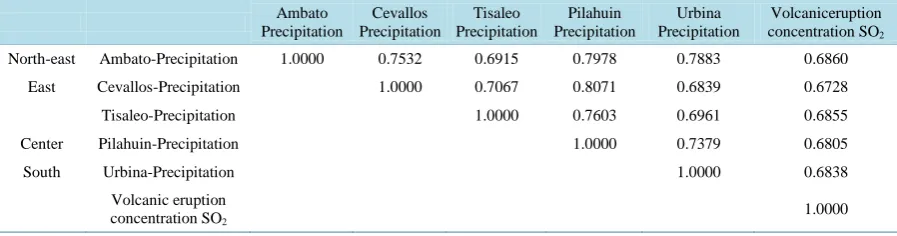
Table 3 describes the correlation between precipitation and the concentration of SO2 in the eruptive process
Table 3. Correlation precipitation and eruption volcano Tungurahua. Ambato Precipitation Cevallos Precipitation Tisaleo Precipitation Pilahuin Precipitation Urbina Precipitation Volcaniceruption concentration SO2
North-east Ambato-Precipitation 1.0000 0.7532 0.6915 0.7978 0.7883 0.6860
East Cevallos-Precipitation 1.0000 0.7067 0.8071 0.6839 0.6728
Tisaleo-Precipitation 1.0000 0.7603 0.6961 0.6855
Center Pilahuin-Precipitation 1.0000 0.7379 0.6805
South Urbina-Precipitation 1.0000 0.6838
Volcanic eruption concentration SO2
1.0000
Table 4. Statistics precipitation May.
Trend Media Median
Zone Station Period Test Z Test W Test z
North -east Ambato
1966-2013 0.427 2.065 0.258
1966-1989 1.662 2.561 −1.184
1990-2013 0.174 1.170 −0.087
East
Cevallos
1966-2013 1.022 1.779 0.052
1966-1989 1.406 2.967 −1.068
1990-2013 0.322 1.275 0.202
Tisaleo
1966-2013 1.40 2.678 −1.227
1966-1989 1.654 2.210 −1.76
1990-2013 1.116 1.266 −1.01
Center Pilahuin
1966-2013 1.970* 2.465 −1.474
1966-1989 1.91 2.738 −0.837
1990-2013 −0.074 1.190 0.664
South Urbina
1966-2013 1.093 2.315 −0.588
1966-1989 1.139 2.451 −1.140
1990-2013 −1.972* 3.372* 1.280
*Significant value.
In the month of May can be seen in Table 4, significant changes are detected in trend with a level α = 0, 10 in precipitation patterns in the middle of the watershed for the historical period and in the South of the watershed to the second sub-period. Changes of precipitation series points are recorded in the years 1999 and 2000.
In this month historically occurs the highest levels of precipitation in the area of study, in Figure 9 we see in-creases in precipitation in all the watershed, mainly in the Centre with 16.99% and in the East with values of 12.40% for the second sub-period with regard to the first, mainly due to atypical values recorded during May of the year 2000. This year the volcanic activity is maintained at high levels in a sustained manner and occurs in May 2011 in a revival of the volcanic activity which has 77 explosions and 432 seismic signals associated with ash emissions reaching heights between 1.5 and 2 kilometers above the crater of the volcano. The ash clouds are dissipated by the winds mainly East and South of the watershed and lower occurrence the north-east.
The statistical analysis of the comments shows that trends in all seasons are decreasing for the second sub-period. In the South the station Urbina register significant negative trends.
The North-East of the watershed Ambato, the station registers trends ranging from 1.51 mm/year to 0.08 mm/year, in this season in May of the year 2000 recorded a rainfall value of 215.60 mm/year, Figure 10, atypi-cal in the historiatypi-cal series.
[image:13.595.90.540.240.489.2]Figure 9. Behavior precipitation May sub-periods.
[image:14.595.145.499.403.674.2]BOX PLOT MAY
Figure 10. Atypical values precipitation May.
137.48 mm/year in 1998.
In the South of the watershed, the Urbina station records trends with values ranging from 3.71 mm per year for the first sub-period to −2.19 mm per year for the second sub-period, outliers are recorded with values of 349.70 mm/year in the year 2000 and 179.90 mm/year in 1998.
May is considered historically the month with more precipitation in the study area, however the results ob-tained in this research is evident for the second sub-period a decreasing trend of rain recorded at all stations of the watershed, is therefore the results obtained in this research it is shown for the second sub period a tendency of decreasing trend of rain in all the stations , then it is proven the historic modifying of the factors of precipita-tion in this month after the main eruptive moments of the Tungurahua volcano.
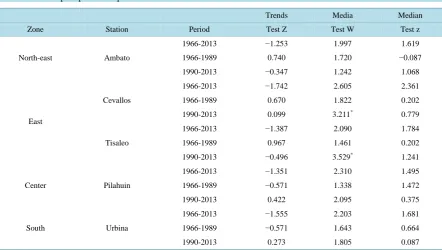
In September, changes in precipitation patterns are statistical significant with a confidence level of 90% on average of precipitation in the east of the watershed for the second sub-period, as shown in Table 5. This month change points of the series of precipitation occur mainly the years 1986 to 1989 belonging to the first sub-period.
Maximum rainfall is recorded in the first sub-period. The second sub-period all weather stations of the wa-tershed detect decreases in rainfall, in the north-east trends present values that reach −0.25 mm/year, in the east the trends marked reductions with records coming to −0.45 mm/year. Precipitation values correspond to dry stages and are concentrated in the first and second quintile.
This month we can see in Figure 11 that deepens a constant in all the watershed dry stage for the second pe-riod.
In the north-east the decrease of precipitation of the second period with regard to the first 37.36%, in the cen-ter and east, where the values come 40.03% and in the South to 22.00%. It is incen-teresting to note that outliers of rain is recorded in the year 1984, 1999, and 1973 Figure 12 in all seasons. In 1999, beginning of the explosive eruptive process of the Tungurahua volcano, a timely increase in local rain is confirmed in all the watershed, however, downward trends of precipitation recorded by stations located in the study area is detected immediate-ly.
From the results we can conclude that one the most important effects of the eruptive process of the Tungura-hua volcano, is the modification of patterns of rain for the month of September which is the driest month in the watershed.
[image:15.595.94.537.457.707.2]In the month of December we also found changes in rainfall patterns that are associated with the eruptive process of the Tungurahua volcano Table 6, in all the watershed selected stations recorded significant positive
Table 5. Statistics precipitation September.
Trends Media Median
Zone Station Period Test Z Test W Test z
North-east Ambato
1966-2013 −1.253 1.997 1.619
1966-1989 0.740 1.720 −0.087
1990-2013 −0.347 1.242 1.068
East
Cevallos
1966-2013 −1.742 2.605 2.361
1966-1989 0.670 1.822 0.202
1990-2013 0.099 3.211* 0.779
Tisaleo
1966-2013 −1.387 2.090 1.784
1966-1989 0.967 1.461 0.202
1990-2013 −0.496 3.529* 1.241
Center Pilahuin
1966-2013 −1.351 2.310 1.495
1966-1989 −0.571 1.338 1.472
1990-2013 0.422 2.095 0.375
South Urbina
1966-2013 −1.555 2.203 1.681
1966-1989 −0.571 1.643 0.664
1990-2013 0.273 1.805 0.087
*
Figure 11. Behavior precipitation September sub-periods.
BOX PLOT SEPTEMBER
Figure 12. Atypical values precipitation September.
[image:16.595.129.501.410.662.2]Table 6. Statistics precipitation of December.
Trend Media Median
Sector Station Period Test Z Test W Test z
North-east Ambato
1966-2013 2.231* 3.234* −2.175*
1966-1989 −0.571 2.481 0.491
1990-2013 1.97* 2.084 −1.81*
East
Cevallos
1966-2013 1.96* 3.481* −2.01*
1966-1989 −1.215 1.12 1.63
1990-2013 1.97* 3.26* −1.18
Tisaleo
1966-2013 0.356 2.12 −1.186
1966-1989 −1.439 2.199 0.722
1990-2013 −0.322 3.279* 0.202
Center Pilahuin
1966-2013 1.609 3.17* −2.423*
1966-1989 −1.257 2.686 1.45
1990-2013 0.967 2.332 −0.26
South Urbina
1966-2013 1.98* 3.17* −2.97*
1966-1989 −1.067 2.269 0.722
1990-2013 1.96* 3.136* −2.915*
*
Significant value.
Figure 13.Behavior precipitation December sub-periods.
[image:17.595.81.547.138.658.2]BOX PLOT DECEMBER
Figure 14. Atypical values precipitation December.
of 1999 and 2005 respectively that they coincide with the stage of high eruptive activity, mainly characterized by emissions of steam, gases and variable content of volcanic ash. Columns of emission are found between 1500 and 2500 meters above the level of the summit, the winds have a W and SW orientation, ash emissions were at almost all times associated with bellows type turbine in low and medium intensity. In this sector, the trends are positive significant α = 0.10 with value of 1.58 mm per year for the second sub-period.
In the center of the watershed average rainfall increases reflect 40.40% the second sub-period with respect to the first. Station Pilahuin located in this sector recorded, as for the north-east, values atypical of rain in Decem-ber of the years 1999, 2005 and 2011. East of the watershed average rainfall increases show a value of 42.25% the second sub-period with regard to the first, the trends are positive significant with a confidence level of 90% with values 1.39 mm/year. Stations Cevallos and Tisaleo located in this zone recorded outliers of rain in De-cember of the years 1999 and 2005.
In the South, the average rainfall presents a 38.84 percent increase. The trends are positive significant for an α = 0.10 with a value of 1.95 mm per year for the second sub-period to a value of −1.44 mm per year for the first sub-period. In this part of the study is recorded an outlier rainfall 208.50 mm in 1999. December historically is a dry month in which occurs a period known as the “Indian summer of the child”, however, by the results obtained in this study you can check that the Tungurahua volcano eruptive process modifies time and temporarily monthly rainfall amounts, in anticipation of the rainy season in the area of study that generally starts in the month of January.
6. Conclusions
In the watershed of the Ambato River changes occur in precipitation patterns during the eruptive process of the Tungurahua volcano. These changes are related to the intensity of the eruption and the orientation of the plume of ash, in the north-east of the watershed, changes in rainfall are smaller in relation to which occurs in the south- east, where the ash content is concentrated by the direction of the wind.
Major modifications with increases in rainfall amounts that occurred for the second sub-period regarding the first sub-period with values reaching 50.19% are recorded in December; whereas the months of July and Sep-tember recorded significant decreases with values of −17.02% and −40.03% respectively. It is concluded that in the basin of the Ambato River the eruptions of the Tungurahua volcano with an index of explosiveness (VEI) equal to or greater than 2 produce increases in precipitation.
average number of observations of the period studied rain are recorded. However, in the months since the erup-tive events occur rainfall that are maintained in the medium term with values reaching −95% and −83.30%, in the north-east and south-east of the watershed. The Tungurahua volcano eruptive episodes associated with cool-ing of the Earth’s surface recorded by stations located in the north and east central of the watershed, with de-creases in temperature reaching −1.10˚C with respect to the average of the period of study considering an ap-proximate area of 1300 km2 where this effect occurs.
The cooling that occurs in the area of influence of the volcano, is one of the effects that attract greater interest in the scientific community, because the results could provide data to consider alternatives to mitigate global warming, such as the proposal to experiment with artificial volcanoes. However, its consequences could be cata-strophic in relation to effects on rainfall and the water cycle. This observed situation corresponds to the analysis of data in the watershed of the Ambato River, it is therefore difficult to specify if the variability of precipitation or decrease in surface temperature by volcano eruption occurs only at the local level and if the effects are ho-mogeneous in watersheds of the region or if they come to affect continental and global level. Therefore it is ne-cessary to extend such studies in the area of influence of the Tungurahua volcano.
The final conclusion of this research is that even we do not know enough different factors that make up the climate to be able to explain the climate change.
References
[1] Fontaine, G., Narváez, I. and Cisneros, P. (2008) Informe sobre el estado del medio ambiente. Flacso, GeoEcuador, Quito, 110-126.
[2] Robock, A. (2000) Volcanic Eruptions and Climate. Reviews of Geophysics, 38, 191-219. http://dx.doi.org/10.1029/1998RG000054
[3] Dricoll, S., Bozzo, A., Gray, L., Robock, A. and Stenchikov, G. (2012) Coupled Model Intercomparison Project 5 (CMIP5) Simulations of Climate Following Volcanic Eruptions. Submited J. Geophys Res.
[4] Halmer, M. and Schmincker, H. (2003) The Impact of Moderate-Scale Explosive Eruptions on Stratospheric Gas Injec-tions. Bulletin of Volcanology, 65, 433-440,http://dx.doi.org/10.1007/s00445-002-0270-x
[5] Consejo Provincial de Tungurahua (2007) Manejo Ecológicamente Compatible de las Cuencas del Tungurahua Amba-to 115 p.
[6] Samaniego, P. (2005) Los peligros volcánicos asociados con el Tungurahua. Quito. Corporación Editora Nacional. [7] Bustillos, J. (2011) Volcán Tungurahua: Tamaño de las Erupciones Explosivas. Memorias de las 7mas Jornadas en
Ciencia de la Tierra, I Encuentro sobre Riesgos y Desastres. EPN. Instituto Geofísico, Quito.
[8] Trocoso, L., Pennec, J., Java, D. and Vallee, A. (2006) Depósito de caída de ceniza producidos durante las erupciones del volcán Tungurahua 14 de julio y 16 de de agosto de 2006. Quito, InstitutoGeofísico, EPN, 3-5.
[9] Pyle, D. (2000) Size of Volcanic Eruption. Encyclopedia of Volcanoes. Academy Press, San Diego, Part II, 263-269. [10] Hamed, K. (2008) Trend Detection in Hydrologic Data: The Mann-Kendall Trend Test under the Scaling Hypothesis.
Journal of Hydrology, 349, 350-363. http://dx.doi.org/10.1016/j.jhydrol.2007.11.009 [11] Ikewelugo, A. (2012) Modified Wilcoxon Signed-Rank Test. Journal of Statistics, 2, 172-176.
![Figure 1. Geographical location ambato river watershed [5].](https://thumb-us.123doks.com/thumbv2/123dok_us/8057384.775487/3.595.73.541.80.581/figure-geographical-location-ambato-river-watershed.webp)
![Figure 3. Isopacas of ash. (a) Eruption July 1999 [7]; (b) Eruption 14 July and 16 August 2006 [8]; (c) Eruption April-December 2007 [7]; (d) Eruption January-May 2010 [7]](https://thumb-us.123doks.com/thumbv2/123dok_us/8057384.775487/5.595.127.503.83.694/figure-isopacas-eruption-eruption-eruption-december-eruption-january.webp)