Development of an Approach for
Analyzing Supply Chain Complexity
Blecker, Thorsten and Kersten, Wolfgang and Meyer,
Christian
Hamburg University of Technology
2005
Online at
https://mpra.ub.uni-muenchen.de/5284/
1
Supply Chain Complexity
Thorsten Blecker, Wolfgang Kersten, Christian M. Meyer
Abstract
Supply chains are faced with a rising complexity of products, structures, and processes. Because of the strong link between a supply chain’s complexity and its efficiency the supply chain complexity management becomes a major challenge of today’s business management. A two dimensional driver concept is introduced and explained to comprehend the major causes of a supply chains’ complexity. To map the effects of the drivers and to understand the different dimensions of complexity, a general complexity model is introduced. A supply chain complexity analysis approach is presented, to evaluate the initial situation and to provide the necessary information for deriving the right actions and strategies for the management of complexity within a supply chain.
Keywords
complexity, supply chain, variety, model
Introduction
Mass customization is based on the concept of manufacturing individual products to almost mass producing costs. This induces a high level of complexity in structures and processes, especially in a supply chain due to raising diversities in the production program and the configuration (Blecker, Abdelkafi, Kaluza & Kreutler 2004). In addition to this, the market conditions have changed. The competition among enterprises has evolved to competition among supply chains. As a result, the efficiency of a single supply chain or a whole supply network becomes more and more important to operate successfully within this environment.
Today supply chains are suffering from a high complexity, which is due to several causes, such as customer tailored and elaborate products, global procurement and distribution, or technological innovations. Besides a raising complexity in the structures and processes of the manufacturer itself, also the whole supply chain is infected by this complexness. Because of the direct link between the efficiency and the complexity of a supply chain, complexity management becomes a major task of today’s business management.
The aim of this paper is to provide a detailed overview of supply chain complexity, the major causes and effects, and concepts to assess it. Therefore, the paper is presenting a general introduction to complexity, which is afterwards strongly concentrating on supply chain complexity. Following, the drivers and effects of a supply chain’s complexity are outlined.
2
Referring to these causes and its consequences, a general complexity model is introduced, which is briefly explained and tailored to the usage within a supply chain. To derive adequate and efficient complexity management strategies, a brief analysis and evaluation of the initial situation is necessary. Therefore, an introduction to supply chain complexity measuring and analysis is given. A complexity analysis approach is presented for providing a method to evaluate the initial situation and to offer the necessary information for deriving the right actions and strategies for complexity management. The approach is following a three step concept and is strongly based on the aim to keep the effort for collecting, preparing, and analyzing the data to an inalienable minimum.
Background
A strikingly often usage of the term “complexity” can be observed in the recent years’ literature. Nearly every system which does not behave in any way simple or deterministic is called a complex system. This interpretation satisfies the fundamental principle of complexity just partially. Research in complexity is a multi-dimensional and a multi-disciplinal project. A lot of different disciplines, including e.g. system theory, cybernetics, chaos theory, or information theory, are performing research on complex systems by following quite different objectives. Because of this, there is neither a common definition nor a congruent interpretation of complexity. Referring to its fundamental perception, almost every discipline has developed its own interpretation and definition of complexity (Blecker, Friedrich, Kaluza, Abdelkafi & Kreutler 2005).
With regard to distinct objectives, different views on the term “complexity” can be expedient. Within this paper for the analysis and modelling part a system theoretic view is taken. From this perspective, complexity is generally defined as a system’s attribute, which is constituted by its intrinsic nature to adapt to several different states within a short time frame, in relation to its environment (Hub 1994). In a closer definition, taking into account the measurability and the descriptiveness of a system, it is determined by the amount and the nature of the connections between the single elements of the system (Luhmann 1980). Designing complexity means modifying these elements. To interpret the results in a business oriented view a more descriptive sight is adequate. Therefore complexity can be interpreted as the variety in objects, structures and processes (Kersten 2001). Such as a manufacturer, producing a huge number of diverse product variants can be characterized more complex than one producing a uniform product in a lower quantity.
The complexity can further be divided into an internal and an external part to differentiate its origin. With regard to the example, the complexity which is visible in structures, elements, and processes of the manufacturing area is called the internal complexity. Contrary to this, the external complexity covers all possible complexities a company is faced with from external, like for instance specific and individual customer demands, technological innovations, or the economic development in general. The internal complexity can be influenced and managed by the company, while the external complexity can be seen as widely dedicated and fixed.
3
Supply Chain Complexity Drivers and Effects
KEY
D
RIVER C
AT
EG
O
RIES
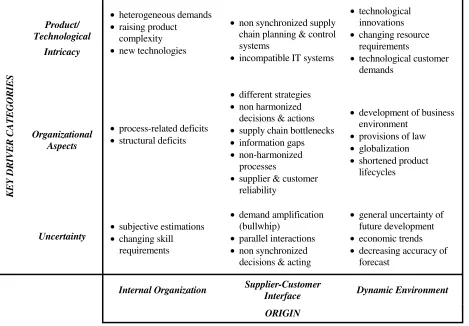
In the majority of cases, supply chains are operating in a dynamic environment and at an interface between different companies. Therefore, the supply chain is faced with a huge number of different complexity drivers from diverse sources. A systematic arrangement is necessary to systematically delineate the single complexity causes. The aim of this chapter is to provide an overview of the different types of complexity drivers and their point of origin. Therefore, as shown in table 1, a two dimensional approach is used.
The first dimension is facing the origin of the driver and is represented by the columns of table1. Complexity can be generated internally within a company, in cooperation with others, or as a result of its environmental complexity. Therefore, the first dimension is divided into three sections “Internal Organization”, “Supplier-Customer Interface”, and “Dynamic Environment” and is thus mapping the major complexity causing areas.
• heterogeneous demands • technological
• raising product • non synchronized supply innovations
Product/
complexity chain planning & control • changing resource
requirements
Technological
• new technologies systems
Intricacy
• incompatible IT systems • technological customer
demands
• different strategies • non harmonized
• development of business
decisions & actions
environment
• process-related deficits • supply chain bottlenecks
• provisions of law
Organizational
• structural deficits • information gaps
Aspects • globalization
• non-harmonized
• shortened product
processes
lifecycles
• supplier & customer
reliability
• demand amplification • general uncertainty of • subjective estimations (bullwhip) future development
Uncertainty • changing skill • parallel interactions • economic trends
requirements • non synchronized • decreasing accuracy of
decisions & acting forecast
Internal Organization Supplier-Customer Dynamic Environment
Interface
[image:4.595.87.556.256.582.2]ORIGIN
Table 1: Supply Chain Complexity Causes
All complexity drivers, which are related to the generation of complexity within a single company due to the product or technological causes, are grouped within the constellations of “product/technological intricacy” and “Internal Organization”. The first complexity driver is called “heterogeneous demands” and is responsible for a lot of complexity impacts within the company and the whole supply chain. Customers tend to require a more and more customized product, which is tailored and best fitted to their individual needs (Wildemann 1999, Kirchhoff 2003). This trend leads to voluminous product programmes, including a huge number of different product variants, all of which have to be coordinated in the sales and engineering department. Because of its severe impact, the complex product structure itself can be identified as another complexity driver (Kirchhoff 2003, Benett 1999). Complex and extensive product structures are composed of a huge number of parts and subassemblies and therefore directly involve complex structures and processes within the manufacturing. A huge variety in parts and assemblies requires a huge effort for planning and scheduling, the coordination, and also in the materials management (Kestel 1995, Westphal 2000). The manufacturing process also becomes more complex due to frequently changing production orders. This leads to changing resource requirements and raising cycle times (Suttrop 1999, Benett 1999). Another complexity driver within this category can be identified by the ongoing technological development of product and production technologies (Kirchhoff 2003). These innovations cause a constant demand to adapt the product, the production structures, and the processes to the actual state of art.
4
Modelling Supply Chain Complexity
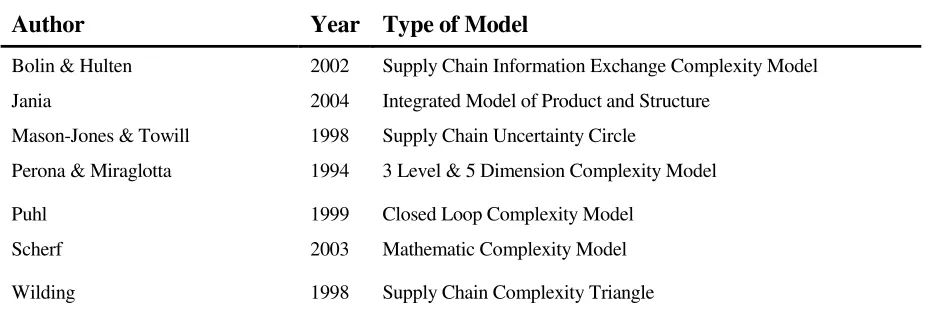
There are several different approaches for modelling a system’s complexity; table 2 gives an overview of some of these. None of them provides the possibility to map the causes and effects of the complexity of a system with regard to their rank in the subsystem’s hierarchy.
Author Year Type of Model
Bolin & Hulten 2002 Supply Chain Information Exchange Complexity Model
Jania 2004 Integrated Model of Product and Structure
Mason-Jones & Towill 1998 Supply Chain Uncertainty Circle
Perona & Miraglotta 1994 3 Level & 5 Dimension Complexity Model
Puhl 1999 Closed Loop Complexity Model
Scherf 2003 Mathematic Complexity Model
[image:6.595.85.549.159.318.2]Wilding 1998 Supply Chain Complexity Triangle
Table 2: Complexity Modelling Approaches
As a consequence, a general complexity model had to be developed by the authors. This model differentiates itself from others by two essential novelties: A system theoretic view and a closed loop approach. To follow a system oriented view, every system which is faced with complexity can be seen as an arrangement of subsystems on distinct levels (Sage & Armstrong 2000). In relation to the introduction of this paper, the complexity of a system can be differentiated into an internal and an external part, whereas the term “complexity” in this case qualifies the effect of either a single or a certain number of drivers at a distinct system level. The external complexity is caused by an external reason, while the internal complexity is caused by an internal one. Within the model this is included by separated parameters for internal and external complexity drivers.
5
…
l l i l l
envi l
ext I
D E IIa
IIIa E IIIb E IIIz E II D ext I D ext I D ext I D III D III D III D ) , ( ext
I III
IIIb f D D
E =
) , ( ext
I III
IIIz f D D
E =
) , ( ext
I III
IIIa f D D
E =
) , ( ext
I II
IIa f D D
E =
system b
(e. g. manufacturer)
system z
(e. g. customer)
system a
(e. g. supplier)
eve II ma n system eve III subsystems
ronment ( evel I)
int int int int int int int system a (supply chain) int
⎧a11 a12 ... a1r ⎫ E nm= effects matrix, level n, system m
⎪ ⎪ ⎨
⎪ ⎪
⎬ N M
... a2r a21 a22
∑∑
extD n = = external driver matrix, level n Dint
E
= = internal driver matrix, level n
n nm
⎪
⎪⎩ ⎪⎪⎭
... ... ... ...
... a
[image:7.595.95.458.74.355.2]aq1 aq 2 qr n=1 m=1
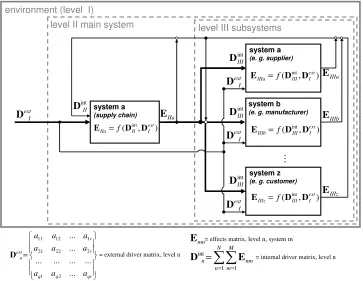
Figure 1: General Complexity Model
Figure 1 shows the complexity model for a three level case. Level 1 is embodying the environment of the considered system and represents the source of the external complexity drivers, which could not be influenced in direct. The second level represents the system in whole, for instance a supply chain. Level 3 includes first stage subsystems, such as suppliers, manufacturers, or customers. Complexity drivers, and the consequences of these, are represented in terms of matrixes. As commented above, the model follows a closed loop approach. Therefore, the complexity drivers are consisting of the direct internal and external causes and of the complexity effects of the own or a different subsystem covering the indirect drivers. Even though, the model’s general intent is to clarify the major relations and dependencies between single drivers and their effects, it could also be applied within a supply chain or a single element of it. Therefore, the proposed model is able to display different levels of detail for investigation. The observed main system could display a whole supply chain, a single member, or even a subsystem of a supply chain’s echelon.
Supply Chain Complexity Measurement
A detailed analysis and assessment of the initial situation is essential to derive adequate and appropriate complexity management strategies and actions. Without an accurate evaluation of the initial situation, misleading conclusions and activities could be chosen, which in consequence can lead to the opposite results. Based on different concepts such as structural or process oriented explorations, a lot of different approaches for analyzing and measuring the complexity of a supply chain have been developed. Beyond these supply chain-oriented concepts, a lot of work has been done in the area of analyzing the complexity of supplier-customer systems as well as manufacturing structures and processes. Some of these methods and techniques could also be successfully applied to a supply chain.
6
defined. Therefore, the complexity of a production system, a supply chain, or a whole company could only be measured in using some sort of help criteria or proxy variable (Luczak & Fricker 1997).
Four major categories can be defined to classify different approaches. The first category contains all approaches which are trying to map a supply chain’s complexity by analyzing the system’s performance or its flexibility (e.g. Beamon 1999; Sethi & Sethi 1990; Das 1996; Gupta & Goyal 1989). Their basic idea is to somehow map the direct connection between a system’s complexity and its flexibility and performance. Within the second category all approaches are grouped, which are somehow using entropy based measures to identify and analyze a supply chains complexity (Frizelle & Woodcock 1994; Sivadasan, Efstathiou, Frizelle, Shirazi & Calinescu 2002; Efstathiou, Calinescu & Blackburn 2002; Bar-Yam 2004). In this application, the entropy is used as a concept for measuring the quantity of information, which is necessary to describe the state of a system. The more complex a system, the more information is needed to definitely specify its current situation. Beneath these two major classes further approaches have been developed, which concentrate on specialized information-theoretical measures or specific analysis concepts. The former ones are represented by conceptions like e.g. the Kolmogorov complexity (Kolmogorov 1965) or the effective complexity (Gell-Mann & Lloyd 2003). The latter ones are using specialized measures and methods which are for instance based on fitness-landscapes (Mc Carthy, Rakotobe-Joel, & Frizelle 2000), specified process analyses (Raufeisen 2003; Büssow 2004), or structural exploration methods (Hartmann 1997; Ernst & Kamrad 2000, Scherf 2003). The last category contains all concepts, which try to somehow map a systems complexity by its cost effects (Bohne 1998, Heina 1992, Kaiser 1995).
Supply Chain Complexity Analysis Concept
To secure the development of a lean and applicable tool, the design phase of the supply chain complexity analysis concept was guided by three basic principles:
1. Reducing the effort for collecting, preparing, and analyzing data to the inalienable
minimum.
2. Taking into account the different system levels and the relations between their
complexity drivers and effects.
3. Consideration of the various types of complexity drivers within a supply chain.
FOCUS ANALYSIS
1.
2.
3.
/ Customer
Whole Supply Chain
(structure)
Supplier
(operations)
Single Company (operations)
-Set up of the complexity model for every operation
-Analysis of the driver matrix
-Analysis of the effects matrix
[image:9.595.107.453.74.264.2]-Interpretation and deduction of managerial implications
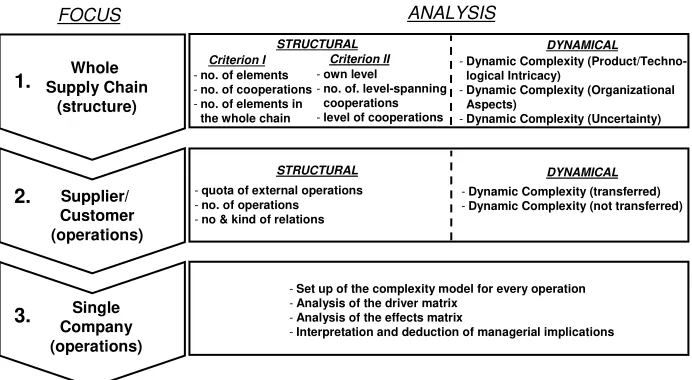
Figure 2: Three Step Analysis Approach
In the first step, a rough consideration of the whole supply chain structure is carried out. The main goal of this step is to identify the areas of high complexity and all supply chain elements which are faced with a high complexity. The second step analyzes more in detail the complexity of the operations of the identified supplier-customer cooperations. A complexity generation and transfer within these operations is therefore assumed and subsequently proofed. The aim of this step is to detect the single complexity generating operations in the chain. In the last step, a detailed intra-corporate analysis of the complexity generating processes within the company is executed to identify the internal and external causes for the high complexity. Following this approach will limit the effort to collect, prepare, and analyze the necessary data to an essential minimum. Although the whole approach is exemplified at a supply chain, it could just as well be used for a supply network because of its underlying general concept.
The main goal of the first step is to locate areas within the supply chain, which show a high complexity and to identify all members, which are directly faced with a high complexity. With regard to the earlier explanations, the complexity can be divided into a structural and a dynamic part. For this Reason, the analysis in step1 is divided into two separate elements. To analyze the structural complexity of the supply chain, two criteria have been defined which combine distinct rations and indexes. The first criterion is analyzing the structure of the whole supply chain and therefore merges three comparative ratios for the number of elements in the whole supply chain, the number of elements which are part of the single cooperation, and the number of cooperations at all. The second criterion is examining the level spanning cooperations. Therefore, it brings three different ratios together for a members own position within the chain, the distance of the level spanning cooperations and the amount of cooperations at all. The dynamic complexity is in most instances not induced by structural causes: It is generated during the fulfilment of operations due to dynamically appearing reasons, such as changes in dates, machine breakdowns, or out-of-stock situations. Because of its good applicability and the very useful results in analyzing the dynamic complexity, this part of the analysis is based on the entropy concept. The entropy was primarily introduced by Shannon (1948) as a measure for the quantity of information, which is necessary to describe a system’s state. Based on Shannon’s concept Frizelle & Woodcock (1994) developed a measure for the dynamic complexity of a production system. Based on a specified number of system states, such as operating “in time”, “late due to reason x”, or “idle” and a number of different resources the probability of being in this state can be computed. Based on this, the entropy of the whole system or separate subsystems can be calculated. This general approach is adapted to analyze the dynamic complexity, by additionally
STRUCTURAL Criterion I Criterion II
-no. of elements -own level
-no. of cooperations -no. of. level-spanning
-no. of elements in cooperations
the whole chain -level of cooperations
DYNAMICAL
-Dynamic Complexity
(Product/Techno-logical Intricacy)
-Dynamic Complexity (Organizational
Aspects)
-Dynamic Complexity (Uncertainty)
STRUCTURAL DYNAMICAL
-quota of external operations -Dynamic Complexity (transferred)
-no. of operations -Dynamic Complexity (not transferred)
taking into consideration the different key driver categories i.e. “Product/Technological Intricacy”, “Organizational Aspects” and “Uncertainty”. Based on this addition the dynamic complexity can be differentiated in three parts referring to their intrinsic key drivers. The results of the analysis are displayed in a spider graph, such as shown in figure 3. This graph provides a visible overview of the different quotas of each complexity category. The exemplary thick black line represents the overall average for the whole supply chain and gives therefore a rough overview of the complexity characteristics of the examined supply chain. The grey line represents an exemplary supplier/customer combination and therefore offers a broad range for interpretation. All deviations from the overall average can give indications for the ongoing analysis phase.
Dynamic Complexity (Product/Technological Intricacy)
hig
h
h
ig
h high
high
ll
Structural Complexity (Level-Spanning) Structural Complexity
(Elements)
Dynamic Complexity (Organizational Aspects) high
low low low
low low
overa
Supplier/Customer A
[image:10.595.161.486.236.482.2]Dynamic Complexity (Uncertainty)
Figure 3: Complexity Spider Graph
Based on the assumption that all elements, which are faced with a high complexity, are probably exporting this complexity to the other members of the supply chain, these elements should be investigated more in detail in step two. Based on the interpretation of the spider graph, all supplier/customer combinations that should be investigated more in detail in the next step can be identified.
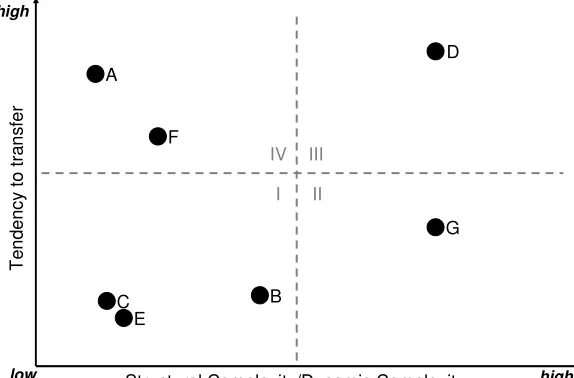
supply chain members and those which are not. Based on this differentiation, the complexity generating and/or exporting operations can be clearly identified. For an interpretation of the results, the findings of the structural and the dynamic complexity analysis are matched and displayed on the x-coordinate in a graph, exemplary shown in figure 4.
/ i i
A
B C
E
D
F
G
I III IV
T
e
nd
en
cy
to tra
ns
fer
Structural Complexity Dynam c Complex ty
low high
high
[image:11.595.152.439.156.345.2]II
Figure 4: Complexity Portfolio
This representation gives a good choice to identify the operations which have to be examined in detail within the last step. For instance operation “C”, shown in figure 4, is having a relatively low level of complexity and has also a minor tendency to transfer this complexity to the other supply chain members. Because of this, operation “C” needs not to be analyzed more in detail in step 3. But for instance operation “D” has a high level of complexity and also tends to transfer this complexity to other members. Therefore all operations of quadrant III and also selective ones from quadrant IV should be transferred to step 3.
The concept of step 1 and 2 is to identify the major areas and operations where complexity is visible, generated, or transferred to other. Contrary to this, the main goal of step 3 is to deduce the specific drivers of these complexities and to identify areas for improvement. Therefore the presented complexity model is used. Based on the results of the former steps and an advanced investigation including the drivers and effects of the single operation’s complexities, the complexity model is set up for every observed operation. By analyzing the drivers and effects matrixes and by interpretation of the relations between the single models and levels, the main complexity causes for every operation can be deduced. Only the structural complexity can be influenced directly. Within the analysis of the driver matrixes all drivers, which could be influenced in this way can be separated from the others. By following the effects matrixes of these drivers also the changes in the dynamic complexity can be estimated in to some extent.
Summary & Conclusions
As a result, the generation and transfer of complexity within a single company, within a supplier/customer operation and within the entire supply chain can be comprehended. By interpreting these results, the room for improvement can be identified. The external complexity and the dynamic complexity could not directly be influenced. Therefore complexity management actions have to concentrate either on the direct design of structural complexity, such as by
adapting the organizational structures, or by an indirect design of the dynamic complexity. This can be done by influencing the causes of the dynamic complexity. Therefore the analysis approach has separated the dynamic complexity into the three key driver categories. In summary, all necessary information for a goal-oriented design of a supply chains complexity are given.
References
Bar-Yam, Y. (2004). Multiscale Complexity/Entropy. Advances in Complex Systems, 7, 47-63.
Beamon, B. M. (1999). Measuring supply chain performance. International Journal of
Operations & Production, 19, 275-292.
Benett, S. (1999). Komplexitätsmanagement in der Investitionsgüterindustrie. St. Gallen:
Universität St. Gallen.
Blecker, T., Abdelkafi, N., Kaluza, B. & Kreutler, G. (2004). Mass Customization vs.
complexity: A Gordian Knot? In Galetic, L. (Ed.) 2nd International Conference “An
Enterprise Odyssey: Building Competitive Advantage” (pp. 890–903), Zagreb/Croatia: Graduate School of Economics & Business.
Blecker, Th., Friedrich, G., Kaluza, B., Abdelkafi, N. & Kreutler, G. (2005). Information and
Management Systems for Product Customization. New York: Springer.
Bohne, F. (1998). Komplexitätskostenmanagement in der Automobilindustrie. Augsburg:
Universität Augsburg.
Bolin, H., & Hulten, L. (2002). Information Exchange and Controllability in Logistics,
Working Paper TFK. Stockholm: TFK, Retrieved December 01, 2004, from http://www.tfk.se/publik/ 2002_3_long.pdf.
Büssow, C. (2004). Prozessbewertung in der Logistik. Wiesbaden:
Deutscher-Universitäts-Verlag.
Das, S. K. (1996). The Measurement of flexibility in manufacturing systems. The international
journal of flexible manufacturing systems, 43, 67-93.
Ernst, R., & Kamrad, B. (2000). Evaluation of supply chain structures through modularization
and postponement. European Journal of Operational Research, 124, 495-510.
Efstathiou, J., Calinescu, A., & Blackburn, G. (2002). A web-based expert system to assess the
complexity of manufacturing organizations. Robotics and Computer Integrated
manufacturing, 18, 305-311.
Forrester, J. (1961). Industrial Dynamics. New York: John Wiley & Sons.
Frizelle, G., & Woodcock, E. (1994). Measuring complexity as an aid to developing operational
strategy. International Journal of Operations & Production, 15, 26-39.
Gell-Mann, M., & Lloyd, S. (2004). Effective Complexity. Working Paper 03-12-068. Santa Fe
Institute. Retrieved May 5, 2004, from
http://www.santafe.edu/sfi/publications/wpabstract/200312068.
Gupta, Y. P., & Goyal, S. (1989). Flexibility of manufacturing systems - Concepts and
measurements. European Journal of Operational Research, 43, 119-135.
Hartmann, T. (1997). Beitrag zur Senkung der Komplexität in der Materialflußsteuerung.
Hamburg: Hamburg University of Technology.
Heina, J. (1999). Variantenmanagement - Kosten-Nutzen-Bewertung zur Optimierung der
Hub, H. (1994). Ganzheitliches Denken im Management. Wiesbaden: Gabler Verlag.
Kaiser, A.(1995). Integriertes Variantenmanagement mit Hilfe der Prozesskostenrechnung. St.
Gallen: Universität St. Gallen.
Kersten, W. (2001). Marktorientiertes Vielfaltsmanagement als Basis für effiziente
Produktionssysteme und kontinuierliche Produktinnovation. In Blecker, T. & Gemünden
H. G. (Eds.) Innovatives Produktions- und Technologiemanagement (pp. 35-54). Berlin:
Springer.
Kestel. R. (1995). Variantenvielfalt und Logistiksysteme. Wiesbaden: Gabler.
Kirchhoff, R. (2003). Ganzheitliches Komplexitätsmanagement. Wiesbaden: Gabler Verlag.
Kolmogorov, A. (1965). Three approaches to the quantitative definition of information.
Problems of Information Transmission, 1, 1-11.
Lee, H. L., Padmanabhan, V. & Whang, S. (1997). Information Distortion in a Supply Chain:
The Bullwhip Effect, Management Science, 43, 546-558.
Luczak, H. & Fricker, A. (1997). Komplexitätsmanagement – ein Mittel der strategischen
Unternehmensgestaltung. In Schuh, G. & Wiendahl, H. P. (Eds) Komplexität und Agilität -
Steckt die Produktion in der Sackgasse? (pp. 311-323). Berlin: Springer.
Luhmann, N. (1980). Komplexität. In Grochla, E. (Ed.) Handwörterbuch der Organisation (pp.
1064-1070). Stuttgart: Poeschel Verlag.
Mc Carthy, I. P., Rakotobe-Joel, T., & Frizelle, G. (2000). Complex systems theory:
implications and promises for manufacturing organizations. International Journal of
Manufacturing Technology and Management, 2, 559-579.
Perona, M. & Miragliotta, G. (2004). Complexity management and supply chain performance
assessment - A field study and a conceptual framework. International journal of production
economics, 90, 103-115.
Puhl, H. (1999). Komplexitätsmanagement - Ein Konzept zur ganzheitlichen Erfassung,
Planung und Regelung der Komplexität in Unternehmensprozessen. Kaiserslautern: Universität Kaiserslautern.
Raufeisen, M.(2003). Konzept zur Komplexitätsmessung des Auftragsabwicklungsprozesses.
München: TCW Verlag.
Sage, A. P. & Armstrong, J. E.(2000). Introduction to Systems Engineering. New York: John
Wiley & Sons Inc.
Scherf, O. (2003). Komplexität aus systemischer Sicht. St. Gallen: Universität St. Gallen.
Sethi, A. K., & Sethi, S. P. (1990). Flexibility in manufacturing: A survey. The international
journal of flexible manufacturing systems, 2, 289-328.
Sivadasan, S., Efstathiou, J., Calinescu, A. & Huaccho Huatuco, L. (2004). Supply Chain
Complexity.In New, S. & Westbrook, R. (Eds.) Understanding supply chains: concepts,
critiques, and futures (pp.133-163). Oxford: Univ. Press.
Sivadasan, S., Efstathiou, J., Frizelle, G., Shirazi, R., & Calinescu, A. (2002). An information-theoretic methodology for measuring the operational complexity of the supplier-customer
systems. International Journal of Operations & Production, 22, 80-102.
Shannon, C. E. (1948). The Mathematical Theory of Communication. The Bell System technical
Suttrop, D (1999). Effizienz und Wachstum durch Komplexitätsmanagement, VDI-Z, no. 7/8,
48-51.
Westphal, J. (2000). Komplexitätsmanagement in der Produktionslogistik. Wiesbaden:
Universität Wiesbaden.
Wildemann, H. (1999). Komplexität vermeiden oder beherrschen lernen. Harvard Business
Manager, 21, 31-42.
Wilding, R. (1998). The supply chain complexity triangle. International Journal of Physical