Assessing Pareto Type II Software Reliability
using SPC
R.Satya Prasad
Associate Professor Department of CSE Acharya Nagarjuna
University Guntur, Andhra Pradesh,
India.
G. Sridevi
Associate Professor Department of CSE Nimra Women’s College of
Engg Vijayawada, Andhra
Pradesh, India.
K.Sita Kumari
Associate Professor Department of IT V.R.Siddhartha Engg.
College
Kanuru, Vijayawada, A.P. India.
ABSTRACT
Software reliability is one of the most important characteristics of software quality. Its measurement and management technologies employed during software life cycle are essential for producing and maintaining quality/reliable software systems. It can also be monitored efficiently using Statistical Process Control (SPC). It assists the software development team to identify and actions to be taken during software failure process and hence, assures better software reliability. In this paper we propose a control mechanism based on the cumulative observations of Interval domain data using mean value function of Pareto type II distribution, which is based on Non-Homogenous Poisson Process (NHPP). The maximum likelihood estimation approach is used to estimate the unknown parameters of the model. We also present an analysis of failure data sets at a particular point.
General Terms
Software failure data, Mean value function.
Keywords
Software Reliability, NHPP, Pareto type II distribution, Parameter Estimation, Interval Domain data, ML Estimation, Statistical Process Control, Mean value function, Control charts.
1
.INTRODUCTION
Software Reliability is the most dynamic quality characteristic which can measure and predict the operational quality of the software system during its intended life cycle. Software Reliability is the probability of failure free operation of software in a specified environment during specified duration [Musa 1998], Wood[1996], Satya Prasad[2007]. To identify and eliminate human errors in software development process and also to improve software reliability, the Statistical Process Control concepts and methods are the best choice.
The NHPP based models are the most important models because of their simplicity, convenience and compatibility. The NHPP based software reliability growth models are proved quite successful in practical software reliability engineering [Musa et al., 1987].
Here SPC concepts and methods are used to monitor the performance of a software process over time in order to verify that the process remains in the state of Statistical control. It helps in finding assignable causes, long term improvements in the software process. Software quality and reliability can be achieved by eliminating the causes or improving the software process or its operating procedures.
The main issue in the NHPP model is to determine an appropriate mean value function to denote the expected number of failures experienced up to a certain time point. Model parameters can be estimated by using maximum likelihood estimate (MLE).Parameter values can be obtained using Newton Raphson Method. SPC is a powerful tool to optimize the amount of information needed for use in making management decisions. Statistical techniques provide an understanding of the business baselines, insides for process improvements, communication of value and results of processes, and active and visible involvement.
The most popular technique for maintaining process control is control charting. The control chart is one of the seven tools for quality control. Software process control is used to secure, that the quality of the final product will conform to predefined standards.
A process is said to be statistically “in-control” when it operates with only chance causes of variation. On the other hand, when assignable causes are present, then we say that the process is statistically “out-of-control”.
SPC provides a real time analysis to establish controllable process baselines; learn, set and dynamically improve process capabilities; and focus business areas needing improvement. The early detection of software failures will improve the software reliability. The selection of proper SPC charts is essential to effective statistical process control implementation and use. The SPC chart selection is based on data, situation and need.
Section 6 Conclusion.
2. MODEL FORMULATION
There are numerous software reliability growth models available for use according to probabilistic assumptions. The Non Homogenous Poisson Process (NHPP) based software reliability growth models are proved to be quite successful in practical software reliability engineering. NHPP model formulation is described in the following lines.
A software system is subjected to failures at random times caused by errors present in the system.
Let be a counting process representing the cumulative number of failures by time t. Since there are no failures at t=0 we have
It is reasonable to assume that the number of software failures during non-overlapping time intervals do not affect each other. In other words, for any finite collection of times . The n random variables
are independent. This implies that the counting process {N(t), t>0} has independent increments.
Let m(t) represent the expected number of software failures by time’s’. The mean value function m(t) is finite valued, non-decreasing, non-negative and bounded with the boundary conditions.
Where a is the expected number of software errors to be eventually detected.
Suppose N (t) is known to have a Poisson probability mass function with parameters m(t) i.e.,
Then N(t) is called an NHPP. Thus the stochastic behaviour of software failure phenomena can be described through the N(t) process. Various time domain models have appeared in the literature (Kantam and Subbarao, 2009) which describe the stochastic failure process by an NHPP which differ in the mean value functions m (t).
3. THE PROPOSED PARETO TYPE II
SRGM
In this paper we consider m(t) as given by =
(3.1)
Where [m (t)/a] is the cumulative distribution function of Pareto type II distribution (Johnson et al, 2004) for the present choice.
Let N (t) be the number of errors remaining in the system at time‘t’
=
4 PARAMETER ESTIMATION BASED
ON INTERVAL DOMAIN DATA
In this section we develop expressions to estimate the parameters of the Pareto type II model based on interval domain data. Parameter estimation is of primary importance in software reliability prediction.
A set of failure data is usually collected in one of two common ways, time domain data and interval domain data. In this paper parameters are estimated from the interval domain data.
The mean value function of Pareto type II model is given by
(4.1)
In order to have an assessment of the software reliability, a, b and c are to be known or they are to be estimated from software failure data. Expressions are now delivered for estimating ‘a’, ‘b’ and ‘c’ for the Pareto type II model. Assuming the given data are given for the cumulative number of detected errors ni in a given time interval (0, ti) where i=1,2, ….. n and 0 < t1< t2< …tn, then the logarithmic likelihood function (LLF) for interval domain data [8] is given by
(4.2)
(4.3)
(4.4)
Accordingly parameters ‘a’,’b’ and ‘c’ would be solutions of the equations
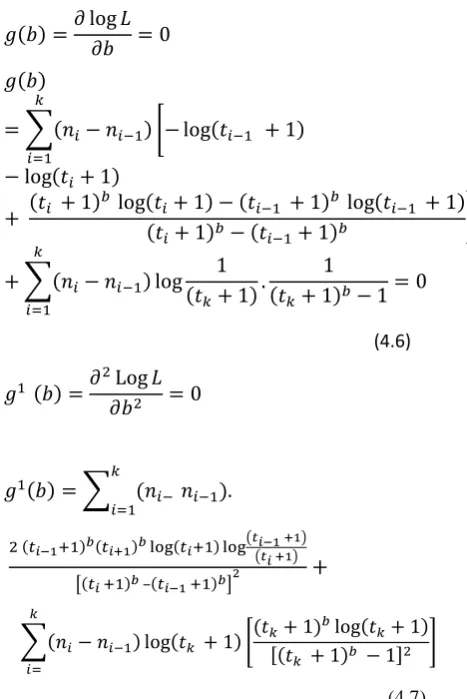
The parameter ‘b’ is estimated by iterative Newton Raphson Method using
=
, where g(b) and g’(b) are expressed as follows.
(4.6)
–
(4.7)
The parameter ‘c’ is estimated by iterative Newton Raphson Method using
Where g (c ) and g1(c ) are expressed as follows.
(4.8)
(4.9)
The values of ‘b’ and ‘c’ in the above equations can be obtained using Newton Raphson Method. Solving the above equations, simultaneously yields the point estimates of the parameters b and c. These equations are to be solved iteratively and their solutions in turn when substituted in equation (4.5) gives value of ‘a’.
5. DATA ANALYSIS
[image:3.595.52.286.168.518.2]In this section, we present the analysis of one software failure data set. The set of software errors analysed here is borrowed from a real software development project as published in Pham (2005), which in turn referred to Pham(2005) as Zhang et al.,(2000).The data are named as Release 2 test data. The Release 2 test data is summarized in the below table.
Table 1 - Release 2 Test Data
Test Week
CPU Hours
Percent CPU Hours
Defects found
Predicted total defects
1 384 - 13 -
2 1186 - 18 -
3 1471 - 26 -
4 2236 - 34 -
5 2772 - 40 -
6 2967 - 48 -
7 3812 - 61 -
8 4880 - 75 -
9 6104 - 84 -
10 6634 65 89 203
11 7229 70 95 192
12 8072 79 100 179
13 8484 83 104 178
14 8847 86 110 184
15 9253 90 112 184
16 9712 95 114 183
17 10083 98 117 182
18 10174 99 118 183
19 10272 100 120 184
Solving equations in section 4 by Newton Raphson Method(N-R) method for the Release 2 test data, the iterative solutions for MLEs of a, b and c are
a = 158.1535 b = 0.977674 c = 8.74581
[image:4.595.318.568.153.326.2]Hence, we may accept these three values as MLEs of a, b, c. Using these we can compute Now the control limits are calculated by the following equations taking the standard values 0.00135, 0.99865 and 0.5.
Table 2. Successive differences of Cumulative mean values
Week Cumulative
Failures M(t)
Successive Differences
1 13 93.24004 11.89084 2 18 105.1309 11.96898 3 26 117.0999 7.528576 4 34 124.6284 4.040184 5 40 128.6686 4.070694 6 48 132.7393 4.641541 7 61 137.3809 3.401823 8 75 140.7827 1.649872 9 84 142.4325 0.786680 10 89 143.2192 0.844979 11 95 144.0642 0.633677 12 100 144.6979 0.466909 13 104 145.1648 0.642012 14 110 145.8068 0.199979 15 112 146.0068 0.193534 16 114 146.2003 0.278884 17 117 146.4792 0.090060 18 118 146.5693 0.175969 19 120 146.7452 ---
[image:4.595.61.272.260.738.2]
These limits are converted to form. They are used to find whether the software process is in control or not by placing the points in Mean value chart shown in figure 1.
Figure 1. Mean Value chart
A point below the control limit indicates an alarming signal. A point above the control limit indicates better quality. If the points are falling within the control limits it indicates the software process is in stable. The values of control limits are as follows.
By placing the successive differences shown in table 2 on y axis and failure week on x axis and the values of control limits are placed on Mean Value chart, we obtained Figure 1.The Mean Value chart shows that all the successive differences after the 13 th failure data has fallen below ) which indicates the failure process is identified. It is significantly early detection of failures using Mean Value chart.
6. CONCLUSION
Software Reliability is an important quality measure that quantifies the operational profile of computer systems. In this paper we proposed Pareto type II software reliability growth model. This model is primarily useful in estimating and monitoring software reliability, which is viewed as a measure of software quality. Equations to obtain the maximum likelihood estimates of the parameters based on interval domain data are developed.
This analysis shows that the Release 2 data (Figure 1) shows out of control signals i.e., below the LCL. We conclude that our method of estimation and the control chart are giving a +ve recommendation for their use in finding out preferable control process or desirable out of control signal.
By observing the Mean Value Control chart (Figure 1) we identified that the failure situation is detected at 14th point of Table-2. Hence our proposed Mean Value Chart detects out of
UCL 157.94003
CL 79.07677
LCL 0.21351
0.0100 0.1000 1.0000 10.0000 100.0000 1000.0000
1 2 3 4 5 6 7 8 9 10 11 12 13 14 15 16 17 18
Succe
ss
iv
e
D
iff
e
re
nce
s
control situation. This is a simple method for model validation and is very convenient for practitioners of software reliability. The early detection of software failure will improve the software reliability. The methodology adopted in this paper is better than the methodology adopted by Xie et al[2002]. Therefore, we may conclude that this model is the best choice for an early detection of software failures.
7. ACKNOWLEDGEMENTS
Our thanks to Department of Computer Science and Engineering, Acharya Nagarjuna University for providing necessary details to carry out the research work.
8. REFERENCES
[1] Goel, A.L., Okumoto, K., 1979. Time-dependent error detection rate model for software reliability and other performance measures. IEEE Trans. Reliab. R-28, 206-211.
[2] Musa J.D, Software Reliability Engineering MCGraw-Hill, 1998.
[3] Pham .H (2005) “A Generalized logistic Software Reliability Growth Model”, Opsearch, Vol. 42, No. 4, 332-331.MCGraw-Hill, New York.
[4] Musa J.D., Iannino, A., Okumoto, K., 1987. Software Reliability: Measurement Prediction Application. MC Graw Hill, New York.
[5] Wood, A(1996), “Predicting software Reliability”, IEEE Computer,2253-2264.
[6] Satya Prasad R and Geetha Rani N (2011), “Pareto type II Software Reliability Growth Model”. International Journal of Software Engineering, Volume 2, Issue(4) 81-86.
[7] Satya Prasad R (2007) “Half Logistic Software Reliability Growth Model”, Ph.D Thesis of ANU, India. [8] Pham, H., “System Software Reliability”, Springer 2006. [9] Satya Prasad R and Goutham V (2011), “Interval Domain Software Process Control-GoelOkumoto”,
International Journal of Research and Reviews in Computer Science, Volume 2, Issue (4) , ISSN:2079-2557
[10] Xie. M, T.N Goh and P.Rajan . “Some effective control chart procedures for reliability monitoring”, Reliability engineering and system safety, 2002. 77, 143-150.
9. AUTHORS PROFILE
Dr.R Satya Prasad received Ph.D.degree in computer science in the faculty of Engineering in 2007 from Acharya Nagarjuna University, Andhra Pradesh, India. He received gold medal from Acharya Nagarjuna University for his outstanding performance in master’s degree. He is currently working as Associate Professor in the department of Computer Science & Engineering, Acharya Nagarjuna University. He has occupied various Academic responsibilities like practical examiner, project adjudicator, external member of board of examiners for various universities and colleges in and around in Andhra Pradesh. His current research is focused on Software engineering, Image processing & Database Management system. He has published several papers in National & International Journals.
Mrs. G. Sridevi received M.Sc. and M.Tech degree from Acharya Nagarjuna University. She is currently pursing Ph.D at Department of Computer Science and Engineering, Acharya Nagarjuna University, Andhra Pradesh, India. She is currently working as a Vice-Principal and Associate professor in the Department of Computer Science, Nimra Women’s College of Engineering, Jupudi, Ibrahimpatnam, Vijayawada, Andhra Pradesh. Her research interests lies in Data Mining and Software Engineering.
Mrs. K.Sita kumari received M.Sc degree from Acharya Nagarjuna University, Guntur and M.Tech degree from Dr.MGR University, Chennai. She is currently pursuing her Ph.D from Department of Computer Science and Engineering, Acharya Nagarjuna University, Andhra Pradesh, India. Presently she is working as an Associate Professor in the department of Information Technology, V.R.Siddhartha Engineering College, Kanuru, Vijayawada.