© 2017, IRJET | Impact Factor value: 5.181 | ISO 9001:2008 Certified Journal | Page 761
OPTIMIZATION OF MACHINING PARAMETERS IN A TURNING OPERATION OF
AISI 202 AUSTENITIC STAINLESS STEELTO MINIMIZE SURFACE ROUGHNESS
Chandan Kumar
1, Mohammad Nehal Akhtar
2, Mohd Ziaul Haq
3123
Assistant Professor, Dept. of Mechanical Engineering, AIET Lucknow, UP, India
---***---Abstract -
The present work concerned an experimental
study of turning on Austenitic Stainless steel of grade AISI 202 by a TiAlN coated carbide insert tool. The primary objective of the ensuing study was to use the Response Surface Methodology in order to determine the effect of machining parameters viz. cutting speed, feed, and depth of cut, on the surface roughness of the machined material. The objective was to find the optimum machining parameters so as to minimize the surface roughness for the selected tool and work materials in the chosen domain of the experiment. The experiment was conducted in an experiment matrix of 20 runs designed using afull-factorial Central Composite Design (CCD). Surface
Roughness was measured using a Talysurf. The data was compiled into MINITAB ® 17 for analysis. The relationship between the machining parameters and the response variables (surface roughness) were modeled and analysed using the Response Surface Methodology (RSM). Analysis of Variance (ANOVA) was used to investigate the significance of these parameters on the response variables, and to determine a regression equation for the response variables with the machining parameters as the independent variables, with the help of a quadratic model. Main effects and interaction plots from the ANOVA were obtained and studied along with contour and 3-D surface plots.
Key Words: Turning, RSM, Cutting Speed, Depth of Cut, Surface roughness, CCD, ANOVA, etc.
1. INTRODUCTION
The turning operation is a basic metal machining operation that is used widely in industries dealing with metal cutting. In a turning operation, a high-precision single point cutting tool is rigidly held in a tool post and is fed past a rotating work piece in a direction parallel to the axis of rotation of the work piece, at a constant rate, and unwanted material is removed in the form of chips giving rise to a cylindrical or more complex profile. This operation is carried out in a Lathe Machine either manually under an operator’s supervision, or by a controlling computer program [1]. The work piece used for the concluded experiment was AISI 202 grade Austenitic stainless steel. There are two series of Austenitic stainless steels – 300-series and 200-series. 300 series steels find most wide use around the world but 200 series have become very popular in the Asian subcontinent
as an alternative to the 300 series to counter the increase in prices of Nickel.
Grade 202 steel can be made into plates, sheets and coils and finds extensive use in restaurant equipment, cooking utensils, sinks, automotive trims, architectural applications such as doors and windows, railways cars, trailers, horse clamps etc.
Neseli et. al[2]used RSM method and Nose radius, approach angle and rake angle as the input variables and found that the nose radius has the most significant effect on surface roughness.
Studies by Sahin Y. et. al.[3] have shown that surface roughness is mostly dependent on feed rate which is the dominating factor
Nanavati et. al.[4]used feed, cutting speed and tool nose radius as predictors in the RSM method and determined that feed was the most significant factor affecting the surface roughness followed by the tool nose radius.
A study conducted by Bouacha, showed that feed rate was the most influential parameter in determining surface finish of a product followed by the cutting speed.
Surface roughness is a measure of the surface finish of a product and an index of the product quality. Surface roughness is a measurement of the small scale variations in the height of a physical surface [4]. It is expressed in various ways and methods, like arithmetic mean or centre-line average (Ra), Root-mean square average (Rq), maximum peak (Ry), ten-point mean roughness (Rz), maximum valley depth (Rv), maximum height of profile (Rt = Rp – Rv) etc. Out of all these, the most commonly used indicator for surface roughness is Ra. Ra, or the arithmetic mean value, previously known as AA (Arithmetic Average) or CLA (Centre-Line Average) is the arithmetic mean of deviations of a series of points from the centre line or datum line. The datum line is such that sum of the areas under the profile above the datum will be equal to the sum of areas below the datum. Generally, surface roughness is expressed in microns (μm).
© 2017, IRJET | Impact Factor value: 5.181 | ISO 9001:2008 Certified Journal | Page 762
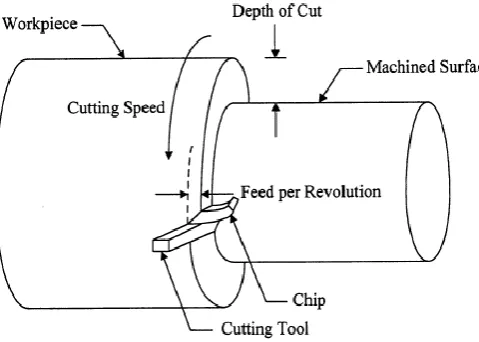
Fig 1: The adjustable machining parameters
Some of the factors that affect surface roughness are machining parameters like cutting speed, feed, depth of cut etc., tool material and its properties, work material and its properties and tool geometry. Minimal changes in the above mentioned factors may bring about significant changes in the product quality and tool life [1].
2. EXPERIMENTAL PROCEDURE
A centre lathe was used to carry out the machining. The insert was clamped in a holder and mounted on the tool post. The job was held rigidly by the chuck of the lathe. Centre drilling was done and the job was held at the other end by the tail stock and a skin pass was carried out. The setup was hence complete and the runs could be carried out from here. Dry cutting environment was used for the experimentation process. Dry cutting process is one that uses no coolant during machining. By the use of dry cutting, costs of cutting fluid were alleviated. Cutting fluids have corrosive effects and non-environment-friendly. Dry cutting reduces machining cost and is environment friendly. Also, inserts perform better at higher cutting temperatures achieved during dry cutting.
Surface roughness has been precisely measured with the help of a portable stylus-type profilometer, Talysurf (Taylor Hobson, Surtronic 3+, UK). Measurements were taken at different locations and the average was reported for each run.
[image:2.595.44.284.109.280.2]The following table shows the levels of the cutting parameters chosen.
Table 1: Factors and levels for the Response Surface Study
Code Parameter Level (-1) Level (+1) A Cutting Speed
(m/min) 66 112 B Feed (mm/rev) 0.05 0.15 C Depth of cut
(mm) 0.4 0.8
Design of experiments (DOE) is a structured method that is used to identify relationships between several input variables and output responses. With the help of DOE, the resources needed to carry out the experiment can be optimized [4]. Hence, it finds wide use in R & D studies. A few methods used as DOE are Taguchi Method, Response Surface Method and Factorial Designs. We will be focusing on the Response Surface Methodology during the ensuing study.
2.1 Response Surface Methodology (RSM)
Response Surface Method (RSM) is a collection of mathematical and statistical tools which are useful for the modeling and analysis of problems in which an output response of interest is influence by several input variables and our objective is to optimize (minimize or maximize based on the need) the response . It is a method which was developed by Box and Wilson in the early 1950‟s. It is capable of establishing causal relationships between input and output variables.[5]
2.2 Layout of Experiment for RSM
The experiment layout was obtained in accordance with the 3-level full-factorial Central Composite Design with 8 cube points, 6 axial points, 4 centre points, and 2 centre points in axial, resulting in a total of 20 runs. α was chosen as 1 to make the design face centred.
3. RESULTS AND DISCUSSIONS
© 2017, IRJET | Impact Factor value: 5.181 | ISO 9001:2008 Certified Journal | Page 763
Chart-1: Main effects plot for Ra
The main effects plot for Ra shows that the surface roughness first decreases sharply with the increase in cutting velocity. After a point, it gradually increases with further increase in cutting velocity. The same happens in the case of feed but the increase after that particular point is very steep. Ra also reduces with increase in depth of cut to that particular level after which it is found to have a steep increase with further increase in the depth of cut.
Chart-2: Interaction plot for Ra
Chart-3: Residual Plots for Ra
Use a contour plot to explore the potential relationship between three variables. Contour plots display the 3-dimensional relationship in two dimensions, with x- and y-factors (predictors) plotted on the x- and y-scales and response values represented by contours. A contour plot is like a topographical map in which x-, y-, and z-values are plotted instead of longitude, latitude, and elevation.3D surface and 3D wireframe plots are graphs that we can use to explore the potential relationship between three variables. The predictor variables are displayed on the x- and y-scales, and the response (z) variable is represented by a smooth surface (3D surface plot) or a grid (3D wireframe plot).
Contour plots and 3-D surface plots for Surface Roughness are displayed in Fig.
Surface plots are diagrams of three-dimensional data. Rather than showing the individual data points, surface plots show a functional relationship between a designated dependent variable (Y), and two independent variables (X and Z). The plot is a companion plot to the contour plot.
© 2017, IRJET | Impact Factor value: 5.181 | ISO 9001:2008 Certified Journal | Page 764
Chart-4: Contour plot of Ra vs cutting speed, Feed
Chart-5: Surface plot of Ra vs Cutting Speed, Feed
The above 3D surface and contour plots represent a minimax response surface. As the color gets darker, the response increases. Note the relationship between the shape of the surface and the shape of the contours. From the stationary point (saddle point) near the center of the design, increasing or decreasing both factors at the same time leads to a decrease in the response. But from the stationary point (saddle point), increasing either factor while decreasing the other leads to an increase in the response. Both the surface and contour plots are based on a regression model.
Chart-6: Contour plot of Ra vs cutting speed, Depth of Cut
Chart-7: Surface plot of Ra vs Cutting Speed, Depth of Cut
© 2017, IRJET | Impact Factor value: 5.181 | ISO 9001:2008 Certified Journal | Page 765
Chart-8: Contour plot of Ra vs Feed, Depth of Cut
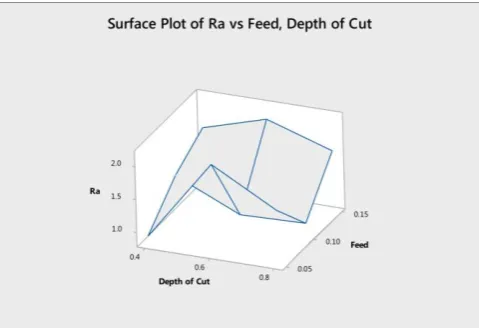
Chart-9: Surface plot of Ra vs Feed, Depth of Cut
The above 3D surface and contour plots represent a response surface with a simple maximum. As the color gets darker, the response increases. Note the relationship between the shape of the surface and the shape of the contours. Both the surface and contour plots are based on a regression model.
The three best optimal settings are shown in Table 2 below. The best setting is found to be
[image:5.595.39.279.304.468.2]V c = 112 m/min, f = 0.0540404 mm/rev and d = 0.4 mm
Table 2: Three best optimal settings
Sol Cutting Speed
Feed Depth of
Cut
Ra Fit
1 112 0.0540404 0.4 0.869883 2 66 0.0723647 0.410652 0.860066 3 66 0.062364 0.4 0.977706
3. CONCLUSIONS
RSM was successfully applied in optimizing the surface roughness for the chosen tool-work combination and for the selected domain of the input machining parameters. ANOVA analysis was carried out and it is observed that feed is the most significant factor affecting the surface roughness, closely followed by cutting speed and depth of cut, while the only significant factor affecting the tool wear was found to be the depth of cut. The optimum running condition was found to be at V c (112 m/min), f (0.0540404 mm/rev) and d (0.4 mm). Empirical models for surface roughness and tool wear have been determined based on which predictions can be carried out for output responses for appropriate applications.
4. ACKNOWLEDGEMENT
We gratefully acknowledge the laboratory support provided by Professors and Lab Incharges, Department of Mechanical Engineering, IIT BHU Varanasi and financial support by my Mother. Also this work is supported by Mr. Nazmul Hasan, Assistant Professor, AIET Lucknow.
REFERENCES
[1] Srinivas P. and Choudhury S.K., (2004), “Tool wear prediction in turning,” Journal of Materials Processing Technology, 153(1) pp.276-280.
[2]
Neseli
S., Yaldiz S. and Turkes E., (2011), “Optimization of tool geometry parameters for turning operations based on the response surface methodology,” Measurement, 44(3), pp. 80-587.[3] Sahin Y. and Motorcu A.R., (2008), “Surface roughness model in machining hardened steel with cubic boron nitride cutting tool,” International Journal of Refractory Metals and Hard Materials, 26(2), pp. 84-90 .