http://dx.doi.org/10.4236/ojce.2014.44032
How to cite this paper: Ahmed, M., Mohamed, M.H., Mallick, J. and Hasan, M.A. (2014) 3D-Analysis of Soil-Foundation- Structure Interaction in Layered Soil. Open Journal of Civil Engineering, 4, 373-385.
http://dx.doi.org/10.4236/ojce.2014.44032
3D-Analysis of Soil-Foundation-Structure
Interaction in Layered Soil
Mohd Ahmed
1*, Mahmoud H. Mohamed
2, Javed Mallick
3, Mohd Abul Hasan
4Civil Engineering Department, Faculty of Engineering, King Khalid University, Abha, KSA Email: *[email protected]
Received 26 September 2014; revised 22 October 2014; accepted 20 November 2014
Copyright © 2014 by authors and Scientific Research Publishing Inc.
This work is licensed under the Creative Commons Attribution International License (CC BY).
http://creativecommons.org/licenses/by/4.0/
Abstract
The analysis of building structure in contact with soil involves an interactive process of stresses and strains developed within the structure and the soil field. The response of Piled-Raft Founda-tion system to the structure is very challenging because there is an important interplay between the component of building structure and the soil field. Herein, soil-foundation-structure interac-tion of buildings founded on Piled-Raft Foundainterac-tion is evaluated through 3D-Nonlinear Finite Ele-ment Analyses using PLAXIS3D FOUNDATION code. The soil settleEle-ments and forces demand of the high-rise building structures and foundation is computed. The parametric study affecting the soil- foundation-structure response has been carried out. The parameters such as construction phasing, sequential loading, building aspect ratios, soil failure models and thickness proportion of soil field stiff layer, are considered. It is concluded that the interaction of building foundation-soil field and super-structure has remarkable effect on the structure.
Keywords
Foundation, Piled-Raft Foundation, Soil Models, Soil Field, Finite Element Method, Sequential Loading, Construction Phase
1. Introduction
piled-raft foundation penetrates deep into the foundation soil increasing its significant depth below the ground and affects the response of structure and soil. The method of analysis of foundation and structure also affects the response of structure and soil. The complex foundation system requires a reliable advance computational me-thod that can simulate the 3D-non-linear soil behavior and structure-foundation system interaction. Considerable attention has been paid to analyze, design and construction of combined piled-raft foundation (CPRF) system. The survey of various analytical methods and numerical methods used to model the behavior of geomechanics has been presented by [1]. The various aspects contributed in reference to piled-raft foundation design have been compiled by Hemsley [2]. Ahmed et al. [3] has pointed out the recent advances in the piled-raft foundation sys-tem. Lin and Feng [4] have presented piled-raft analysis output for settlement, bending moment both in pile and raft, and effects of raft flexibility for vertical uniform loading in the subsoil. For the case of piled raft placed over soft clay layer, the contact pressure is merely 4% - 6%, whereas it is 15% - 25% if the piled raft resting on sand layer at ground surface. Rabiei [5] has carried out the parametric study on piled-raft foundation design. The parameter studied were pile length and spacing, number of piles, raft thickness, pile-soil and raft-soil stiffness ratio and pile-raft interaction. They concluded that by ignoring the interactions involved in the piled raft system, may lead to serious underestimates of settlement and also lead to inaccurate estimates of raft bending moments and pile loads. Singh and Singh [6] demonstrated that ignoring the interactions between the piled raft founda-tions elements may lead to a very serious over-estimate of the stiffness of the foundation. The case studies on optimized piled-raft foundation performance comprising of connected and non-connected piles using simple 2D analysis are presented by Eslami et al. [7]. A simplified procedure applicable has been presented by Kapackci and Ozkan [8] for estimation of piled-raft settlement. Nguyen et al.[9] has proposed a simplified design ap-proach of piled-raft foundations under vertical load considering interaction effects. They compared the results of method with experimental and other numerical results and found good agreement between the results. The opti-mization study of piled-raft foundation systems has been carried out by Horikoshi and Randolph [10]. It is expe-rimentally demonstrated that model rafts, founded on structurally disconnected pile reinforced sand, will have reduced settlement and bending moments [11]. Field measurements of the load observed for the raft and the piles of piled-raft foundation on stiff clays at working conditions are reported by Cooke [12]. They suggest that the ratio of load in the most heavily loaded piles in the perimeter of the group to that in the least heavily loaded pile near the centre could be about 2.5. A displacement based design procedure is proposed by Prakoso and Kulhawy [13] for piled-raft foundation based on the results of simplified linear elastic and nonlinear plane strain piled-raft finite element models. The effect of raft and pile group compression capacity was evaluated on the raft settlements, raft bending moments, and pile-raft load transfer ratio. Mahmood and Ahmed [14] have carried out the dynamic analysis of framed including the soil-structure interaction effects and concluded that the soil-struc- ture interaction problem can have beneficial effects on the structural behavior when non-linear soil models and interface conditions are considered. Shayea and Zeedan [15] have presented a new approach for the design of raft foundation using 3-D modelling of each part of the whole structure (superstructure, raft and the soil) and considering the soil structure interaction. They developed charts to show the relationship between thickness of raft and number of design parameters including soil type.
2. Statement of the Problem
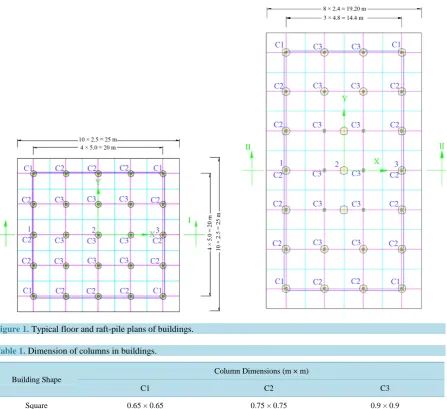
A 15-storey square/rectangular building having piled raft foundation in the two layered soil system is selected for the complete structure-foundation interaction analysis. The square building (aspect ratio = 1) has 4 bays in X-and Y-direction and the rectangular building (aspect ratio = 1.75) has 3 bays in X-direction and 6 bays in Y-direction as shown in Figure 1. Buildings have nearly the same plan area. The ground and typical floors are 6.0 m and 3.0 m high respectively. The structural system of all floors is a flat concrete slab type of 200 mm thickness subjected to a total uniform load of 15 kN/m2. Dimensions of columns are listed in Table 1. The con- crete raft is assumed to be at a depth 2.0 (m) beneath the ground surface and has 1.5 (m) thicknesses. The plan dimension of square raft is 25 m × 25 m with overhang of 2.5 m while the plan dimension of rectangular raft is 19.2 m × 33.6 m with overhang of 2.4 m. The estimated total vertical load on square and rectangular rafts is 138.8 MN. A total of 25 circular concrete piles of 0.75 m diameter are located under the raft for each building structure. Modulus of elasticity of concrete is assumed as 3.4 × 10⁷ kN/m2 while concrete Poisson’s ratio and density is considered in structural models as 0.2 and 25 kN/m3 respectively. The typical floor plans and founda-tion plans having raft with pile locafounda-tion of square and rectangular shaped building are shown in Figure 1.
[image:3.595.92.540.289.698.2]The slenderness ratio (L/D) of piles is taken as 26.7 and end tip of the piles are considered resting on the bot-tom surface of top soil layer having hardening soil model for different aspect of building, mode of application
Figure 1.Typical floor and raft-pile plans of buildings.
Table 1. Dimension of columns in buildings.
Building Shape
Column Dimensions (m × m)
C1 C2 C3
Square 0.65 × 0.65 0.75 × 0.75 0.9 × 0.9
of structure loading on foundation and for different failure model of soils. Modulus of elasticity of pile material is taken as 2.35 × 10⁷ kN/m2 while its density is considered as 25 kN/m3. The soil profile is of two layer systems with upper layer of loose sand and lower layer of dense sand (stiff soil). The different thickness of stiff soil is considered in the model to study the effect of stiff soil on the interaction analysis. Three thickness proportion of stiff soil namely 25%, 50% and 75% of total thickness are taken. The water level is assumed at the ground sur-face.
3. Soil Models
Soil is a complex material that behaves differently in primary loading, unloading and reloading. It exhibits non- linear behaviour well below failure condition with stress dependant stiffness [17]. The elastic-perfectly plastic models based on soil failure criteria namely, Mohr-coulomb (MC) and Mohr-coulomb incremental stiffness (MCI) with depth, are taken because of the most common used models. In the study, second order Hardening Soil (HS) model that considers shear hardening and compression hardening [17] and suitable to cohesion less soil is also used. The assigned soil parameters for the two layers soil field are given in Table 2.
4. Finite Element Modelling Methodology
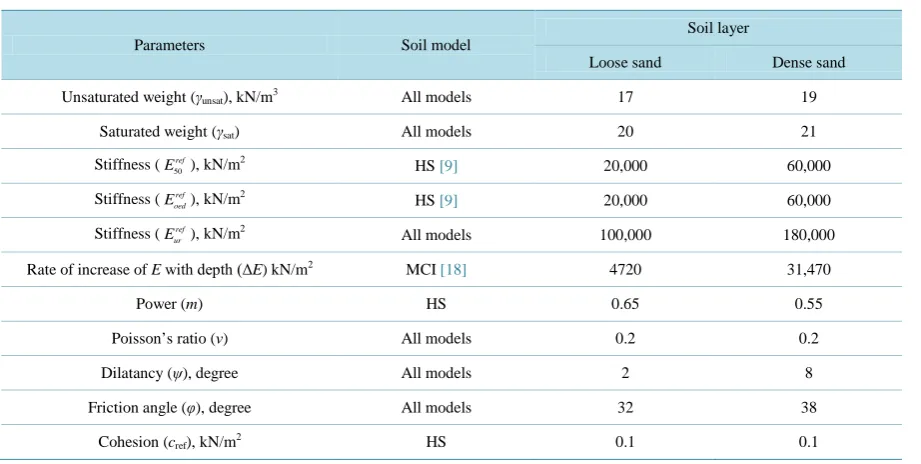
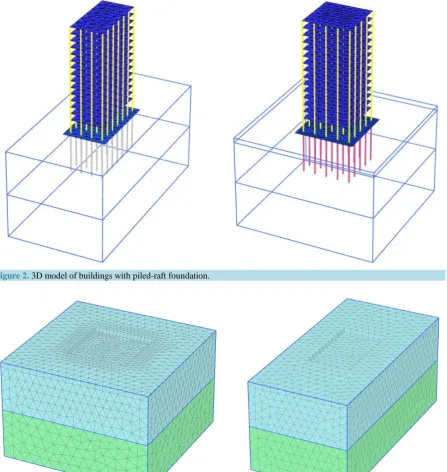
[image:4.595.86.547.492.724.2]The finite element method based on software PLAXIS 3D is used for three dimensional modelling of 15-storey building structure having piled-raft foundation in layered soil field. The columns and piles are modelled as frame elements with linear elastic properties. The interaction effect of pile and soil at the pile shaft is considered by means of Elasto-Plastic line-to-volume and point-to-volume interfaces [19] as an embedded pile model. The embedded pile model consisting of beam elements with non-linear skin and tip interfaces. There is no need for mesh refinement around piles as 3D mesh is not distorted by introducing embedded pile model [19]. The floor slab and raft is discretized using 6-node triangular plate elements with linear elastic properties. The soil field with two layers of non-cohesive soils namely loose and dense sand is modelled as 15-node wedge triangular continuum elements. The total number of elements in the discretized mesh for square building structure includ-ing soil field are 35,785 while for rectangular buildinclud-ing structure includinclud-ing soil field, number of elements are 24,785. As the mesh discretization has no significant effect on piled-raft analysis result [20], mesh sensitivity has not been examined and mesh generated automatically by PLAXIS code is used for the analysis. The 3D fi-nite elements structural models of square (aspect ratio = 1) and rectangular (aspect ratio = 1.75) shaped build-ings with piled-raft foundation are shown in Figure 2. The cross-section of 3D finite elements soil field models are shown in Figure 3.
Table 2. Soil parameters for different soil models.
Parameters Soil model
Soil layer
Loose sand Dense sand
Unsaturated weight (γunsat), kN/m3 All models 17 19
Saturated weight (γsat) All models 20 21
Stiffness ( 50
ref
E ), kN/m2
HS [9] 20,000 60,000
Stiffness ( ref oed
E ), kN/m2
HS [9] 20,000 60,000
Stiffness ( ref ur
E ), kN/m2
All models 100,000 180,000
Rate of increase of E with depth (ΔE) kN/m2 MCI [18] 4720 31,470
Power (m) HS 0.65 0.55
Poisson’s ratio (ν) All models 0.2 0.2
Dilatancy (ψ), degree All models 2 8
Friction angle (φ), degree All models 32 38
Figure 2. 3D model of buildings with piled-raft foundation.
[image:5.595.95.535.371.586.2]
Figure 3.3D finite elements foundation soil models of square and rectangular shaped buildings.
5. Results and Discussion
5.1. Foundation-Structure Interaction Effect on Soil Field
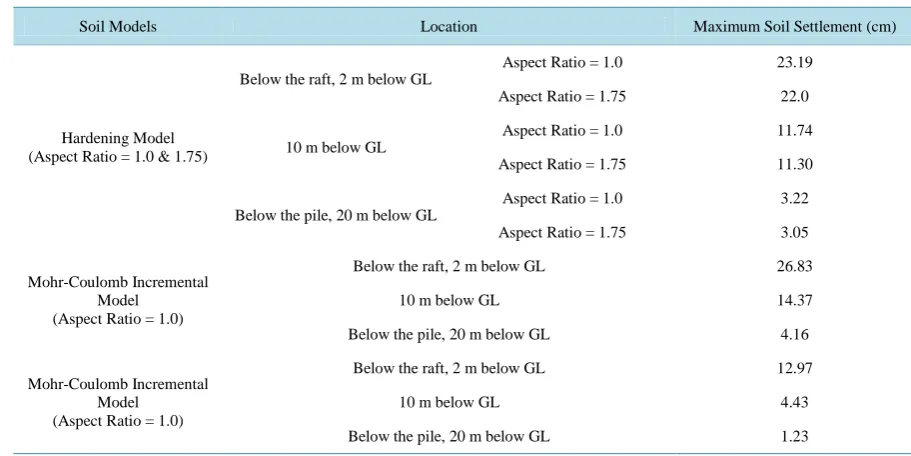
Table 3. Maximum soil settlement with different soil models and building aspect ratio.
Soil Models Location Maximum Soil Settlement (cm)
Hardening Model (Aspect Ratio = 1.0 & 1.75)
Below the raft, 2 m below GL
Aspect Ratio = 1.0 23.19
Aspect Ratio = 1.75 22.0
10 m below GL
Aspect Ratio = 1.0 11.74
Aspect Ratio = 1.75 11.30
Below the pile, 20 m below GL
Aspect Ratio = 1.0 3.22
Aspect Ratio = 1.75 3.05
Mohr-Coulomb Incremental Model
(Aspect Ratio = 1.0)
Below the raft, 2 m below GL 26.83
10 m below GL 14.37
Below the pile, 20 m below GL 4.16
Mohr-Coulomb Incremental Model
(Aspect Ratio = 1.0)
Below the raft, 2 m below GL 12.97
10 m below GL 4.43
Below the pile, 20 m below GL 1.23
the increase of aspect ratio of building. This may due to the reason that the load is distributed on a larger area in one direction of the building. The use of different soil failure model for soil field has also predicted dissimilar soil settlement. The behavior of soil at various levels also varies under different failure models of soil. The soil settlement is predicted highest using Mohr-coulomb failure criteria (MC) and predicted least by Mohr-coulomb incremental stiffness model (MCI). The soil settlements of a square building (aspect ratio = 1) at raft level are 26.83 cm, 12.97 cm and 23.19 cm respectively in Mohr-coulomb (MC) model, Mohr-coulomb incremental stiffness (MCI) model and hardening soil (HS) model while, the settlements at pile end are 4.16 cm, 1.23 cm and 3.22 cm. For the rectangular structure (aspect ratio = 1.75), the soil settlement is concentrated in the shorter di-rection of the building structure. The contours of soil settlements along vertical cross-section of the soil field for building aspect ratios and soil failure criteria are depicted in Figure 4 and Figure 5.
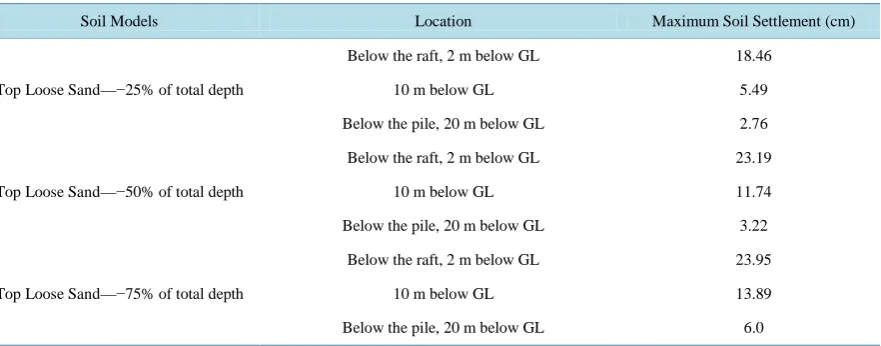
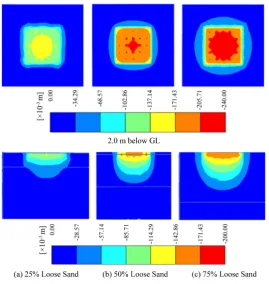
Table 4 presents the soil settlements variation with proportional depth of loose sand layer of the building foundation soil. The contours of soil settlements along vertical and horizontal cross-section of the soil field are shown in Figure 6. It is evident from the results that the maximum soil settlements go on increasing with the crease of depth of loose sand layer below the ground level. The soil settlements are also increases with the in-crease of loose sand layer at same level below the ground level. The maximum soil settlements with different proportional depth of loose sand layer are 18.46 cm, 23.19 cm and 23.95 cm respectively at loose sand depth 25%, 50% and 75% of total depth, while with similar proportional depth of loose sand layer, the settlements at bottom pile end are 2.76 cm, 3.22 cm and 6.0 cm. For different proportional depth of loose sand layer, settle-ment dissipates along the raft sides towards the outer edges of soil field. The change in soil settlesettle-ment is ob-served with lesser stiff layer thickness up to the pile length and more thickness of lesser stiff layer will not affect the soil behavior in piled-raft foundation.
Figure 4. Contours of soil settlements on horizontal and vertical section of square (aspect ratio = 1.0) and rectangular build-ings (aspect ratio = 1.75).
Table 4. Maximum soil settlement of square structure building with loose sand layer (HS) proportional depth.
Soil Models Location Maximum Soil Settlement (cm)
Top Loose Sand—−25% of total depth
Below the raft, 2 m below GL 18.46
10 m below GL 5.49
Below the pile, 20 m below GL 2.76
Top Loose Sand—−50% of total depth
Below the raft, 2 m below GL 23.19
10 m below GL 11.74
Below the pile, 20 m below GL 3.22
Top Loose Sand—−75% of total depth
Below the raft, 2 m below GL 23.95
10 m below GL 13.89
Figure 5. Contours of soil settlements on horizontal and vertical section
of square buildings with soil models.
Figure 6. Contours of soil settlements on horizontal and vertical sec-tion of square buildings with proporsec-tional depth of loose sand (HS)
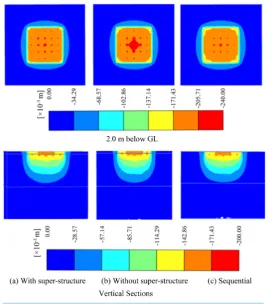
[image:8.595.164.434.403.688.2]Figure 7. Contours of soil settlements on horizontal and vertical section
[image:9.595.107.539.432.592.2]of squarebuildings with mode of super structure loading.
Table 5. Maximum soil settlement of square structure building with mode of super structure loading.
Soil Models Location Maximum Soil Settlement (cm)
Loading through super structure
Below the raft, 2 m below GL 23.19
10 m below GL 11.74
Below the pile, 20 m below GL 3.22
Loading without super structure
Below the raft, 2 m below GL 23.45
10 m below GL 11.6
Below the pile, 20 m below GL 3.25
Sequential loading through super structure
Below the raft, 2 m below GL 22.74
10 m below GL 11.47
Below the pile, 20 m below GL 3.16
5.2. Foundation-Structure Interaction Effect on Piled-Raft Footing
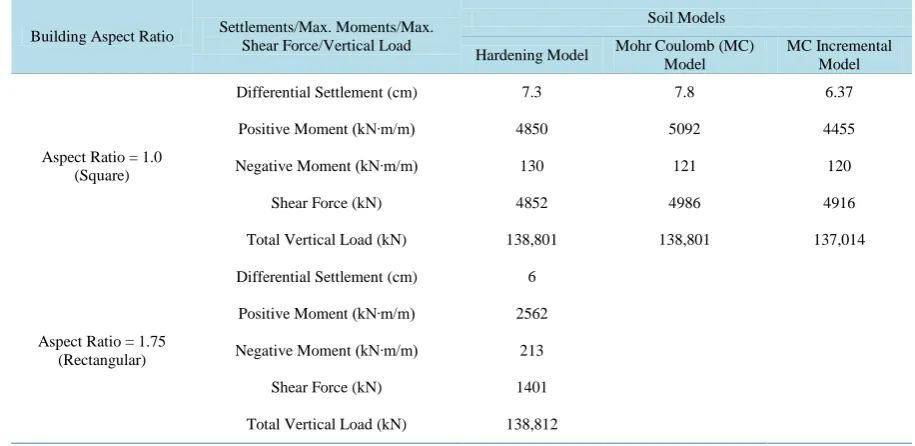
Table 6. Differential settlement, moments and forces in the raft with different soil models and building structure aspect ratio.
Building Aspect Ratio Settlements/Max. Moments/Max. Shear Force/Vertical Load
Soil Models
Hardening Model Mohr Coulomb (MC) Model
MC Incremental Model
Aspect Ratio = 1.0 (Square)
Differential Settlement (cm) 7.3 7.8 6.37
Positive Moment (kN∙m/m) 4850 5092 4455
Negative Moment (kN∙m/m) 130 121 120
Shear Force (kN) 4852 4986 4916
Total Vertical Load (kN) 138,801 138,801 137,014
Aspect Ratio = 1.75 (Rectangular)
Differential Settlement (cm) 6
Positive Moment (kN∙m/m) 2562
Negative Moment (kN∙m/m) 213
Shear Force (kN) 1401
Total Vertical Load (kN) 138,812
with Mohr-coulomb incremental stiffness (MCI) failure criteria. The computed value of raft maximum positive moments are (4850, 5092, 4455 kN∙m/m), raft maximum negative moments are (130, 121, 120 kN∙m/m), and raft maximum shear force are (4852, 4986, 4916 kN) using hardening soil (HS) model, Mohr-coulomb (MC) model and Mohr-coulomb incremental stiffness (MCI) model respectively. The maximum positive moment, maximum negative moment and maximum shear force in the raft obtained from the interaction analysis are 2563 kN∙m/m, 213 kN∙m/m and 1401 kN respectively for building aspect ratio of 1.75.
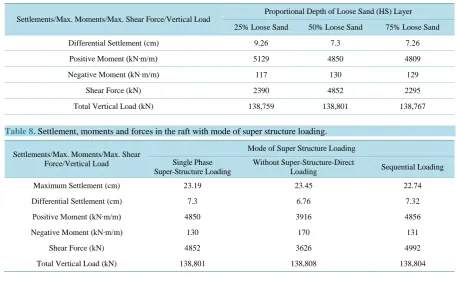
Table 7 and Table 8 show the differential settlement and forces developed in the raft with proportional depth of loose sand and mode of loading to the foundation soil. The results of analysis concluded that the amount of raft maximum and differential settlement varies with different proportional depth of loose sand and mode of loading to the foundation soil. The differential settlement of the raft decreases with the increase of proportional depth of loose sand. The raft forces decreases with the increase of aspect ratio of the building structure. The pre-dicted differential settlement of the raft is highest using Mohr-coulomb failure criteria of soil field and it is least in Mohr-coulomb incremental stiffness model. The lowest value of maximum negative moment in the raft is computed with lower thickness of loose sand layer while the lowest value of maximum shear in the raft is ob-tained with highest thickness of loose sand layer. The computed value of raft maximum positive moments are (5129, 4850, 4809 kN∙m/m), raft maximum negative moments are (117, 130, 129 kN∙m/m), and raft maximum shear force are (2390, 4852, 2295 kN) using 25%, 50% and 75% proportional thickness of loose sand layer re-spectively.
Table 7. Settlement, moments and forces in the raft with proportional depth of loose sand (HS) layer.
Settlements/Max. Moments/Max. Shear Force/Vertical Load
Proportional Depth of Loose Sand (HS) Layer
25% Loose Sand 50% Loose Sand 75% Loose Sand
Differential Settlement (cm) 9.26 7.3 7.26
Positive Moment (kN∙m/m) 5129 4850 4809
Negative Moment (kN∙m/m) 117 130 129
Shear Force (kN) 2390 4852 2295
[image:11.595.92.537.236.367.2]Total Vertical Load (kN) 138,759 138,801 138,767
Table 8. Settlement, moments and forces in the raft with mode of super structure loading.
Settlements/Max. Moments/Max. Shear Force/Vertical Load
Mode of Super Structure Loading
Single Phase Super-Structure Loading
Without Super-Structure-Direct
Loading Sequential Loading
Maximum Settlement (cm) 23.19 23.45 22.74
Differential Settlement (cm) 7.3 6.76 7.32
Positive Moment (kN∙m/m) 4850 3916 4856
Negative Moment (kN∙m/m) 130 170 131
Shear Force (kN) 4852 3626 4992
Total Vertical Load (kN) 138,801 138,808 138,804
the super structure.
5.3. Foundation-Structure Interaction Effect on Super-Structure
Table 9 and Table 10 show the results of interaction of building foundation-structure on the component of su-per-structure (i.e. columns and slabs) due to phasing of construction. The side sways (deflections) and axial loads in the columns are given in Table 9. The axial loads in columns of building are affected by the different mode of loading applied to the foundation soil. The maximum axial loading in the column increases while min-imum axial loading decreases due to application of loading in sequential way. The maxmin-imum side sway or def-lection of the column is increased when applied loading considers the construction phasing. The maximum top side sway in x and y directions for sequential loading to the building structure are 95 mm and 207 mm while deflections for one phase loading to the foundation are 12.2 mm and 43.3. The interaction of the super structure with the raft-foundation-soil will affect the maximum and minimum axial load of the columns. The maximum and minimum axial loads of the columns, obtained by incorporating the super-structure mode of loading to piled- raft foundation-soil model, are (9938 kN, 1768 kN) and (10,244 kN, 1740 kN) for one phase loading and for sequential loading to the building structure respectively while based on the column tributary area, the maximum and minimum axial load of the columns are 7556 kN and 2268 kN.
Table 9. Columns deflection and axial loads with mode of super structure loading.
Top Deflection (mm)/Axial Load (kN)
Mode of Super Structure Loading
Super-Structure Loading Sequential Loading Without Super-Structure Model
Top Deflection (x-dir.) 23.19 23.45 22.74
Top Deflection (y-dir.) 7.3 6.76 7.32
Axial Load (max.) 4850 3916 4856
Axial Load (min.) 130 170 131
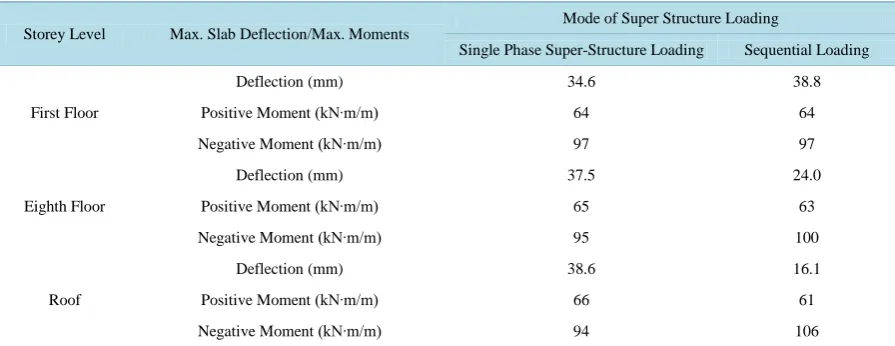
Table 10. Maximum deflection and moments in the floors of square building structure with different mode of super structure
loading.
Storey Level Max. Slab Deflection/Max. Moments
Mode of Super Structure Loading
Single Phase Super-Structure Loading Sequential Loading
First Floor
Deflection (mm) 34.6 38.8
Positive Moment (kN∙m/m) 64 64
Negative Moment (kN∙m/m) 97 97
Eighth Floor
Deflection (mm) 37.5 24.0
Positive Moment (kN∙m/m) 65 63
Negative Moment (kN∙m/m) 95 100
Roof
Deflection (mm) 38.6 16.1
Positive Moment (kN∙m/m) 66 61
Negative Moment (kN∙m/m) 94 106
building are respectively (66 kN∙m/m, 94 kN∙m/m), (65 kN∙m/m, 95 kN∙m/m) and (64 kN∙m/m, 97 kN∙m/m) due to loading through building super structure and while these forces respectively are (61 kN∙m/m, 106 kN∙m/m), (63 kN∙m/m, 100 kN∙m/m) and (64 kN∙m/m, 97 kN∙m/m) due to sequential loading of the super structure.
6. Conclusions
The analysis of combined piled-raft foundation of multi-storey building is very challenging because of complex-ities involved in the interaction between the components of building structure and soil field. The analysis of the tall building structure with complex foundation system in non-uniform (layered soil) soil field should include the interaction of structure-foundation-soil. In this study, the finite element 3D interaction analysis of building structure having piled-raft foundation in two layered non-cohesive soil field is carried out using PLAXIS 3D foundation code. The complete interaction among the soil field depth, soil layer type with foundation and foun-dation with super-structure with different aspect ratio and loading mode has been evaluated. The available lite-ratures on soil-piled-raft foundation analysis are based on direct loading of superstructure on raft and without considering interaction of superstructure and foundation. The foundation soil in piled-raft foundation-soil mod-els without including super structure will be stiffer than modmod-els with the one-phase super structure loading or sequential super structure loading.
[image:12.595.89.537.234.407.2]loading of super structure applied in sequential manner but observed decreasing on upper floors of building structure.
References
[1] Bobet, A. (2010) Numerical Methods in Geo-Mechanics. The Arabian Journal for Science and Engineering, 35, 27-
48.
[2] Hemsley, J.A. (2000) Design Applications of Raft Foundations. Thomas Telford Ltd., London.
[3] Ahmed, M., Mahmoud, H. and Mallick, J. (2013) Advances in Piled-Raft Foundation System. Recent Trends in Civil
Engineering and Technology, 3, 1-8.
[4] Lin, D.G. and Feng, Z.Y. (2006) A Numerical Study of Piled Raft Foundations. Journal of the Chinese Institute of
En-gineers, 29, 1091-1097. http://dx.doi.org/10.1080/02533839.2006.9671208
[5] Rabiei, M. (2010) Piled Raft Design for High Rise Building. Electronic Journal of Geotechnical Engineering, 15, 495-
505.
[6] Singh, N.T. and Singh, B. (2008) Interaction Analysis for Piled Rafts in Cohesive Soils. 12th International Conference
of International Association for Computer Methods and Advances in Geo-Mechanics (IACMAG), Goa, 1-6 October 2008, 3289-3296.
[7] Eslami, A., Veiskarami, M. and Eslami, M.M. (2012) Study on Optimized Piled-Raft Foundations (PRF) Performance
with Connected and Non-Connected Piles-Three Case Histories. International Journal of Civil Engineering, 10, 100-
110.
[8] Kapackci, V. and Ozkan, M.Y. (2012) A Simplified Approach Applicable to the Settlement Estimation of Piled-Raft.
ACTA Geo-Technica Slovenica, 1, 77-84.
[9] Nguyen, D.D.C., Jo, S.B. and Kim, D.S. (2013) Design Method of Piled-Raft Foundations under Vertical Load
Consi-dering Interaction Effects. Computers and Geotechnics, 47, 16-27. http://dx.doi.org/10.1016/j.compgeo.2012.06.007
[10] Horikoshi, K. and Randolph, M.F. (1998) A Contribution to Optimum Design of Piled Rafts. Geotechnique, 48, 301-
317. http://dx.doi.org/10.1680/geot.1998.48.3.301
[11] Cao, X.D., Wong, M.F. and Chang, M.F. (2004) Behavior of Model Rafts Resting on Pile-Reinforced Sand. Journal
Geotechnical Engineering, 130, 129-138.
[12] Cooke, R.W. (1986) Piled Raft Foundations on Stiff Clays: A Contribution to Design Philosophy. Geotechnique, 36,
169-203. http://dx.doi.org/10.1680/geot.1986.36.2.169
[13] Prakoso, W.A. and Kulhawy, F.H. (2001) Contribution to Piled Raft Foundation Design. Journal Geotechnical
Engi-neering, 127, 17-24.
[14] Mahmood, M.N. and Ahmed, S.Y. (2007) Nonlinear Dynamic Analysis of Framed Structures including Soil-Structure
Interaction Effects. The Arabian Journal for Science and Engineering, 33, 45-64.
[15] Al-Shayea, N. and Zeedan, H. (2012) A New Approach for Estimating Thickness of Mat Foundations under Certain Con-
ditions. The Arabian Journal for Science and Engineering, 37, 277-290. http://dx.doi.org/10.1007/s13369-012-0178-5
[16] PLAXIS Version 2012.02 (2012) Scientific Manual, Delft University of Technology & PLAXIS, The Netherlands, A.
A. Balkema, PUBLISHERS. http://www.plaxis.nl/
[17] Ti, K.S., Huat, B.B.K., Noorzaei, J., Jaafar, M.S. and Sew, G.S. (2009) A Review of Basic Soil Constitutive Models
for Geotechnical Application. Electronic Journal Geotechnical Engineering, 14, 1-18.
[18] US Department of Transportation (2006) Federal Highway Administration. Publication No.: FHWA NHI-06-088.
[19] Engin, H.K. and Brinkgreve, R.B.J. (2009) Investigation of Pile Behavior Using Embedded Piles. Proceedings of the
17th International Conference on Soil Mechanics and Geotechnical Engineering. In: Hamza, M., et al., Eds.,
Alexan-dria,Millpress, Amsterdam.
[20] Lebeau, J.S. (2008) FE-Analysis of Piled and Piled Raft Foundations. Ph.D., Institute for Soil Mechanics and