Implementation of PV Cell using Maximum Power Tracking System
Shahbaz Anwer
1Mithilesh Gautam
21,2
Truba College of Science and Technology Bhopal M.P, India
Abstract— This paper to establish a model of photovoltaic system with MPPT function and algorithm. This system is developed by combining the models of established solar module and DC-DC buck-boost converter with the algorithms of perturbation and observation P&O. The system is simulated under different climate conditions and MPPT algorithms. According to the comparisons of the simulation results, it can be observed that the photovoltaic simulation system can track the maximum power accurately using the MPPT algorithms discussed in this paper. P&Q MPPT algorithm possesses fast dynamic response and well regulated PV output voltage. This paper aims to presents the design and development of a photovoltaic system based on the enhanced P&O algorithm that allows improving efficiency, stability and accuracy of solar systems.
Key words: MPPT PV Cell, Buck –boost converter
I. INTRODUCTION
Renewable energy resources play an important role in electric power generation. There are various renewable resources which is used for electric power generation, such as solar energy, wind energy, geothermal etc. Solar Energy is a good choice for electric power generation, since the solar energy is directly converted into electrical energy by solar photovoltaic modules. These modules are made up of silicon cells. When many such cells are connected in series we get a solar PV module. The current rating of the modules increases when the area of the individual cells is increased, and vice versa. When many PV modules are connected in series and parallel combinations we get a solar PV array, which is suitable for obtaining higher power output. The applications of solar energy are increasing, and many Researchers are done to improve the materials and methods used to harness this power source. Main factors that affect the efficiency of the collection process are solar cell efficiency, intensity of source radiation and storage techniques. The efficiency of a solar cell is limited by materials used in solar cell manufacturing. It is particularly difficult to make considerable improvements in the performance of the cell, and hence restricts the efficiency of the overall collection process. Therefore, the increase of the intensity of radiation Received from the sun is the most attainable method of improving the performance of solar power. There are two major Approaches for maximizing power extraction in solar systems. They are sun tracking, maximum power point (MPP) tracking or both. Later on in This paper , two MPP tracking techniques are studied and compared. The first technique is based on artificial neural Networks and the second one is based on the P&O method. Also a complete grid connected scheme is proposed along with a DC-AC inverter control technique based on hysteresis current control. As Traditional fossil fuels are expected to run out in the near future, the world started to rely on renewable energy as a clean, cheap and permanent
II. EQUIVALENT CIRCUIT AND MATHEMATICAL MODEL
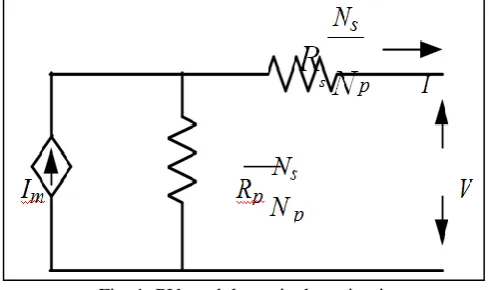
[image:1.595.306.551.188.333.2]Where Rs is the array series resistance, Rp is the array parallel resistance, Ns and Np are the number of series and parallel modules respectively, I and V are the output current and voltage of the array and
Fig. 1: PV module equivalent circuit
III. MOTIVATION
IV. SYSTEM DIAGRAM AND DESCRIPTION
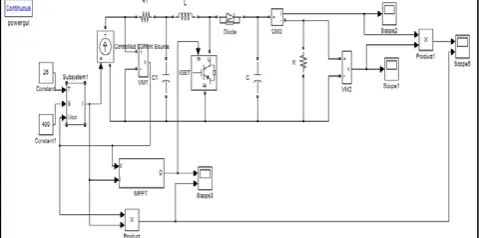
In this chapter, the use of MATLAB with toolboxes to simulate the complete system as seen in Figure 4.1 is described. Initially, sunlight hits the solar panel array. After being recombined in the active region of the solar cell, the electrons flow into a buck converter. The buck converter then lowers the voltage and increases the current. Control of this converter is provided by an MPPT algorithm, which monitors the solar array output and uses the current and voltage measurements from the array to track the highest power output of the array. One such MPPT algorithm will perturb the output setting and then observe by measurement the change in output power. When the power reaches the MPP, the algorithm will stop changing the set point for the duty cycle (D). One of the parameters to investigate how it effects the overall system is the sampling rate and how often the MPPT will change the D of the buck converter. If the sampling rate is too fast, the new D might oscillate around the actual MPP, thereby never extracting the maximum amount of power. On top of that, there might be a transient instability created by not allowing the step response of the output voltage to settle after changing the set point of D.
V. SYSTEM UNDER STUDY
[image:2.595.47.289.621.740.2]The complete system is to be simulated using the MATLAB/Simulink (as shown in Figure 4.1), and by varying the operating conditions (solar irradiance and temperature), both conventional P&O algorithm. The PV array is composed of series and parallel modules respectively with a total output power of 6kW. The algorithm will use the MPP to set the D of the pulse width modulation (PWM) for the buck converter. Under proper conditions, the greatest amount of power is transferred to the load with minimal losses. The losses of efficiency in the system are due to MPP tracking error, buck converter efficiency, and solar cell conversion efficiency. Due to the lack of discrete resistive circuit elements, a buck converter can operate with efficiencies greater than 95% [9]. The total output power of the buck converter delivered to the load should be at least 95% of the input power from the panels. When the panels react to changes in irradiance, there is a disturbance in the set point needed to keep the panels at their MPP. During the time while the algorithm is tracking the new MPP, there is a small amount of inefficiency attributed to tracking error. This error is based on the irradiance, making it a difficult error to account for in the physical world.
Fig. 2: The functional portion of the model under test in Simulink
In simulation it can be quite easy to measure since we can control the illumination of the panel in a controlled manner. The tracking error will be tested in simulation to use as a metric for comparison of the MPPT algorithms. Measurement of the input and output power are the best metric to determine how well the buck converter, MOSFET, gate drive, and MPPT algorithm work together. From this measurement of input and output power, efficiency can be calculated using Equation 1.1.
A. A Modeing of Components under Test
25 and 100 constant supply connected to a PV array is 25-kV grid via a DC-DC boost converter and a three-phase three-level Voltage Source Converter (VSC). Maximum Power Point Tracking (MPPT) is implemented in the boost converter by means of a Simulink model using the 'Incremental Conductance + Integral Regulator' technique. In order to simulate the analog components which are in use for this thesis, we need to use mathematical approximations to what the elements actually do. Without this step, it is difficult to compare these circuits. In MATLAB there are many block sets already created to ease the use of their software environment. By connecting these mathematical models, we are able to simulate the circuit and extract close to real-world data. Once the correct tuning has been done in simulation, the data can then be use the data to instantiate a real-world device.
B. Solar Array
For this component, we created a model of the solar array based onWhere Id is the diode current (A), Vd is the voltage across the diode (V), Isat is the diode reverse saturation current (A), q is the electron charge (1:602 10 19C), k is Boltzmann’s constant (1:381 10 23J=K), T is the junction temperature (K), and e is Napier’s Constant (approximately 2.71828). The cell characteristic at a given irradiance and temperature basically consists of two segments: the constant-voltage segment and the constant-current segment. The current is limited as the cell is short-circuited the maximum power condition occurs at is desirable to operate at the MPP. Ideally, a pure DC current should be drawn from the solar array, though the reduction in delivered power is not very large even in the presence of a fair amount of ripple current. To ensure that the array continues operating at the MPP, a P&O method is used where at regular intervals the amount of current drawn is perturbed and the resulting power out-put is observed. If an increased current results in a higher power, it is further increased until power output begins to decline. On the other hand, if an in-crease in current results in less power than before, then the current is increased until the power output stops increasing and begins to go down. [5] For this simulation, a solar array that could output greater than 100 W of power was selected. This panel has a open circuit voltage Voc of 22 V with a short circuit current Isc of 8:4 A. The voltage at maximum power Vmp is 17:7V while the current at maximum power Imp is 7:6 A. By plugging these values into the knee of the characteristic where the two segments meet. It
Fig. 3: The Current versus Voltage and Power versus Voltage plots
We attain 134:5W of output power from the solar array under full solar illumination. In order to model the varying amount of shading and cloud cover, a profile of illumination was devised that will check the MPPT ’s ability to change set points within a reasonable amount of time. By varying the incident illumination of the solar array as well as the output resistance, we can extract the Current versus Voltage and Power versus Voltage graphs to find the MPP of the solar array, seen in Figure 3. The peak of the Power versus Voltage graph is the MPP. The mathematical model of a diode, was used and integrated with a controlled current source from Sim Power Systems. With this block, the buck converter can modulate the output power. In Figure 5, we can see the Simulink diode model used to generate the current in the solar array model shown in Figure
C. Buck Converter
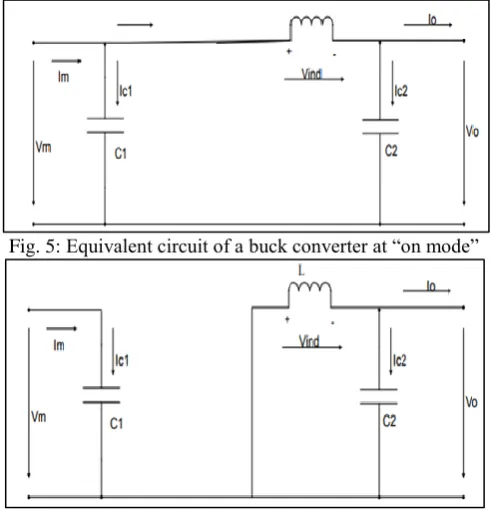
[image:3.595.306.552.103.359.2]A buck converter is used as an electronic power DC-DC device interfacing with the solar panel and the battery load to perform good matching. It uses the output voltage of the solar module as an input parameter and sets it to the desired level while keeping its output voltage fixed. The output operating voltage of a buck chopper is always smaller than or equal to its input voltage. Input and output capacitors, an inductor, a diode and a switch transistor constitute the elements of the buck chopper. The study of the buck converter includes the steady state and dynamic analyses for ideal and non-ideal circuit shown in figure 4
Fig. 4 Buck converter ideal circuit
When the switch in the above figure is closed (on mode where t Є [0, DTs]), no current passes through the diode, which is reverse biased and a current flows via the inductor into the load as seen in Figure 4.3. In the off mode
(t Є [DTs, Ts]), the loop closes through the forward biased diode while the inductor still maintains the flow to the load as seen in Figure 5
Fig. 5: Equivalent circuit of a buck converter at “on mode”
Fig. 6: Equivalent circuit of a buck converter at “off mode”
D. Boost DC-DC Converter
The Boost DC-DC Converter A boost converter is used also as an electronic power DC-DC device interfacing the solar panel and the battery load to perform good matching. It uses the output voltage of the solar module as the input parameter and sets it to the desired level while keeping its output voltage fixed. The output voltage of a boost chopper is always greater than or equal to its input voltage. For better comparison, it uses the same components as the buck converter. The boost converter study includes the steady-state and dynamic analyses for ideal and non-ideal circuits.
VI. STEADY-STATE ANALYSIS
As with the buck converter, the principles of inductor volt-second balance, and capacitor charge balance along with small ripple approximation will be used to determine the steady-state parameters of the boost converter. The equivalent circuit models of the boost converter along with its two states of the switch on and off are displayed in Figures 7, 8, and 9 respectively.
[image:3.595.47.289.583.717.2]A. Boost Converter Model
[image:3.595.306.552.624.748.2]Fig. 8: Equivalent circuit of a boost converter at “on mode”
Fig. 9: Equivalent circuit of a boost converter at “off mode” When the switch is in “on mode” and operating at t = ton= DTs , the input current rises and flows through inductor L and the switch. The magnetic energy stored in the inductor can build up. The output stage is completely isolated because the diode is reverse biased, as shown in Figure 9. When the switch is in “off mode”, at t = toff = D’Ts , the current flowing through the switch will now flow through towards the output stage because the diode becomes forward biased, as seen in Figure 4.8 Moreover, the energy stored in the inductor will be released to the load The boost converter plays very important role as it varies the PV array terminal voltage with the change of the duty cycle. The duty cycle will be determined depending on the signal of the maximum power point tracker whether it is P&O as it is discussed in the following sections Output capacitor. Buck converters are commonly used when the input voltage is too high and needs to be lowered to an appropriate level. A step down converter produces a lower average output voltage than the DC input voltage Vd. Its main application is in regulated DC power supplies and DC motor speed control [4]. The voi waveform in part (b) of Figure 9 is shown as a function of switch position.
B. Simulation Model of Photovoltaic Array
According to the mathematical model of photovoltaic cells. The photovoltaic simulation model is built in Matlab/Simulink, as shown in Fig. 2. The model has three inputs: the input terminal 1 is the ambient temperature input, the input 2 is the light intensity input, and the input 3 is the PV cell operating voltage. By changing the environment temperature and light intensity, the output characteristics of the photovoltaic cells in any environment can be simulated. There was an increase or decrease in power since it was last measured. The incremental conductance is defined as (DIPV =DVPV). By comparing this measurement to the actual conductance of the photovoltaic array, one can determine which side of the MPP the cur-rent operating point is located. “InC can track rapidly increasing and decreasing irradiance conditions with higher accuracy than P&O. One
disadvantage of this is the increased com-plexity when compared with P&O [2] This algorithm has fewer branches for each node and is less complicated than the P&O algorithm’s flowchart; how-ever, the simplicity of the algorithm flowchart does not account for the increased complex-ity of binary calculations required for this algorithm Since calculation of both the InC and conductance requires the use of division, a large amount of processing power is necessary in order to acquire the result before the next sample time. If the calculation to find the InC carries over into the next sample time, the controller will be controlling the buck converter further in the past the longer the system runs. If we have each calculation occur as fast as possible by using more power hungry processors with the hardware to perform division, we will be able to appropriately use the calculations for this algorithm and, thereby, optimize the output power
C. Simulation Results
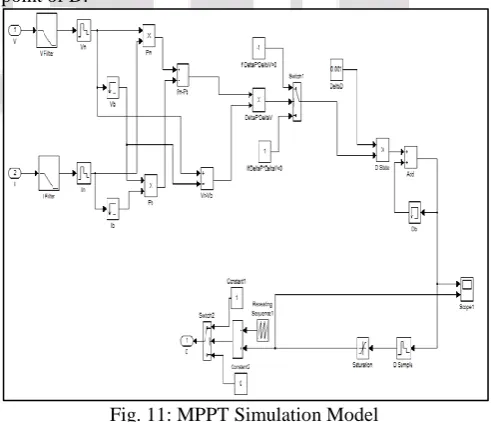
All the discussed elements in this chapter are to be bound together to form a complete integrated grid-connected PV system as seen in Figure 11. This system is to be studied in different cases
D. P&O
[image:4.595.306.552.404.615.2]It is quite easy to tune DD using P&O. Since there is a much longer time between perturbations, approximately 1000 cycles of the simulation, the output power has more time to settle before the adjustments are made to the set point of D.
Fig. 11: MPPT Simulation Model
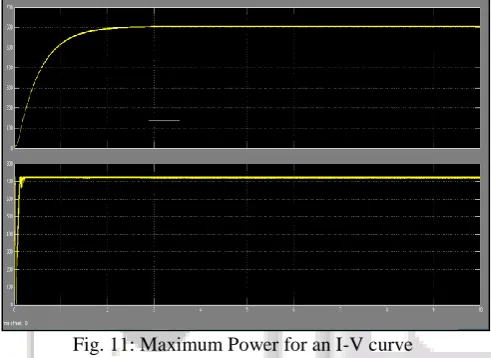
load conditions [4] using MPPT controller in closed loop which is implemented using mat lab function [14]. Here the insulation is 1000 W/ m2. According to the results, computed Pmax is 1132 W, so the tracking efficiency is 96.8%. the proposed method attempts to tracked 1132 W out of available maximum power 1169 W at 250c and irradiance of 1000 W/ m2 (750 W for without MPPT) the proposed method attempts to tracked 1132 W out of available maximum power 1169 W at 250 qC and irradiance of 1000 W/ m2 (750 W for without MPPT). To study the dynamic features of the two-stage CV-IC method versus the IC method, more simulations are performed in the subsequent figures where sudden changes in solar irradiance occur to allow a comparison of the tracking time lengths of both algorithms. Performance analysis when the solar panel is subjected to rapid irradiance changes, that the waveforms at steady state of the solar panel voltage for both algorithms are quite different.
Fig. 11: Maximum Power for an I-V curve
The boosted output voltage waveforms in the PV system using the two-mode CV-IC algorithm provides fewer fluctuations compared to those in the PV system using the IC algorithm. This steady state behaviour is further seen in the waveforms at steady state of the solar output power in Figure11. These simulation results demonstrate that the MPPT using the two-stage CV-IC method gives stable and small oscillations around the maximum power point MPP; thus the proposed MPPT using the two-stage method gives better, steadier performance than the MPPT using the IC method. it can be observed that the MPPT using the IC algorithm still provides some fluctuations around the operating point at steady state. During a rapid decrease in insulation of the PV system from 1000W/m2 to 500W/m2 , the MPPT using the two-stage algorithm gives a faster response, since it reaches its optimal value at 0.0004s (400 µs) than the MPPT using the IC algorithm, which requires much more time to track the maximum 95 power point (460 µs). It has been observed that during a rapid decrease in insolation of the PV system from 1000W/m2 to 200W/m2 , the time taken to track power using the IC method is approximately 0.000242s (242 µs) while the time achieved by the two-stage method is 0.0002s (200µs). Therefore, the MPPT using the two-stage algorithm reduces the convergence time taken to track the MPP and improves the tracking speed response.
VII. PV CHARACTERISTICS
There are three classic parameters that are very important on the PV characteristics namely short-circuit current open-circuit voltage point The power delivered by a PV cell attains a maximum value at the points The short circuit current is measured by shorting the output terminals and measuring the terminal current
Fig, 12: The power of the photovoltaic panel under 1000 W/ m2 insulation and load conditions in open loop
VIII. MAXIMUM POWER (PMAX),CURRENT AT PMAXMAX (VMP)
[image:5.595.45.291.276.455.2]The power produced by the cell in Watts can be easily calculated along the I V sweep by the equation P=IV. At the ISC and VOC points, the maximum value for power will occur between the two. The voltage and current at this maximum power point are denoted as VMP and IMP respectively. The simulation result of the circuit in Figure13 .a shows that the load cannot extract the available power of the PV terminal To overcome this problem, we insert a DC-DC boost converter with variable duty cycle, the interest of this addition is to change the load characteristic which becomes a function of the duty cycle D and allows to move on the solar panel characteristic regardless of the load value. The boost converter is used to raise the input DC voltage to a higher output DC voltage. The DC-DC boost converter circuit is shown in the following schematic Figure8 this boost converter includes one MOSFET that will be controlled through a square wave control signal. The principle of this circuit is the utilization of the inductor at the input of the converter. During the on state, the DC input and the inductor are isolated from the remaining circuit since the diode becomes reverse biased. In this state, the inductor stores energy, so that at the off state, the DC input along with the stored energy of the inductor is applied to the load. The Figure8.b presents the voltage output voltage input and inductor current IL waveforms for continuous conduction,
[image:5.595.309.551.634.756.2]IX. PV MATERIALS
PV cells are made of semiconductor materials with crystalline and thin films being the dominant materials. The majority future other thin film materials are likely going to surpass silicon PV cells in terms of cost and performance following classes: crystalline, thin film, amorphous, multi-junction, organic or photochemical. In this Poly-crystalline silicon technology,
[image:6.595.47.291.387.532.2]The MPPT charge controller is a DC to DC transformer that can transform power from a higher voltage to power at a lower voltage. The amount of power does not change (except for a small loss in the transformation process). Therefore, if the output voltage is lower than the input voltage, the output current will be higher than the input current, so that the product P = V x I remains constant. When charging a battery at Vbat = 13 V, the output current will therefore be Ibat = 100 W / 13 V = 7,7 A. (Similarly, an AC transformer may supply a load of 4,4 A at 23 VAC (4,4 x 23 = 100 W) and therefore draw 0,44 A from the 230 V mains (230 x 0,44 = 100 W)). The simulation output waveform form without and with MPPT block is as shown in figure13. It is clear from waveform that at normal operating condition of PV panel output power changes as the solar irradiance varies. This is the condition when the MPPT block and Boost converter is not present. With MPPT block and Boost converter output power remains at maximum power point even though solar irradiance varies.
Fig. 14: The simulation output waveform form without and with MPPT block
Moreover, to evaluate the performance the proposed MPPT, the PV is exposed to different levels of irradiance that is changed randomly and rapidly although normal solar irradiance does not abruptly, but this would happen in partially shaded PV systems. According to the obtained results presented in Fig. 14, the MPPT algorithm tracks the new values of maximum power. In each case, the power extracted from the PV is well controlled. The results prove that the convergence speed is relatively high. The designed proposes a simple MPPT method that requires only measurements of PV voltage and current with the need to any environmental measurements temperature, irradiance. The method is considered as a modified perturb and observe method. However, the principle difference between the proposed method and any other tracking method is that the proposed method attempts to track and compute the maximum power and controls directly the extracted power from the PV to that computed value. While, any other
method attempts to reach the maximum point by the knowledge of the voltage or the current corresponding to that optimum point. The proposed method offers different advantages which are: good tracking efficiency, relatively high convergence speed and well control for the extracted power thanks to the direct power control unit based on the ON/OFF hysteresis controller
X. CONCLUSION
In this work, an enhanced P&O algorithm has been proposed so as to improve the maximum power point tracking in PV systems. A modified rule for updating the reference variable, i.e. current/voltage or duty-cycle, has been presented. The proposed system offers powerful abilities which are good tracking efficiency, high response, simple user interface, sophisticated control, high processing speed, real time monitoring and good control for the extracted power. The simulation and experimental results have been presented, validating the performance and functionality of the proposed algorithm. The simulations have been achieved using matlab simulator. Finally, a buck DC-to-DC converter, current and voltage sensors and PV panel. The proposed MPPT strategy was tested in simulations and implemented in the developed solar regulator and was observed to perform far better than standard P&O strategy
REFERENCES
[1] B. L. A. da Silva, J.-M. S. Lafay, F. L. Tofoli, and L. S. Scartazzini, “Case study: Hydroelectric generation employing the water distribution network in Pato Branco, Brazil,” in Proceedings of the 10th IASTED International Conference on Power and Energy Systems (EUROPES '11), pp. 50–54, June 2016. View at Publisher • View at Google Scholar • View at Scopus [2] J. T. Bialasiewicz, “Renewable energy systems with
photovoltaic power generators: operation and modeling,” IEEE Transactions on Industrial Electronics, vol. 55, no. 7, pp. 2752–2758, 2016. View at Publisher • View at Google Scholar • View at Scopus [3] P. G. Barbosa, H. A. C. Braga, M. D. C. B. Rodrigues,
and E. C. Teixeira, “Boost current multilevel inverter and Its application on single-phase grid-connected photovoltaic systems,” IEEE Transactions on Power Electronics, vol. 21, no. 4, pp. 1116–1124, 2016. View at Publisher • View at Google Scholar •
[4] S. Lee, J.-E. Kim, and H. Cha, “Design and implementation of photovoltaic power conditioning system using a current-based maximum power point tracking,” Journal of Electrical Engineering & Technology, vol. 5, no. 4, pp. 606–613, 2014. View at Publisher • View at Google Scholar •