Munich Personal RePEc Archive
Decent work in Bulgaria
Beleva, Iskra and Tzanov, Vasil
1 February 2008
Online at
https://mpra.ub.uni-muenchen.de/30568/
NATIONAL REPORT ON DECENT WORK IN BULGARIA
Authors: Iskra Beleva, Senior Research Fellow, PH.D. in Economics Vasil Tzanov, Senior Research Fellow, PH.D. in Economics
Contents
1. Introduction ... 3
2. The economic and social context ... 6
3. Trends in working and employment conditions ... 11
3.1. Employment status/contracts of employment ... 11
3.2. Wages ... 15
3.3. Working time and work organization ... 22
3.4. Working intensity ... 25
3.5. Safety and health ... 26
3.6. Access to training ... 31
3.7. Social dialogue and workers’ participation ... 33
3.8. Social protection coverage ... 36
3.9. Work and family ... 45
3.10. Child labour, forced labour ... 45
4.Linkages, trade-ins and trade-offs between different elements of working and employment conditions ... 55
4.1. Linkages between the elements from the point of view of their direct or indirect interactions ... 55
4.3. Identification of vulnerable groups affected by existing interrelations ... 62
5. Conclusions and policy recommendations ... 64
References: ... 69
List of Tables ... 70
List of Figures ... 70
Annex ... 71
Table 1 – Some macroeconomic and financial indicators (1995-2006) ... 71
Table 2 –Income levels in EURO equivalent (1997-2006) ... 71
Table 3 – Population below, in and over working age in Bulgaria by sex(1990-2006) ... 71
Table 4 – Labour Market Indicators, Bulgaria ... 71
1. Introduction
This Report develops the issue of Decent work in Bulgaria focusing on employment conditions e.g. employment contracts, working time, wages, health and safety at work place, access to training, conciliation of work and family, as well as some specific issues like child labour, in particular. 1
When studying the effects of structural and technological transformations in Bulgaria on decent work environment the authors have paid special attention on the analysis of the interrelations and linkages between the different elements of decent work. Important aspect of the analysis is that of the relevance between some economic and social policies and the achieved progress.
The development of socio-economic and political environment in Bulgaria in the period 1995-2006 outlines stable upward trend of improvement in work conditions. In some segments the improvement had been more visible, while in others – not. Irrespective of this, the ongoing debates on the issues and the more attention, paid by policy-makers on it, should be considered as a first step of the progress. As a second step we have to consider the more consistent and relevant character of the applied policies that were introduced since 2000.
The study includes two parts. In the first it analyses the trends in the development of the elements of decent work in Bulgaria, numbered above. This analysis is based on the available statistics and in some cases it covers the period 1995-2006, but in others – it does not because of lack of regular statistical observations.
The second part of the study deals with some interactions between the elements of decent work. They are analysed taking into consideration their multi-dimensional character and available statistical information. Some of the linkages and trade-offs are metrically assessed (where it is possible), while the others are based on qualitative assumptions and evaluations. As a result the study identifies the main vulnerable groups.
The study ended with some conclusions and recommendations, which followed from the analysis.
The main outcomes of the study are numbered below:
1. The study outlines sequences between the macroeconomic stabilization and the improvement of working conditions. After 2000 the political, social and economic environment became more favourable for developing decent employment conditions. The period of deep transformation of economic rules and actors and significant deterioration in working conditions has been overcome. Since 2000 the country has been facing trends towards improvement and more positive interactions between the studied domains of working conditions. This improvement has been influenced to a high extent by the stable macroeconomic environment, accompanied by the implementation of new legal framework and improvement of the institutional capacity and efficiency. The international experience and assistance in the process of preparing Bulgaria’s EU membership is the second important feature that had positive and
1
creative impact on the rules and conditions of work. Nevertheless, there are still areas where imbalances exist and further efforts are needed.
2. The analysis found out positive trends in working conditions considering labour contracts. More employed people work on labour contracts, which means higher social insurance level, guaranteed labour remuneration and health insurance. These positive trends are results from the improvement of the labour legislation and the better control on its implementation. Meanwhile the dynamic growth in the number of people hired at temporary labour contracts indicates greater flexibility of labour relations; more opportunities for combining several jobs and more opportunities for choosing between working time and time for the family.
3. The caching up process of nominal and real wages has been observed but the real wages do not reached the pre-transition level. This is due to the low relationship with economic development and productivity. The share of employees’ compensations in GDP is relatively low and the real wage is growing at a lower rate than labour productivity. This imbalance between the dynamics of wages and labour productivity indicates the insufficiently effective bargaining at firm level. The relatively weaker positions of the trade union organisations in the social dialogue process are expressed in the low labour remuneration level, the deterioration of labour environment parameters and the increase of professional disease among the employed. The growing labour intensity is an additional factor contributing to the deterioration of the employed people’s health status. The practical changes in the labour environment towards healthier and better labour conditions are slowly implemented although the legislation is in place and institutional network has been established. The preventive measures are an insufficiently developed instrument for protection of the employed.
4. Positive trends in the working time and labour organisation are also monitored. The provision of more legal opportunities for working time flexibility enables the employed people to better balance their personal needs for time and work. At the same time however the low labour remuneration forces most of the people to substitute personal leisure time with more work and this has negative reflection on the health status of the employed people. The employed people often voluntarily ignore the working time limits and labour protection by committing extra work. The labour intensification in a number of cases happens in a hidden form and is not remunerated by the employers.
5. The training of the employed people as a component of labour conditions is underdeveloped. This is no doubt a negative feature and it indicates the still low degree of technological innovation and the insufficient attitude of the employers to invest in human potential. Most of the employed people should invest themselves in their own professional development particularly in the private sector and in the small and medium enterprises. Some groups of the employed people are considerably isolated from the training processes and these are mainly the self-employed people in the agriculture and in the sphere of traditional services.
social services legislation are focus on the improvement of the eligibility criteria aiming for a more adequate coverage of vulnerable groups. Social protection covers the main risk groups of population and shows different tendency of development. More people are covered by the social insurance and employment services, while the coverage of some social assistance programs and unemployment benefits decline. Financial support of the social protection programs has increased. The social expenditures share in GDP and in the State Budget increases. Particularly this concerns expenditures on health care. Despite the positive trends in social protection coverage there is still a need for improvements e.g. the further development and coverage of social services (employment and health services) and social assistance programs.
7. The dynamics of labour conditions indicates the contradictory development of its components. Some of them are characterised with more balanced and steadily increasing development, while others demonstrate less progress as a result of the general economic environment and the deep structural reforms that still cannot be overcome.
8. Differences among the employed people are monitored in terms of labour conditions. These differences are formed based on different principles, however the branch specific is a determinant factor. The age and the sex of the employed people also affect the evaluation of labour conditions.
2. The economic and social context
Quite contradictive economic and social processes occurred in Bulgaria in the period 1995-2006. Beginning the transition with radical changes of the economic environment, e.g. liberalization of prices and trade conditions; privatisation of big state enterprises and liquidation of existing cooperatives in agricultural sector, after 1994 the reform speed slowed down significantly. As a consequence a constructive process did not follow the economic destruction. Thus new job creation had not followed the mass job closure due to privatisation of big state enterprises. Foreign investments by that time were incidental, the development of small and medium-sized business was in its dawn, and the land restoration has just started in agricultural sector. The latter is still an ongoing process, which limits its capacity to create employment. All this caused incredibly high unemployment, which affected more than half a million people and stayed stable at this level up to 2003. Unemployment rate in the period 1995-2000 was over 13%, and employment decrease continued, going down by 300 thousand people for the period.
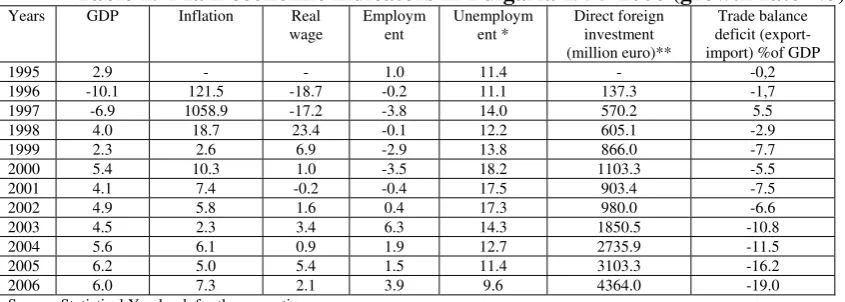
[image:7.595.67.490.427.578.2]In the late 1996 the country experienced crisis in the bank system and hyperinflation. The latter erased the savings of the population and contributed to the further impoverishment of the population. In the mid 1997 the country introduced a Currency Board regime. The effects of the financial restraints were positive and the economy was stabilized. After 1998 the GDP growth upturned. Employment growth followed that of GDP with a lag of two-three years, however, the great collapse of all incomes (wages, pensions, benefits, etc.), as well as the exhausted households and state financial resources, influenced the social development. The polarization of the society has increased.
Table 1. Main economic indicators in Bulgaria 1995-2006 (growth rate -%)
Years GDP Inflation Real wage
Employm ent
Unemploym ent *
Direct foreign investment (million euro)**
Trade balance deficit (export-import) %of GDP
1995 2.9 - - 1.0 11.4 - -0,2
1996 -10.1 121.5 -18.7 -0.2 11.1 137.3 -1,7 1997 -6.9 1058.9 -17.2 -3.8 14.0 570.2 5.5
1998 4.0 18.7 23.4 -0.1 12.2 605.1 -2.9
1999 2.3 2.6 6.9 -2.9 13.8 866.0 -7.7
2000 5.4 10.3 1.0 -3.5 18.2 1103.3 -5.5
2001 4.1 7.4 -0.2 -0.4 17.5 903.4 -7.5
2002 4.9 5.8 1.6 0.4 17.3 980.0 -6.6
2003 4.5 2.3 3.4 6.3 14.3 1850.5 -10.8
2004 5.6 6.1 0.9 1.9 12.7 2735.9 -11.5
2005 6.2 5.0 5.4 1.5 11.4 3103.3 -16.2
2006 6.0 7.3 2.1 3.9 9.6 4364.0 -19.0
Source: Statistical Yearbook for the respective years. *Registered unemployment
**www/bnb.bg
The improved macroeconomic environment after 1998 was more favourable for social and labour market development. The upward economic growth after 2000 (by average 5%) contributed for increase of the employment by nearly 3% average per year after 2002. The economic growth and the more job opportunities absorbed unemployment, which decreased double to a level of 9.6% in 2006. Moreover, nowadays the country faces labour shortage in many branches and skills.
that the stability of the economic development made it more predictable, so as employers could have more strategic views of the business development and respective needs of labour.
Despite the progression in macroeconomic development the worrying tendency is the growing deficit in trade balance. The percentage of trade deficit in GDP increased over three times in comparison to 2000 and reached almost one fifth of the GDP in 2006. This circumstance creates unfavourable environment for improvement of working conditions and social protection policy.
The economic turbulences in the period 1995-2000 were not a favourable environment for focusing the tax policy on improving labour market and work conditions. After 2000 tax policy became more consistent and better targeted in this respect. Several measures should be mentioned: (a) decreasing tax burden on labour was one of the important tax measures in the efforts of the policy-makers to encourage the employers to open more jobs and to increase employment; (b) significant decrease of corporation tax after 2000 from 19% to 15% and then to 10%; (c) introduction of specific regional preferences for employers who invest in regions with unemployment level higher the average for the country.
Another form of tax relief referred to income taxation, where the scale and income burden were restructured, so as to increase the disposable income. Family income taxation was also introduced as stimuli for childbirth and relief of family incomes depending on the number of children. The social insurance taxation (social insurance, health insurance and unemployment fund) continues to follow the undertaken policy of sharing taxation between employers and employees towards gradual equalization of these payments. Tax relieves were also introduced for self-employed people.
After 1997 radical changes occurred in the social insurance system. The introduced three-pillar system aimed at increasing the social protection of employed people by mixing the mandatory social insurance (I pillar) with supplementary insurance funds (II pillar – for people born after 1959) and voluntary form (III pillar).
The introduction of policy measures, which encourage the beneficiaries to participate on the labour market and to be active in employment reintegration, was an important aspect of labour market policy concerning flexibility and decent work. Thus, unemployment and social benefits were linked more closely to participation in active measures, and especially in training and education. Family social allowances were also more closely linked to beneficiaries’ behaviour regarding employment and adjustment to market demand.
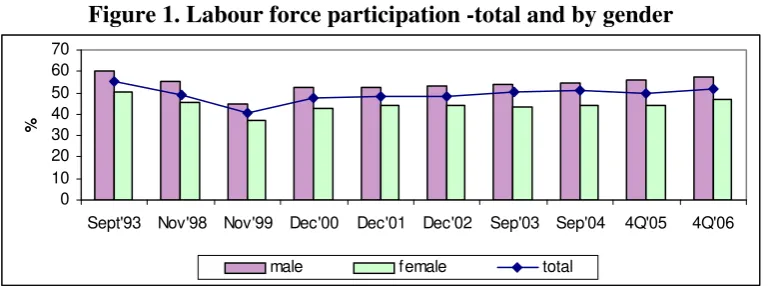
Figure 1. Labour force participation -total and by gender
0 10 20 30 40 50 60 70
Sept'93 Nov'98 Nov'99 Dec'00 Dec'01 Dec'02 Sep'03 Sep'04 4Q'05 4Q'06
%
male female total
Source: LFS for respective years, NSI.
Labour in Bulgaria continues to be paid at a relatively low level compared with EU level, although since 2000 the income policy has been consistent and focused on gradual increase of labour incomes. Some of these policies include regular increase of minimum payments; increase of social insurance thresholds, further development of social protection policy by improvements of pension system and social assistance. The better economic environment reflected also the rate of growth of real wages. The significant erosion of real incomes, and wages in particular, was one the main negative feature of the transition. Although wage level in Bulgaria continues to be one of the lowest in the EU, during the last five years there was a stable upward tendency. This increase could be considered a result of the quite consistent income policy of the governments in force since 2000. At a micro level the growth in real wages reflected the changes of employers’ attitude due to the understanding that wage level is an important tool to keep the workforce. This understanding was strongly provoked by the processes of liberalization of labour migration (e.g. waiving visa regimes) and especially after the accession of the country in EU.
The more favourable economic environment and better performing labour market create more options both for employers and employees. Flexibility could be considered one of the options both for employers and the employees. There are a number of indications for increasing labour market flexibility in the period 1995-2006, and especially after 2000. One of them is the implementation of more flexible forms of employment, which allow employers to increase their productivity and to keep competitiveness on the market by more flexible usage of the workforce. The more flexible forms of employment in some cases could be considered a good option for employees who prefer such employment due to different reasons. Indisputably, the implementation of more flexible forms of employment had contributed to reduction of the unemployment. However, more flexible employment corresponds with less secure employment. The more flexible employment corresponds also with employment, which does not ensure stable incomes that could significantly improve household’s welfare.
The factors that influenced negatively the social and labour market development during the studied period referred to the demographic problems Bulgaria suffered, as well as increasing emigration of labour.
[image:10.595.81.516.178.339.2]The demographic trends point out long downturn tendencies, which indicates decreasing inflows in the labour market and aging of the Bulgaria population.
Figure 2. Some demographic trends in Bulgaria
-10 -5 0 5 10 15 20
1990 1991 1992 1993 1994 1995 1996 1997 1998 1999 2000 2001 2002 2003 2004 2005 2006
Birth rates Death rates Natural growth
Source: Statistical Reference Book for respective years, NSI, Sofia.
The aging of the population in Bulgaria, as in many European countries, presupposed changes in the labour force structure in mid and long run, as well as changes in the pattern of consumption and public services. This fact should not be neglected, since the adjustment to the new demographic conditions will need time and relevant preparatory economic and social reforms. Several steps were undertaken in Bulgaria after 2005 as a reaction to the negative impacts of the demographic development on social and economic development: public debates on the fact, social and economic analysis and preparation of National Strategy for Demographic Development (2006-2020)2 and relevant operational documents, e.g. annual action plans.
According to some studies the negative demographic trends should be even more serious, taking in consideration the dimensions of external emigration and its structure.3 Data point out that for the period 1989-2001 the balance of external migration flows was negative by 670 000 people. The outlined profile of potential emigrants identified that nearly half of them were young, well educated people. Additionally, the long-term negative effects of emigration will be accelerated by the fact that through emigration Bulgaria is consuming an “export” of women in fertile age, which leads to lower level of future birth rate in the future.4
2
National Demographic Strategy of the Republic of Bulgaria 2006-2020, http://www.mlsp.government.bg/bg/docs/demography/Dem
3
Demographic Development of Republic of Bulgaria, Bulgarian Academy of Science, National Statistical Institute, UN Population Fund, Sofia, 2005, p. 113-117.
4
Figure 3. Population trends by age groups in Bulgaria
21,4 13,5 53,5 11,6
19,0 14,5 52,3 14,3
15,1 14,0 54,1 16,8
12,0 12,5 55,5 20,0
10,7 10,0 56,0 23,3
0% 20% 40% 60% 80% 100%
1985 1992 2000 2010 2020
65+
25-64 15-24 0-14
Source: National Demographic Strategy of the Republic of Bulgaria 2006-2020
Concerning the economic and social infrastructure that had influenced labour market development, and working conditions in particular, we have to mention also the progress in building up and improvement of institutional, legal and human capacity. In this respect the progress in the period 1995-2006 should be classified as significant. This was a period of building up the institutional and legal frame of social and labour market policy and in the period of pre-accession of the country to EU – a period of harmonization of both frames to the EU requirements. In the period 2005-2007 the Council of Ministers approved 18 legal acts in the sphere of working conditions and child labour protection. The capacity of the human capital was also developed, as well as the administration of the applied policy. Training of the central and local staff became an integral part of the administration policy. At present the capacity of the staff to manage effectively the programmes of applied labour market policy should be considered as quite sufficient.
In conclusion we shall outline the following more specific findings:
There is a relation between the economic and social environment and the labour conditions.
The upward economic development favours the improvement of all element of decent work;
There are still factors limiting working condition development e.g. financial restrictions and negative demographic factors;
Decent work issues has become more debated in the society and attracts much the attention of policy-makers;
The good practices that were introduced in the country by foreign investors stimulated the improvement of labour conditions.
3. Trends in working and employment conditions
3.1. Employment status/contracts of employment
The Bulgarian labour legislation distinguishes several types of contract: (a) labour contract, civil contract, other contract. (b) depending on the duration of the contract there are
permanent and temporary contracts. (b) the third grouping follows from the length of working time fixed in the contract and in this case there are full-time and part-time labour contracts.
In the context of job security/insecurity employment status, identified by the type of employment contracts, could be provisionally divided in three groups:
(a) employment under labour contract on permanent job and on full-time. It is considered the most secure form of employment.
(b) employment under a combination of the pointed three forms of contract, e.g. under labour contract but temporary and on part-time, or under labour contract but temporary on full-time, or under civil contract on permanent and full-full-time, etc. This could be classified as less secure but more flexible.
(c) all other forms of contract that are associated with lower level of security. This could be named non-standard form of employment. The group of people, who declare in Labour Force Survey that they do not have written contract should also be taken into consideration here.
The division is provisional since at this stage of the analysis we do not discuss the reasons causing the acceptation of one or another form of employment. This means that some people may have personal preferences to have non-standard employment (less secure) instead of standard (more secure).
Bearing in mind the above, during the period 2000-2006, for which data are available, employment security in Bulgaria has increased. This statement follows from several facts:
¾ More employees became employed under labour contract (95.5% of total number of employees in 2006, compared with 86.8% in 2000).5
5
Figure 4. Employment by type of labour contract in Bulgaria
0% 20% 40% 60% 80% 100%
4/00 4/01 4/02 4/03 4/04 11/05 2006
incl:labour contract civil contrct other contract with out written contract
Source: LFS for the respective years, National Statistical Institute.
¾ More employed people in 2006 have full-time employment (96,8% of total), compared with 2001 (95,8% of total). This fact points out, that the economic progress in the last six years had positive effects on full time employment. (Table 2).
¾ From a gender point of view the data outline that male full time employment had increased in the period 2001-2006 by 6,5 percentage points, while female full time employment increased by 4 percentage points for the same period. It could be said, that the increase in male full time employment was due to some extent on the decrease of part-time employment since male part time employment for the period decreased by 1 percentage points. The increase of female part time employment was mainly due on the increase of total female employment.
Table 2. Full-time, part-time employment in Bulgaria – total and by gender
(numbers)
Employed people Full time Part time Not classified
Male Female Male Female Male Female Male Female
Dec01 1371,5 1256,6 1241,3 1165,7 28 35 102,2 56
Dec02 1419,7 1284,7 1312 1206,9 20 27,7 87,7 50
Dec03 1497,7 1327,9 1362,5 1233,8 22,5 27,5 112,7 66,6
Dec04 1545,6 1366,3 1430,6 1295,4 25,9 29,4 89,1 41,4
Dec05 1596,7 1385,7 1489,1 1307,3 24,3 31,8 83,3 46,6
Dec06 1390,8 1310,7 1348,7 1268,4 13,9 27,4 28,2 14,9
Source: LFS for the respective period, National Statistical Institute.
¾ Both permanent and temporary employment increased because of increase in total employment. However, the trends of increase of temporary employment, compared with permanent one, were higher (by 79.7% for the period 2001-2006, while permanent employment increased by 23.4%).
[image:13.595.68.509.514.623.2]Figure 5. Permanent and temporary jobs in Bulgaria
0 500 1000 1500 2000 2500 3000
Dec2001 Dec2002 Dec2003 Dec2004 4'Q2005 2006
th
ousand people
0 50 100 150 200 250 300 350
th
ousand people
Permanent contract (left scale) Temporary contract (right scale) not classified (right scale)
Source: LFS for the respective period, National Statistical Institute.
¾ Within these three clearly outlined trends we observe also an increase in the combination of variable form of contracts indicating expanding flexibility in employment, e.g. increasing employment under labour contract on full-time but temporary as duration.
¾ Irrespective permanent or temporary full-time employment dominated (covering 96.9% of total employment in 2006). It increased by 20.6% during the studied period, compared to only 8.1% increase of part-time employment.
¾ Looking on the third group, the less secure employment, e.g. work without written labour contract, under temporary contract and on part-time, we identified the following:
(a) Work without written contract in 2006 was most widespread among men; among people in age group 25-34 years old; among people with upper secondary vocational education or lower secondary; among employed in the private sector and mainly in services.
(b) Mainly men, employed in the private sector, presented the profile of employed under temporary contract.
(c) Among employed people on part-time basis prevailed women, as well as employed in the private sector. Meanwhile, 61.1% of part-time employed declared that they would like to be full-time employed people.
Self-employment in Bulgaria should be considered a specific form of employment closer to non-standard form. Decreasing as a share in total employment (7.9% in 2006, compared to 9.5 % in 2000), self-employed people numbered almost 250 thousand people. Among them the proportion men/women was 2/1. Self-employed people are evenly spread between urban and rural areas and among them the ones with upper secondary education prevailed. The decreasing number of self-employed people after 2003 confirms some previous studies, pointing that self-employment is mainly a surviving strategy.6 As soon as economic conditions improved and demand for labour increased, many self-employed people passed to employees, a more stable and secure status in employment. It was commonly recognized that self-employed people survived in the market competition because they avoid payment of social and health insurance as well as many other taxes. The more strict current control presses them, so, for many of the self-employed people the dilemma whether to change their status and become employees with social and health insurance, or to continue to be self-employed in condition of increasing competition, was decided by a change in the employment status. However, for the reminder of the self-employed people the issue of safety working conditions continue to be a problem.
Another group to be mentioned is that of the unpaid family workers. In 2006 this group was about 1.2% of total employment or almost 40 thousand people. In the group profile women; unpaid family workers in age between 25-54 years; mainly people with lower secondary education as well as people living in rural areas, predominated. In the period 2000-2006 this group had been decreasing both in number and as share in total employment. The decrease could be associated with the better opportunities the market offers regarding payment, security, working conditions, etc.
There are many other evidences that confirm the increasing stability and security in employment, e.g. the increasing social security revenues. Following the data provided by the National Social Insurance Institute, the number of social insured people had increased from 2216 thousand people in 2003 to 2518 thousand people in 2006, and that of insured self-employed people – from 177,8 thousand in 2003 to 228,7 thousand in 2006.
The role of General Labour Inspection in increasing employment security and stability should not be neglected. Together with other institutions the number of controls has increased from 1792 cases in 2005 to 2821 cases in 2006. The number of consultations given to newly registered employers also increased from 60008 in 2005 to 61482 in 2006.7
Meanwhile, the debate in the society regarding illegal economic activities and respective illegal employment continues to be quite active, provoked by permanent budget shortages. According to some studies, illegal employment was 3.5-3.7% of total employment in the period 2002-2004; undeclared working places – 2.1-2.6% of total number of working places, and unpaid social insurance were 3.9-4.1% of total social insurance. About 10% of social insurance concerning basic labour contracts had not been paid to the National Social Insurance Institute and about 70% of that for second job contract.8
6
Beleva, I., V. Tzanov. Bulgaria: Towards a Better Balanced World of World? – In: Eyraud, F., D. Vaughan-Whitehead (ed.), The Evolving World of Work in the Enlarged EU, Progress and Vulnerability. ILO, Geneva, 2007, p. 59.
7
Annual Report of the General Labour Inspectorate, 2006, http://git.mlsp.government.bg/
8
As far as other forms of employment is concerned, e.g. seasonal employment, employment through interim agency, on call contracts or by assignments, multiple jobs, etc., there is very limited and fragment information, which does not allow a representative conclusions to be reported.
Meanwhile, the Annual Report of the General Labour Inspection points out that in 2006 the violations in the sphere of labour relations continue to be a problem in view of type of contract, duration of working time, payment of extra working time, etc. This report points out e.g. that Food processing industry had a number of violations due to replacement of labour with civil contract. In this way employers avoid or decline social insurance taxes. Another violation that was pointed out is that employers continued to pay less than the minimum level of wage. Violation is also when employers keep people officially on lower staff positions, thus insuring them at lower social insurance thresholds. This is one way to reduce social insurance expenditure on behalf of employees.
Summarizing the most significant features regarding employment status based on type of contract we shall outline:
¾ The increasing trends in the development of more secure forms of contracting e.g. employment under labour contract, permanent employment on full time;
¾ However, there are also evidences that labour relations are becoming more flexible and thus - to some extend insecure;
¾ Although, both employers and employees have more legal opportunities to choose the forms of employment and contracting;
¾ The development of atypical forms of employment e.g. self-employment, unpaid family workers etc. complicates additionally the picture regarding the types of labour contracts.
3.2. Wages
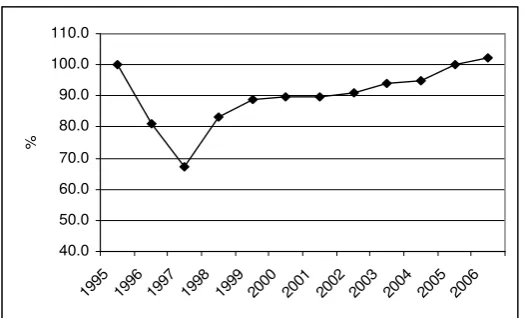
[image:16.595.167.430.582.741.2]Bulgaria is one of the EU countries, which can be recognized by a relatively low wages level. Average monthly wage in 2006 is 178 Euro. At the same time, as a result of the restrictive income policy, the real wage considerably decreases during the first half of 90s. There is a change in the income policy after 1997, which leads to gradual increase of nominal and real wages (Fig 6).
Figure 6. Real wage dynamics, 1995-2006, Index 1995=100
40.0 50.0 60.0
1995 1996 1997 1998 1999 2000 2001 2002 2003 2004 2005 2006
70.0 80.0 90.0 100.0 110.0
%
The catching up process is seen in increase of the real wage with about 52% after the strong erosion in 1996-1997. Its purchasing power in 2006 reaches the 1995 level but it is far way from the pre-transition level. This positive trend is a result mainly from three factors: change of the wage policy from restrictive to stimulating (abolished the tax-based income policy, significant increase of the minimum wage, gradual increase of salaries in the budget sphere); the introduction of Currency Board in 1997, which decreased the inflation below 10%; and the continuous economic growth (annually 4-6%).
The impact of economic development on the real wage dynamics can be assessing as moderate. Real wage growth in the most years of the period is strongly below the GDP rates. This means that wages did not follow the productivity particularly after 2000 (Fig. 7). Annual changes in productivity significantly exceed the real wage rates (Fig. 7A) and suggest for a low relationship between them (Fig. 7B). The scatter diagram between changes in productivity and real wages shows great disparity in the linkages and no well defined trend. This finding is confirmed by the low coefficient of correlation (0.24).
[image:17.595.73.516.460.661.2]The great disparity of the linkages between productivity and real wages can be observed on the sector and branch level. There are only a few sectors where wages grow more than productivity. For the period 2000-2004 these were “Trade” and “Electricity, gas and water supply”. Real wages in the “Trade” sector increased by 11.6%, while productivity grew by 7.9%. In the sector of “Electricity, gas and water supply” there was a positive real wage growth (6.3%) versus negative productivity changes (-3.1%). Higher differences between productivity and wage growth can be observed in the opposite situation (where productivity exceeds wage growth). For example, during the same period, productivity increases several times more than real wages in Mining and quarrying industry, Transport and Manufacturing.
Figure 7. Productivity and Real Wages, 1995-2006
A. Productivity and Real wage dynamics B. Relationship between productivity and Real wage (annual rates) changes, 1998-2006
-25.0 -20.0 -15.0 -10.0 -5.0 0.0 5.0 10.0 15.0 20.0 25.0 30.0
1995 1996 1997 1998 1999 2000 2001 2002 2003 2004 2005 2006
%
Productivity Real wage
-5.0 0.0 5.0 10.0 15.0 20.0 25.0
-5.0 0.0 5.0 10.0 15.0
Productivity (rates)
R
ea
l w
ag
e
(
rat
es
)
Source: Statistical Yearbook, NSI, Respective years.
of wages in both sectors is almost identical (nominal wage at the public sector increases by 91.5%, whereas at the private – about 89.3%).
Distribution of wages by economic sectors is even more differentiated. Branches with highest remuneration (Financial intermediation, Mining and quarrying, Electricity, gas and water supply) keep their leading position – the increase of average wage there is higher compared to the country average. Lowest wages are observed in Agriculture, some of the industry sub-sectors (Manufacturing) and services (Hotels and restaurants, Trade, repair of motor vehicles and personal and household goods). Increase of the average wages in these sectors is below or near to the country average. The main tendency of wages differentiation by economic sectors increases slightly. Measured by the variation coefficient it increases from 0.4 in 2001 to 0.43 in 2006.
Regional differences in labour remuneration at NUTS 2 level are not considerable. The average wage increases uniformly in all regions within the period 2000-2005, which implicates keeping of the wages relative structure.
The low labour remuneration and strong erosion of wages force the employed to search income from additional employment. Types of employment, most often used, are second, part-time employment, working under civil contract and so on. Household’s budgets statistics illustrates although in general, the size and dynamics of this process. The share of income from additional employment within the total monetary income increases up to 1999 (from 4.3% in 1995 to 6.6% in 1999). The tendency of decrease is observed after 1999 (in 2006 it reaches 4.5%). The number of household members as well as of the working members influences additional employment. Share of income from additional employment is highest for one-member households. It declines in parallel to the decrease of household members. Similar dependency is observed at increase of the working members also. The share of additional remuneration is higher in case of one working member than in case of more working members.
Figure 8. Share of employee compensations in the GDP and GDP rates (1995-2006)
25 27 29 31 33 35 37 39 41 43
1995 1996 1997 1998 1999 2000 2001 2002 2003 2004 2005 2006
%
0 5 10 15 20 25 30
%
Share of employ ees compensation in GDP GDP change in current prices
Source: Statistical yearbook, NSI, Respective years.
A possible explanation is the low connection of wages with the economic performance (productivity) and compensation for inflation. Between 1995 and 1997 Bulgarian economy enter into a deepest economic crises with higher inflation. The GDP in current prices grew about 1880%, while the compensation of employees about 1497%. This led to significant fell of wage share in the GDP (from 42% in 1995 to 34% in 1997). The reason is mainly due to the inadequate compensation of wages for inflation. The situation has been improved in the next two years (1998-1999), when more output of the economy was distributed as an overall income of employees. This is a consequence of the combination of two input factors: productivity growth (8.9%) and higher wage compensation for the inflation in 1997 (nominal gross wages has increase about 60.5%). During the period 2000-2003 there was no change in the distribution policy to the factors that have provided output creation. GDP and wage share grew in same proportion despite the declining of GDP rates. In the last three years of the period (2003-2006) workers received less proportion of the output. Between 2003 and 2006 GDP increased about 42.1%, while compensation of employees 31.5%. Higher proportion of GDP growth was distributed to the gross operating surplus and mixed income (the former grew about 38.4%).
Minimum wage is the officially lowest level of labour remuneration in the country and is determined through a government legal act after consultations with the social partners. Thus it is one of the government’s instruments for implementation of the incomes policy and influencing labour remuneration.
The number of employees at minimum wage is not high. Proportion of full-time employees with earnings on the minimum wage is 5.1% for 2002. There is not statistical information how this proportion has changed over time.
Table 3. Real minimum wage dynamics and proportion to the average wage and Guaranteed Minimum Income (GMI), (1995-2006)
(%)
1995 1996 1997 1998 1999 2000 2001 2002 2003 2004 2005 2006
Real minimum wage, Index 1995=100
100.0 90.0 64.2 63.6 77.7 83.0 97.9 92.5 99.4 102.2 121.6 120.9
Ratio MW/AW 38.1 42.2 36.4 29.2 33.3 35.3 41.7 38.8 40.3 41.0 46.3 45.1 Ratio GMI/MW 58.0 58.2 59.3 60.6 55.7 47.2 40.0 40.0 36.4 33.3 33.6 34.4
Source: Ministry of labour and social policy.
The faster growth of minimum wage in comparison to the average wage and Guaranteed Minimum Income (basic income for determination of the social assistance payments) has two opposite effects. It shortens the gap to the average wage and increase the distance to the social assistance payments. The proportion of minimum wage to the average wage has increase and reached over 45%, whiles the proportion of GMI to the minimum wage decline and comprises one third of the minimum wage in 2006. The growing distance between minimum wage and GMI is a stimulus for the social assistance beneficiaries in working age to participate in the labour market. Elder people in the social assistance system are more protected by the higher individual coefficients of entitlement.
The minimum wage growth in the last years is a result from the changed incomes policy. Thus the government aims at influencing not only a limited number of workers but also the overall remuneration structure. The minimum wage increase may push upward the other wages.
The relative wages’ criterion could be used as definition for low remuneration besides minimum wage. Those workers, who receive the lowest labour remuneration compared to the average level, may be qualified as having low labour remuneration.
[image:20.595.105.487.552.639.2]The economic sectors and activities with the lowest labour remuneration in the last 7 years are: the processing industry (textile and clothing, leather industry), agriculture and hotels and restaurants (Table 4).
Table 4. Relative structure of wages among the economic activities with lowest remuneration, 2000-2006 (percentage to the average country wage)
Economic activities with the lowest
remuneration 2000 2001 2002 2003 2004 2005 2006 - Agriculture, forestry and hunting 80.5 77.3 74.6 74.2 73.9 72.1 71.5 - Trade, repair of motor vehicles and
personal and household goods 69.8 70.0 73.6 74.4 77.4 74.6 - Hotels and restaurants 62.3 62.5 60.0 59.4 58.8 62.5 64.8 Source: Statistical Reference Book, National Statistical Institute, 2004.
Several aspects of the inequality in labour remuneration could be examined. Depending on the statistical information available, the inequality in labour remuneration in present survey will be analysed in respect to economic activities, professions and education.
Inequality in the labour remuneration, measured as a ratio between the economic activity, where wages are highest and the activity, where are lowest, changes considerably during the last 10 years. It varies within the relatively narrow interval (3.5-4.5 times) for the separate years. Economic activity, where the wages are highest is manufacture of coke and refined petroleum products and the lowest wages are registered at manufacture of textile and textile products.
Differences in wages in respect profession also are not considerable in 2002. Highest is the remuneration of managers and professionals. Lowest remuneration is observed for unskilled workers and employed in services, trade and security. Difference between the wages of managers and unskilled workers is 3.4 times.
Discrepancies are even smaller concerning the educational level. Highly paid are employed with university education and scientific degree “Doctor” (Ph.D. holders) and lowest remuneration receive workers with primary education. The difference is only just 2.2 times. Thus, the education in Bulgaria proves to be insufficient for differentiation of remuneration. Different aspects of discrimination in labour remuneration could be examined (between men and women, between ethnic groups and so on). According to the gender differences the average earnings of male workers are higher than earnings of female paid employees. The gender pay gap indicator as a measure of the difference between men and women in average gross hourly earnings performed a downward trend during the period 2001-2006. The proportion of average gross hourly earnings of male and female workers in average gross hourly of male employees has changed from 22% in 2001 to 14% in 2006. The wage gap between public and private sector fluctuated around 17-21%. The proportion of average total gross wage (public and private) into the average male gross wage increased from 18% in 2001 to 21% in 2004 and went down to 17% in 2006. It is difficult to explain the overall reduction of the gander pay gap on the ground of the available statistical information. A possible explanation is the faster wage growth in sectors and branches where most of the employees are women. In this aspect the role of collective bargaining is positive. It concerns mainly the health and education sectors where average gross wages increased by 72% and 63% respectively during the period 2001-2006.
Table 5. Wage structure by economic sectors in 2004 (%)
Wage components
Total Mining and quarrying
Manufacturing Electricity, gas and water
Finance Administration Education Health and social services
Total wage 100.0 100.0 100.0 100.0 100.0 100.0 100.0 100.0 Basic wage for
worked time 69.4 58.1 72.9 56.3 74.3 60.6 58.9 52.7 Additional
payments (premium and
over norm) 7.9 6.0 5.1 12.9 9.7 15.9 9.9 15.9 Remuneration
for vacancies 8.5 10.1 7.9 10.4 6.3 8.4 14.9 8.7 Additional
payments for working
conditions,
including: 14.2 25.8 14.0 20.4 9.7 15.0 16.3 22.7 For over time 0.8 1.4 1.3 1.7 0.8 0.3 0.2 1.1 For shift
work 0.6 2.6 0.9 1.3 0.0 0.0 0.0 1.1 For
unfavourable working
conditions 0.7 3.3 0.9 2.5 0.0 0.2 0.1 0.8 For seniority 9.2 11.8 8.7 11.7 8.4 12.9 12.9 9.7 Other 2.8 6.6 2.2 3.1 0.5 1.7 3.0 10.0
Source: National Statistical Institute.
Share of benefits for unfavourable working conditions, over-time worked, long-term employment at the same employer (seniority bonuses) and others represent the highest percentage of the flexible part of wages (14.2%). Fluctuations among sectors are not so high. The biggest part amongst them is seniority bonuses (average 9.2%). Compensations for unfavourable working conditions, over-time worked and shift work is below 1 per cent. Among these compensations the payments for over-time worked are highest. This is a result of the increasing number of working hours in some sectors and branches (see section “Working time and work organization”).
The following conclusions can be drawn based on the survey results:
• There is a catching up process of real wage in the last 10 years but it is still below the pre-transition period;
• Low binding between wages and GDP. The share of wages in GDP is relatively low and shows tendency of decrease during the last years;
• Workers in Bulgaria receive some of the lowest wages in Europe. Along with the considerable erosion of real wage this is a serious challenge for the income policy. The workers in the processing industry (textile, clothing and leather industry) and the services sector (hotels) are with the lowest remuneration;
• Wage inequality could be evaluated as moderate. No significant changes are monitored in dynamic aspect. This concerns the inter-sector differences in wages as well as differences among particular professions and educational levels;
3.3. Working time and work organization
The Labour Code in Bulgaria identifies normal duration of working time (art. 136)9; reduced working hours (art. 137)10; part-time work (art. 138-139)11, as well as some specific forms of working time, e.g. night work (art. 140), work in shifts (art. 141), overtime work (art. 143-144), etc.
In 2004 a number of changes were introduced so as to make the legal norms in working time more flexible, e.g. extended working time.12 There are also some additional legal norms concerning people, whose working time is calculated for a certain period.13 The categories of workers are protected in view of working time schemes, i.e. mothers with children aged under 3 to work extra and on night shifts.14
9
Article136(1) The normal duration of the weekly working hours for a five-day work week shall be up to 40 hours.
(2) The normal duration of the weekly working hours for the sectors where the five-day workweek has not been introduced shall be up to 46 hours for a six-day work week.
(3) The normal duration of the working hours during the day shall be: 1. for a five-day work week - up to 8 hours;
2. for a six-day work week - up to 8 hours, and on days before days off or holidays -up to 6 hours. (4) The normal duration of the working hours under the preceding paragraph shall not be extended.
(5) The transition from a six-day to a five-day work week shall be done upon a decision of the Council of Ministers.
10
Article 137
(1) Reduced working hours shall be established for:
1. employees working under unhealthy conditions or doing work under special conditions upon the decision of the Council of Ministers;
2. employees who have not reached 18 years of age.
11
Article 138
The parties to the employment contract may negotiate work for a part of the statutory working hours (part-time work). In this case they shall specify the duration and allocation of the working hours.
Article 139
(1) The allocation of working hours shall be established by the internal rules of the enterprise.
(2) In enterprises where organization of work allows flexible working hours may be established. The time during which the employee must be at work in the enterprise, as well as the manner of accounting for it, shall be specified by the employer. Outside the time of his compulsory presence, the employee may determine the beginning of his working hours himself.
(3) Depending on the nature of work and the labour organization, the working day may be divided into two or three parts.
(4) For some categories of employees, due to the special nature of their work, the Minister of Labour and Social Welfare may establish open-ended working hours. The employees on opened working hours shall, if necessary, perform their duties even after the expiry of the regular working hours. The overtime on working days shall be compensated by an additional annual paid leave, and work on legal holidays - by an increased remuneration for overtime work.
(5) For some categories of employees, due to the special nature of their work, an obligation may be established to be on duty or to stand by at the disposal of the employer during specified hours in a 24-hour period. The Minister of Labour and Social Welfare determines the categories of employees, the maximum duration of the hours, and the terms and procedures of accounting for them.
12
Extended working time by the employer but the total weekly duration cannot exceed 48 hours, and for the employees with reduced working time – up to 40 hours. The extended working day cannot exceed 10 hours, and for the employees with reduced working time – up to 1 hour over the reduced working time.
13
The duration of working day for these employees cannot be over 12 hours, and the weekly duration cannot exceed 56 hours.
14
Within this legal frame, the reality, as registered by the regular statistical observations (LFS and Time Budget Survey), presents the following trends in working time.
Table 6. Average actual working hours per week in 2001-2006
2001
Total Male Female Private sector Public sector
Total 40,8 41,1 40,4 41,3 40,2
Full time employed 41,0 41,3 40,8 41,6 40,4
Part-time employed 20,8 20,7 20,8 21,1 20,2
2006
Total Male Female Private sector Public sector
Total 41.0 41.6 40.4 41.8 39.2
Full time employed 41.4 41.9 40.9 42.2 39.5
Part-time employed 20.7 21.6 20.1 20.4 21.4
Source: LFS , 2001, 2006
Comparing the average actual working hours per week in 2006 and 2001, we have to say that in a five-year period no significant changes occurred. There are two exceptions only: The first is that part-time employed people in the private sector had started to work less hours per week (by -0.8 hour), while the ones in the public sector worked more hours (by 1.2 hour). The second is that total average working hours in public sector and for full-time employed people in the public sector had decreased, while the ones in the private sector stayed relatively stable.
The distribution of the usual worked hours in 2004 points out that the majority of the employed people worked between 40-49 hours per week. Bearing in mind the legal norm stated in the Labour Code as a normal length i.e. up to 40 hours, this means that more people worked extra hours in 2006 compared with 2004. Within the total balance of working time this means also that less people are engaged at working time below 40 hours or under the legally fixed norm.
Table 7. Distribution of employed people by usual worked hours - structure
2004 2006
Total Man Women Total Man Women
100.0 100.0 100.0 100.0 100.0 100.0
1-9 0.1 0.0 0.1 0.1 0.0 0.1
10-19 0.3 0.3 0.4 0.2 0.1 0.3
20-29 1.9 1.6 0.3 1.5 1.1 1.9
30-39 2.5 1.9 3.2 1.8 1.1 2.6
40-49 80.7 78.4 82.3 82.0 79.4 84.8
50-59 3.9 4.4 3.3 4.0 4.5 3.4
60+ 2.0 2.5 3.0 1.9 2.5 1.2
Unclassified 8.6 10.8 6.0 8.6 11.2 5.6
Source: LFS
[image:24.595.122.474.532.675.2]on shifts and this working time is more typical for men (11.7%) than for women (4.0%). Double day shift work is the next major group including 10.1% of total employees working on shifts, being more popular among women (13.7%) and less for men (6.8%). In more details the structure of different forms of working in shift is presented in Fig 9.
Figure 9. Structure of employees, working on shifts, 2004
7,9 10,1
11,7 6,8
4 13,7
0% 20% 40% 60% 80% 100%
total man w omen
other types of shifts
mixed day 2 shifts,
double day shift - 2 shift
semi-continues w ork-3shifts
3-4 continues shift w ork -3-4shifts
Source: LFS, 2004, Table 1, p. 113.
Work on shift was more typical for the private sector than for the public one, as well as for Mining and quarrying (52.2% of total employees in the branch); Hotels and restaurants (49.9%); Health (40.3%) and Transport (32%).
As far as working time organization is concerned, the LFS distinguish two forms – fixed start and end of working day, and flexible working time. In 2004 the majority of the employees (89.3%) had fixed start and end of the working day, and only 11.1% – flexible. No significant differences by gender in this respect is observed, but by branches there are some branches where the flexible working day is clearly outlined, e.g. Agriculture (23.7% of total number of employees in the branch); Construction (17.5%), Hotel and restaurants (16.5%); Transport (15.3%), Education (26%).
Nearly half of the total number of employees in 2004 had worked in the evening – 1 214,6 thousand people. Among them men prevailed (58.4%). The evening work is the usual working time for 47.3% of all employees that declared they work in the evening, while for the rest it was an occasional case.
In 2004 Saturday work concerned 53.9% of the employees, of them 60% men and 40% women. Among all people who worked on Saturday almost half did that as usual mode and for the rest it was an occasional case.
The people, who worked on Sunday presented 1/3 of total number of employees. This was valid for 40% of the men, as well as for 44% as usual time and for 46% – only sometimes.
The most vulnerable groups regarding not typical working time are those of employers, self-employed people and unpaid family workers. The last one in 2004 presented 54% of people working in the evening, 90% of those, working on Saturday and 73% of those, working on Sunday.
Meanwhile, the Annual Report of the General Labour Inspection points out that in 2006 the violations in the sphere of extra working hours were 1043 cases, which was by 10% more compared with 2005. It also named three branches – Hotel and restaurants, Retail trade and Clothing industry, where more of the violations were registered.
¾ The presented data suggest that the working time mode still remains quite traditional; ¾ As a result of the present more stable economic development the working time
extends. There is a clearly outlined extension of working time by the end of week and in weekends especially in specific branches and in the private sector. Unfortunately we cannot analyse the trends of changes in working time in details due to lack of regular observations;
¾ The flexible forms of working hours covered only 11.1% in 2004, however, in some branches the flexible working time is more frequent e.g. constructions, trade, hotel and restaurants, etc. However, following a number of indirect evidences and in comparison with earlier periods of transition, there are more options for flexible and atypical work.
3.4. Working intensity
Labour intensity depends on many factors of which the most essential are production technology, organization and rhythm of labour activity. During the recent years the debate on labour intensity in European countries is connected with the relation between the aspiration for reduction of working time and its compensation via increasing the intensity. In Bulgaria the labour intensity issue is not on the agenda. That is why there are not many studies in this area. Meanwhile the statistics does not collect data and does not calculate basic indicators for labour intensity. So the objective of the present survey is to show the development trend and the relation with the hours worked based on the existing statistical information.
In this study labour intensity is defined as an amount of output produced per unit of time (1 hour). The evaluations are made on macroeconomic level (for the economy in general and by particular sectors). Information for the amount of output in comparative prices by economic sectors and hours worked has been used for the purpose.
The evaluations of labour intensity15 in Bulgarian economy for the period 2000-2004 indicate two particular features:
¾ The first related to the relatively low intensity level. The amount of output produced by Bulgarian economy per 100 hours worked is less than BGN 2.
¾ The second feature is that labour intensity grows during the studied period. It grows by about 16% compared to 2000. This positive trend is a result from all factors (technological, organizational, etc.) influencing intensity. The available statistical information does not allow distinguishing their particular impact.
No clear correlation is monitored at macro level between labour intensity and average duration of working day during the studied period. While the intensity grows, the working day’s duration does not indicate any trend of change as seen from data in the section 3.3 (it grows initially, after which declines). Despite the great degree of conventionality it could be concluded that the increase of labour intensity in Bulgaria during the recent years is not accompanied with increase of working day’s duration.
The level and dynamics of labour intensity by economic sectors show differences, which consistence with the expectations. The intensity in the agriculture is lowest. For example in 2004 the amount of produced output in the agriculture per 100 hours worked is BGN 0.47, while in industry it is BGN 1.6, and in the services sector - BGN 0.9.
15
Looking at the dynamics of labour intensity by economic sectors the differences also appeared. Industry outlined greater dynamics. The increase of labour intensity in industry is within 29%, however in value it is almost insignificant. Production grows from BGN 1.3 in 2000 to BGN 1.6 in 2003 per every 100 hours worked i.e. by only BGN 0.34. There is no change in labour intensity in agriculture, while in services it is not significant (almost 11%). This is a result from the greater increase of hours worked, which is due to the employment growth. The hours worked in the sector increase by about 14%, as the number of employed during this period increases with the same percentage.
In most of the economic activities the increased intensity does not correlate with the increase of real wage. Conclusions about this relation are made based on the evaluations for labour intensity for the period 2000-2004 only. The changes in the wage in the economic activities with relatively low remuneration (hotels and restaurants, trade, agriculture, etc.) are not connected with the change of hour labour intensity. Only in mining industry and in some industrial activities (oil processing industry) the increase of labour intensity correlates with the increase of wages.
All above-mentioned provide arguments to recommend greater activity of trade unions in the social dialogue at company level. Along with the debate on remuneration and labour conditions, the social dialogue should also pay greater attention to labour organization, labour intensification and their effects on workers.
3.5. Safety and health
During the studied period 1995-2006 safety and health conditions at working place had changed significantly due to changes in economic conditions and in the system of regulation and observation of healthy and safety at work place. The changed were not in one way – the period 1990-2000 could be characterized mostly with destructive process in both directions, while in the period after 2000 some constructive signs occurred, namely: (a) safety and health conditions at working place became debated problems both at political and social level; (b) practical steps were undertaken towards more regular observation and monitoring of the events; (c) a system for assessment of health risks was introduced in practice; (d) the specialised medical offices for prevention and regular control became an important part of the whole system, since their controlling functions as an integral part of the whole system were legally announced.16
The Labour Code and the Law on Safe and Healthy Labour Conditions and the regulations under this law are the legal bases for ensuring safety and health in work. Bulgaria has introduced all EU directives in the field of labour safety and health.
The system of safe labour conditions follows the logic of identifying and evaluating the risk of work. This system is legally constructed following the European standards and criteria in the field. As prescribed by the Law on Safe and Healthy Labour Conditions:
(a) The responsibilities for healthy and safety work conditions is on behalf of employers;
(b) The preventive approach should be applied regarding the risks at work place;
16
(c)
For solving the problems in the field a tripartite principle should be in force;(d)
The General Labour Inspection (GLI) is obliged for the integral control over the system;(e)
Labour medicine services are built up as a relevant infrastructure for healthy and safety work conditions.Within these main principles a relatively good institutional frame operates for their implementation and control. The social partnership in this area is built through the collective labour bargaining and the labour conditions committees operating in the enterprises. The established labour medicine services have consulting functions for supporting the employers in planning and maintaining safe labour conditions. The General Labour Inspection reported that in 2006 the share of firms that had implemented this system was 65%, compared with 50% in 2005.17
Of course, there are some problems related to the internal control of the institutional system. The relatively high provision with legal acts (over 700 legal acts should be observed and controlled) marked some of the problems. The following of the available legislation is one of them. For example out of all violations determined by the General Labour Inspectorate in 2005 43.2% were in the field of company organization and management of safe and healthy labour conditions, 16.5% in the field of labour safety and 12.5% related to labour hygiene.
The evaluation of risk in labour activity is done through evaluation of the factors of working environment and the labour process. The evaluation includes monitoring of the level, the structure and the dynamics of professional illness, the labour accidents and the labour related illness and professional mortality.
[image:28.595.104.487.520.707.2]The ranking of risk factors as indicated in the figure below includes: unfavourable micro-climate; noise; physical burdening; dust; toxic substances; lighting; vibrations and ionising radiation. In 2002 20% of the employed have worked in such conditions, and in 2003 – 36.1%. The lack of more present information impedes a more general conclusion regarding the risk factors – whether the working environment deteriorate or improve in terms of the pointed factors.
Figure 10. Unfavourable factors of working environment in Bulgaria 2002-2003
0 10 20 30 40 50 60 unfav ourab
le m
icro clim ate nois e phisical load
ing dust
toxic
ity el
eme nts light ing vibr atio nal ioniz atio nal r adiat ing % 2002 2003
Source: According to data of Labour Inspectorate, based on 27081 monitored enterprises with 1091920 employed people, in Report for the Health of the Nation in the Beginning of 21st Century, Ministry of Health, August 2004
17
Among the branches with unfavourable environment the Report outlined as more risky the following one: “production of refined petrol products”, “railway, water and road transport”; “coal and peat extraction”, “wood, paper and cardboard production”, “non-ferrous metals extraction”, “cement, lime and plaster production”, “vehicles’ production”, “extraction of non-metal materials”, “production of textile and textile products”, etc. Workers in these branches are compensated for unfavourable working conditions. In comparison to the other sectors these wage compensations takes a significant part in total wage (see table 5).
[image:29.595.76.482.256.426.2]Work accidents are one of the indicators of safe and healthy work conditions. The trends in work accidents by types are presented in Fig.11
Figure 11. Total number of work accidents, and work accidents that caused death or disability –trends in development
0 1000 2000 3000 4000 5000 6000
1995 2000 2001 2002 2003 2004 2005 2006
numbers
7000
Total work accidents-numbers
Work accidents that caused death or invalidization
Source: National Insurance Institute (www.noi.bg); National Register of professional Illness, Ministry of Health.
The decreasing work accidents after 2000 could be a result of many factors, among which the better organization of the control over labour conditions carried out by the units of the General Labour Inspection, should not be neglected. In 2006 the General Labour Inspection performed 36036 controls compared with 29683 in 2001 or by 21% more.
The number of working hours, lost due to work accidents, also decreased by 18% for the period 2000-2006 both for total number of accidents and accidents causing death or disability.18
Data on professional illnesses points out similar downturn trends for the period 1995-2000 with a slight increase between 2000 and 2004 and again downturn tendency since than.
18
Figure 12. Professional illness – numbers and per 100 000 employed people
0 500 1000 1500 2000
1995 2000 2001 2002 2003 2004 2005 2006
numbers
0 10000 20000 30000 40000 50000 60000
professional illness - cases per100 000emp
Sources: Authors calculations based on absolute numbers of professional illness and number of employed people
The profile of professional ill people outlined as most risky groups that of miners (19.1%), drivers (18.2%), metal workers and fitters (14.6%),19 as well as people in age 45-55 years old (42.8%), followed by people aged 35-44 (30.2%) and also people with length of service between 20 and 30 years. According to the same source of information the most often cases of professional illness in 2006 were: illnesses of the locomotory system (27.7%); vegetative polyneuropathy (19.5%); silicosis, asbestosis and other pneumoconiosis (19.5%); respiratory illnesses (21.7%); neuritis of the auditory nerve (11.5).20
The risk groups regarding working conditions and workers’ health result from the branches where the people are employed. They have already been pointed, however some additional details are summarized here:
According to data of the General Labour Inspection 44% of the workers in 2005 have worked in conditions of increasing risk for hearing deterioration. In this group the people aged 45-55 and with length of service over 10 years were particularly threatened with hearing deterioration.
The people working in small and medium enterprises were exposed to a higher degree of risk related to noise, because no regular monitoring of working environment and elimination of health risk factors is done.
The people working in stress in Bulgaria were 25.4% according to Eurobarometer (2002), compared to 17% for the EU25 countries. This is an important factor because it results from the high employment uncertainty at relatively high unemployment in the country. The fear from losing work determines a behaviour of compromise regarding the working conditions, working time duration and other factors that have negative impact on health. A national survey indicates that 48.3% of the people working in unfavourable conditions do this due to the lack of another alternative and 22.1% – because of better remuneration.21
The working organization and the working atmosphere were also factors of unhealthy nature for part of the enterprises. A survey indicates that 46.6% of the employed have
19
Tzacheva, N., K. Dinkova, M. Yancheva. Occupational Environment and Workforce Health – Harmonization with European Legislation. – Archives, Balcan Medical Union, vol. 42, 2007, 4, p. 197-203.
20
I.e.
21