Image Re-Ranking by Analyzing GLCM and Color
Features
Praveen Mishra
M Tech Scholar, Department of CSE, VNS IST, Bhopal
G. S. Prajapati
Asso. Prof., Department of CSE,VNS IST, Bhopal
ABSTRACT
With the growth of internet visual data like images are increase with every minute. Now this increase of data has attract many researchers for searching the relevant images from the collection. In this paper focus is on the re-ranking of images by utilizing the visual features. So given a visual query in form of an image is done and base on that relevant image retrieval, are done with their proper ranking. Here searching is done on the basis of the visual feature values obtain from the query image on the dataset each image similar visual feature values those images whose similarity is same is consider as relevant and the most similar images is ranked first then next as second, other are done in similar fashion. Results shows that combination of feature give more effective results as compare to single one.
Keywords
Digital Image Processing, Information Extraction, feature extraction, Re-ranking.
1.
INTRODUCTION
As the number of internet user are increasing day by day and there time on surfing also increase. By this lots of work has been done by the researcher out of which image retrieval is become a important field for providing only the relevant images on the user system from the collection.
So image retrieval is done on basis first is text base [14] that use text data attached with the image, this is done by the name of the image or some information present with the image depend on the type of collection. Most of the search engine like Google, Yahoo, Bing, etc. use this concept of the searching the image as user type query for the same but the ranking is totally base on the textual data attached with the image.
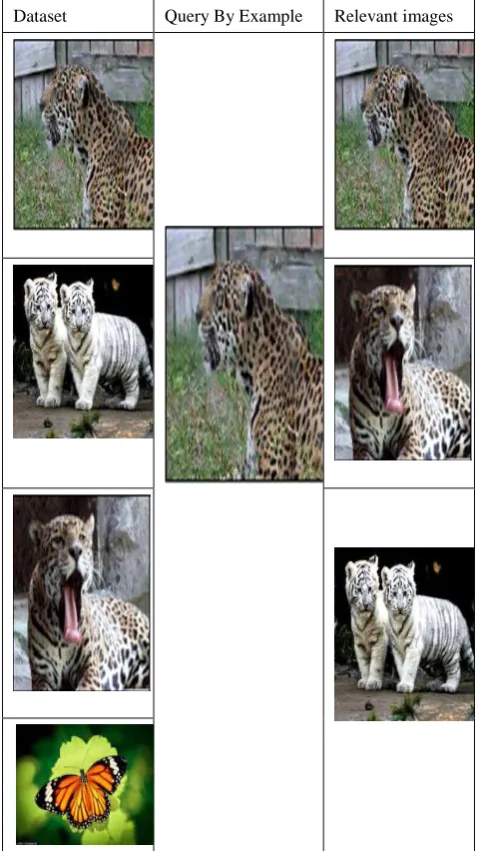
[image:1.595.309.548.303.729.2]Another way of searching the image is by passing the image as a query as in above user query in form of text [3, 13]. Here the queried image is act as an example where visual features of the image are read from the image and similar type of visual feature images are retrieve from the dataset then those images are present to the user as a relevant images for the passed query.
Fig 1: Image retrieval by text query.
One more approach for this is done by the utilization of the textual feature which are name or any other content with the visual feature of the image [4]. So a combination of both are use here results are much better as compare to the single feature query algorithm. But here the execution time is comparatively very large so time complexity is more because of this although results are much effective but time duration make in impractical for common use.
Dataset Query By Example Relevant images
[image:1.595.55.266.642.748.2]This paper is focus on the visual feature of the image and reranked images on the basis of the query passed by the user. Some of the important feature of the image which is used in the images are color, CCM, GLCM. This paper give a detailed study of the different feature and there combination for the result.
2.
RELATED WORK
The objective of the work [1] is to form categorized image databases harvested from the web. The re-ranking operation is performed for separating relevant and irrelevant results by the usage of a combination of textual and visual features. In [7] a method that uses user intervention to re-rank the results is proposed. In their approach, a small subset of correct images is manually constructed and this subset is then used to filter the noise in the data. There have been some works exploiting multiple modalities for image search applications. In [8] perform joint clustering in a space built from visual and tag descriptors to find iconic summaries of abstract concepts. In [10] fetching of image are done from the web by reading the surrounding image. Similarly In [9], tached textual data is utilized from the web page for ranking befor the support vector training which utilize visual effects.
Few of the image reranking algorithm utilize the web page ranking method as in [11] where important pages are ranked first base on their importance. It builds a graph representing the link structure of the web. As the web page get impotant depend on the number of hyperlink present in it.
As [2, 12] shows the approach for page reranking by the multi-modal where it utilize both the visual as well as textual feature. Here it jointly fetch both the feature and implement it in the many applications. One more approach is use here that include autoannotation where text data is automatically updated.
3.
BACKGROUND
As Image is collection of pixel and each pixel is treat as single value which is a kind cell in a matrices. In order to identify an object in that image some features need to be maintained as different object have different feature to identify them which are explain as follows:
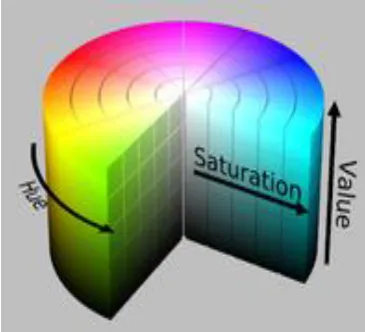
[image:2.595.337.520.72.238.2]Colure feature: By storing the pixel value in an image is nothing accept an representation of the color intensity at that point in an image. Because of the various image format pixel values are different for the same image. This can be understand as in RGB three matrix of same image are prepare for Red, Green, Blue matrix range of any pixel value is between 0-1. While in the case of the gray format it is of single matrix range of any pixel value is between 0-255. One important color property is the HSV Hue Saturation Value, here it represent color in form of qube, Where act as the angle of the color its value is from 0 degree to 360 degree. As shown in fig. 3 1-120 is for green then till 240 for blue and finally till 360 for the red again. In the similar fashion saturation is the value in range of 0-1 where it represent the distance from the axis. While Value represent the height it also represent from the 0-1.
Fig 3: Represent the color format for the HSV.
Algorithm for HSV Color Feature: Here image query is pass in the algorithm then convert it into HSV format from the RGB. After this as HSV is a three dimension matrix so convert it into single dimension by assigning the values of the fix values to some angels range for the H matrix and values to some range for the S, V matrix. After this sum all the values into single color matrix which is term as Color_feature. Input: I // Image
Output: Color_feature
1. [H S V] = I_to_HSV(Query) 2. H = Angle_to_value(H) 3. S = Decimal_to_value(S) 4. V = Decimal_to_value(V)
5. Color_feature = a*H+b*S+V // a, b are some constant
Texture Feature
Color Co-occurrence Matrix (CCM)
In [5] Color Co-occurrence Matrix is common visual feature of the image for its representation. In order to understand Color Co-occurrence Matrix, the even color area of the image tends to generate the diagonal values of the Color Co-occurrence Matrix and uneven area tends to the non-diagonal values. In CCM study two type of color format is use one is RGB and other is HSV while in case of RGB only the R, G color component in RGB color space and H, V in HVS color space are respectively. The statistics features extracted from CCM are as follows:
21
1
(
m
(
i
,
j
))
Energy
iD Dj (1)
1 1(
i
j
)
2*
m
(
i
,
j
)
Contrast
Di Dj (2)
1 1m
(
i
,
j
)
log[
m
(
i
,
j
)]
Entropy
Di Dj (3)
(
,
)
)
(
1
(
1
2 1
1
m
i
j
j
i
ference
InverseDif
Di Dj (4)Now above formula tends to provide a CCM sixteen dimensional texture feature values where for R, G, H and V each component provide parameters features of Energy, Entropy, Contrast, Inverse Difference.
Algorithm for CCM: Here input for the algorithm is a RGB image, while HSV format is calculate from it and the output of the algorithm is the values for the calculation of the Contrast, Energy, Entropy and Inverse Difference. These values are the representation of the CCM feature of the image. Input: I // Image
Output: ccm_feature
1. [R G B] = I_to_RGB(I) 2. [H S V] = I_to_HSV(I)
3. [RE, GE, HE, VE] = Enery(R, G, H, V) // Equation (1)
4. [RI, GI, HI, VI] = Contrast(R, G, H, V) // Equation (2)
5. [RS, GS, HS, VS] = Entropy(R, G, H, V) // Equation (3)
6. [RH, GH, HH, VH] = Inverse_diff(R, G, H, V) // Equation (4)
7. ccm_feature = Sum([RE, GE, HE, VE], [RI, GI, HI, VI], [RS, GS, HS, VS], [RH, GH, HH, VH]) Grey Level Co-occurrence Matrix (GLCM)
With the uncrease in the image quality and its different application. For the study of the texture feature of the image one of the basic method is Grey Level Co-occurrence Matrix. Here Grey Level Co-occurrence Matrix present the texture property by the correlation method in which neighbouring pixel [5] help for the calculation. With GLCM one can get four features is which include energy, contrast, entropy, inverse difference.
Energy
21
1
(
m
(
i
,
j
))
Energy
i j (4)It is a gray scale image texture measure of homogeneity changing, reflecting the distribution of images gray-scale uniformity of weight and texture.
1 1(
i
j
)
2*
m
(
i
,
j
)
Contrast
i j (5)Contrast is the main diagonal near the moment of inertia. Which measure the value of matrix is distributed and images of local changes in number, reflecting the image clarity and texture of shadow depth.
1 1m
(
i
,
j
)
log[
m
(
i
,
j
)]
Entropy
i j
(
,
)
)
(
1
(
1
2 1
1
m
i
j
j
i
ference
InverseDif
i jEntropy is the texture feature of the image which give randomness of the image, although the matrix of co-occurrence space are equal it achieved the maximum value otherwise it achived minimum value for the very uneven texture. So the largest entropy impose by the gray scale image is depend on distribution.
Algorithm for GLCM: Here input for the algorithm is a RGB image and the output of the algorithm is the values for the calculation of the Contrast, Energy, Entropy and Inverse Difference. These values are the representation of the CCM feature of the image.
Input: I // Image Output: Glcm_feature
1. E = Enery(I) // Equation (5) 2. I = Contrast(I) // Equation (6) 3. S = Entropy(I) // Equation (7) 4. H = Inverse_diff(I) // Equation (8) 5. Glcm_feature = [E, I, S, H]
4.
PROPOSED WORK
Multimodal Visual Feature Fusion : Existing studies reveal that the distances between samples become more specialize when different feature are group together.
Algorithm for Re-Ranking by color and CCM Feature:
Input: Query OutPut: Rank
1. Q_C_feature = HSV_Color_feature(Query) 2. Q_Ccm_feature = CCM(Query)
3. Loop 1:N // N is number of image in dataset 4. I = Dataset(N)
5. I_C_feature = HSV_Color_feature(Query)
6. Color_Result(N) = Distance(Q_C_feature, I_C_feature)
//Now read CCM feature 7. I_Ccm_feature = CCM(I)
8. CCM_Result(N) = Distance(Q_Ccm_feature, I_Ccm_feature)
9. End Loop
10.
2
2
Re
_
2
2
2
Re
_
2
CCM
sult
Color
sult
Rank
11. Rank = Sort(Rank)
Algorithm for Re-Ranking by color and GLCM Feature:
Input: Query OutPut: Rank
1. Q_C_feature = HSV_Color_feature(Query) 2. Q_Glcm_feature = GLCM(Query)
3. Loop 1:N // N is number of image in dataset 4. I = Dataset(N)
5. I_C_feature = HSV_Color_feature(Query)
7. I_Glcm_feature = GLCM(I)
8. GLCM_Result(N) = Distance(Q_Glcm_feature, I_Glcm_feature)
9. End Loop
10.
2
2
Re
_
2
2
2
Re
_
2
GLCM
sult
Color
sult
Rank
11. Rank = Sort(Rank)
5.
EXPERIMENT AND RESULT
The detail description of the work with the experimental setup is described in this section this validate the accurancy of the work. Here for the implementation MATLAB 2012a is used as a tool as it is rich in image processing function. The experiments actually comparison of the different features of the same image with different combination.
5.1 Evaluation Parameter
For evaluation of the different approach NDCG [6, 12] formula is use for the ranks obtain in the images. This is general formula and give effective results of the output. The NDCG measure is computed as
P
i
i
l
p
i
Z
P
NDCG
1
)
(
)
1
log(
1
2
@
(9)
where P is the considered depth, l(i ) is the relevance level of the i -th image and ZP is a normalization constant that is chosen to let the optimal ranking’s NDCG score to be 1.
5.2 Data Sets and Preprocessing
In order to conduct the experiment an artificial dataset which is a collection of images from different category are utilize. As images are of different format so first it is necessary to make it in readable format for experiment. Now this collection of images of different category are shown in table 1 for which one can make some important keyword collection for different images. In this way each image have one more feature to identify that is the keys of the images.
Table 1. Dataset of Different category
Category Examples
Objects Ipod, map
animal Butterfly, Gorrila
scene Taj Mahal, Hotel Taj
Person Barack Obama, Lena
5.3 Results and Discussion
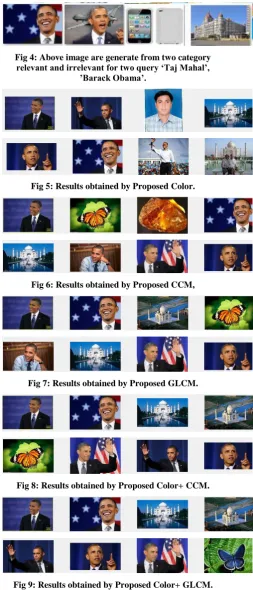
[image:4.595.73.289.70.197.2]By entering the query and search the desired image it was obtained that they can be categorize into few levels such as relevant or not. It can be further categorize into most relevant, relevant, less relevant, irrelevant.
Fig 4: Above image are generate from two category relevant and irrelevant for two query ‘Taj Mahal’,
’Barack Obama’.
Fig 5: Results obtained by Proposed Color.
Fig 6: Results obtained by Proposed CCM,
Fig 7: Results obtained by Proposed GLCM.
[image:4.595.318.571.73.160.2]Fig 8: Results obtained by Proposed Color+ CCM.
[image:4.595.315.569.116.708.2]Table 2. Average Values of NDCG@25 by Different features and there combination.
Method NDCG Values
Person Animal Scene
1 Color 0.387436 0.255489 0.347103
2 CCM 0.481697 0.266701 0.268852
3 GLCM 0.47277 0.272386 0.219215
4 Color+CCM 0.466805 0.294417 0.350662
5 Color
+GLCM
0.491274 0.294592 0.250334
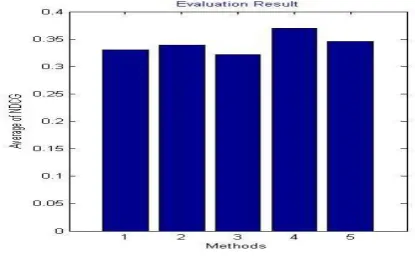
[image:5.595.64.272.437.566.2]From the above table 2 it is find that the combination of the new feature has increase the efficiency of image re-ranking. In different categories of the images one can find that results are improved in feature combination but utilization of single feature is always lower then combination. Some kind of weightage for the image need to be prepare for the different features will improve the efficiency of the image definitely, but there is no direct formula or calculation for the same.
Fig 10: Comparision graph of different method and average NDCG value
It is clear from the above bar graph shown in figure 10 it has been observed that the values at different NDCG levels is better then the individual feature method. So the utilization of the visual features has increase the efficiency of the work then the single features. Results shows that Color + CCM combination gives much better result in all cases as compare to the color + GLCM method. It has been observed that in some type of images single feature give similar efficiency as combination because that image is catch by that feature only. But if kind of image change then feature combination works much better as compare to other.
6.
CONCLUSIONS
Web image re-ranking has been widely used to reduce the user searching time on the internet; its success mainly depend on the accuracy of image features similarities. This paper
present utilizing of the new visual features combinations for ranking the image as make the re-ranking process more powerful. As single feature framework is suitable for some kind of images but a combination generate efficiency among different kind as one feature is suitable for some type of image then other feature is suitable for another kind. It ia obtain that color feature play a dominant role among other features while combination of this with other make it more accurate. Results shows that Color and CCM feature combination is one of the measure outcome among others. In future in order to improve the efficiency more features of images will be include that will improve the retrival efficiency. As to reduce the server time of making graph and re-ranking one filter need to be inserted into this so that it will filter relevant and irrelevent images at the initial stage.
7.
REFERENCES
[1] N. Ben-Haim, B. Babenko, and S. Belongie 2006. Improving web based image search via content based clustering. In IEEE Xplore SLAM, New York City, NY. [2] K. Barnard, P. Duygulu, N. de Freitas, D. Forsyth, D.
Blei, and M. Jordan Feb 2003. Matching words and pictures. J. Machine Learning Research, 3:1107–1135. [3] G. Iyengar, H. J. Nock, and C. Neti 2003,
“Discriminative model fusion for semantic concept detection and annotation in video,” in Proc. ACM Multimedia, pp. 255–258.
[4] R. Yan and A. Hauptmann 2003, “The combination limit in multimedia retrieval,” in Proc. ACM Multimedia, pp. 339–342.
[5] MSapthagiri.k, Manickam.L. Based on Color, Texture (GLCM & CCM) features, and Genetic-Algorithm 2010. International journal of Merging Technology and advanced research in computing. ISSN: 2320-1363. [6] K. Jarvelin and J. Kekalainen 2002 “Cumulated
gain-based evaluation of IR techniques,” ACM Trans. Inf. Syst., vol. 20, no. 4, pp. 422–446.
[7] N. Morsillo, C. Pal, and R. Nelson 2008. Mining the web for visual concepts. In 9th KDD Multimedia Data Mining worksho.
[8] R. Raguram and S. Lazebnik 2008. Computing iconic summaries of general visual concepts. Computer Vision and Pattern Recognition Worksho.
[9] F. Schro, A. Criminisi, and A. Zisserman Oct. 2007. Harvesting image databases from the web. In Computer Vision, 2007. ICCV 2007. IEEE 11th InternationalConference on, pages.
[10]G. Wang and D. Forsyth 2008. Object image retrieval by exploiting online knowledge resources. In IEEE Conference on Computer Vision and Pattern Recognition.
[11]Y. Jing and S. Baluja 2008. Visual rank: Applying pagerank to large-scale image search. IEEE Trans. Pattern Anal. Mach. Intell. , 30(11):1877.
[12]Meng Wang, Hao Li, Dacheng Tao, Ke Lu, and Xindong Wu , November 2012 . Multimodal Graph-Based Reranking for Web Image Search. IEEE Transaction on image processing Vol. 21, NO. 11.
[13]Kirti Yadav, Sudhir SinghImproving June 2014. Web Image Search Re-Ranking Using Hybrid ApproachIJARCSSE. Volume 4, Issue 6.