http://dx.doi.org/10.4236/ojmh.2016.63011
A Review on Modeling of Kinneret Salinity
with Practical Recommendations
Moshe Gophen
Migal Scientific Research Institute, Kiryat Shmone, Israel
Received 21 April 2016; accepted 26 June 2016; published 30 June 2016
Copyright © 2016 by author and Scientific Research Publishing Inc.
This work is licensed under the Creative Commons Attribution International License (CC BY). http://creativecommons.org/licenses/by/4.0/
Abstract
Two models have been developed for the evaluation and prediction of salinity changes (chloride concentration; ppm; [Cl]) in Lake Kinneret. They are: 1) RM, which is based on the Salt balance and hydrological budget of the lake; 2) GM which is based on the geo-hydrological regional properties of Kinneret’s geological structure. The concept of both is partly different: RM is correlating reduc-tion of runoffs to salinity elevareduc-tion and GM relates salt flux to the aquifer yield and the impact of lake water level is neglected. Long term statistical analyses justify support to GM, excluding condi-tions of heavy floods. This paper is a combination of a supplemental extended temporal study and a models review. Practical conclusions on Kinneret hydrological management within a frame of constrains aimed at prevention of salinity and eutrophication increase are presented.
Keywords
Kinneret, Modeling, Salinity, Fluctuations
1. Introduction
Three major anthropogenic interventions within the Kinneret-drainage basin are the 1933 dam construction on the Southern outlet, the 1964 construction and operation of the National Water Carrier (NWC), and the 1967 di-version of two salty springs (app. 2000 ppm [Cl], 20 × 106 m3/year) away from the lake. These three achieve-ments resulted in the implementation of human control of the outflows with respect to runoff inflows to regulate Water Level (WL), daily withdrawal of 1 × 10⁶ m3 (mcm) from the lake, and the removal of about 30% of salt inputs.
The history of chemical properties of the Kinneret waters is even longer. It was intensively explored not only as a result of practical water utilization but also due to the need for comprehensive knowledge of the ecosystem structure and its other services merit. The present paper will focus on salinity as chloride concentration (ppm) [Cl] which is the common component for quality consideration.
1.1. Historical Highlights
The first accurate analysis of major ions composition in the Kinneret water was done on a sample collected by Annandale in October 1912 and published by Christie in 1913 [1]. The concentration of [Cl] was 239 ppm. As part of agricultural investigation, S. Stoler and Schneidmeser published [Cl] concentration in Kinneret waters usage for Banana irrigation as 285 and 287 ppm [2]-[8]. They also published data collected during 1950-1951 where [Cl] varied between 345 and 346.3 ppm [1]. Taussig [1] [9] performed [Cl] of 331 ppm. Until 1968 the research was carried out by Mekorot Water Supply Company and from 1968 it is under the responsibility of the Kinneret Limnological Laboratory of the Israel Oceanographic and Limnological Research Company Ltd. More than 50% of the references cited in this paper are studies carried out diring the last 25 year and relevant data was found in older studies.
1.2. [Cl] Fluctuations
The combined impact of sub-lacustrine salty water inputs and high evaporation (262 mcm/y) is giving to Kinne-ret waters an unusually higher ionic concentration than that of the Jordan River as is exemplified by [Cl]: >230 ppm and about 20 ppm in the Kinneret and in the Jordan, respectively. The difference is due to the geological history of this region. Consequently, winter floods and drought (rainfall fluctuations) prominently diluted or concentrated factors.
[image:2.595.89.539.528.719.2]An exceptional rainfall event occurred during the winter of 1968/69. Multi-annual mean rainfall gauge in the Kfar Giladi station (Kinneret drainage basin) was 752 mm; it was 1376 in 1968/1969. Moreover, the south dam was open and precipitations during the winter months of 1968/69 were 73% (1009 mm) of the annual gauge. About one fourth of the lake volume was replaced by river (65% Jordan) inflows and the [Cl] dropped respec-tively (Table 1 and Table 2). To avoid the severity of beach floods damage, the south dam was fully opened for two months and about 1 × 10⁹ m3 (bcm) of water passed through down stream to the Dead Sea.
Table 1. Monthly means of Kinneret WL (MBSL) and [Cl] (ppm) during October 1968-September 1969.
Date (mm/yy) WL (mbsl) Cloride (ppm)
10/68 209.84 299
11/68 209.92 300
12/68 209.86 298
1/69 209.17 284
2/69 208.34 281
3/69 208.92 252
4/69 208.83 236
5/69 208.89 240
6/69 208.95 240
7/69 208.94 241
8/69 209.12 249
Table 2. Monthly means of Kinneret WL (MBSL) and [Cl] (ppm) during October 1991-September 1992.
Date (mm/yy) WL (mbsl) Cloride (ppm)
10/91 212.76 249
11/91 212.78 250
12/91 212.40 248
1/92 212.40 236
2/92 209.77 227
3/92 208.14 211
4/92 208.84 211
5/92 208.79 211
6/92 208.81 211
7/92 209.91 212
8/92 209.10 216
9/92 209.28 216
1.3. The Salt Resources
The major input of salts to Lake Kinneret are presently sub-lacustrine fluxes. Chloride content in those sources varied between 1100 and 18,000 ppm. Until 1966, 30% of the total input sources were two salty springs which fluxed into the lake as a short way runoff located in the north-western lake beach. Those two springs were di-verted and about 40,000 tons of salts were annually didi-verted away from the natural lake salt load. Two theories of geological process were suggested, aimed at explaining salt intrusion into the lake [8]:
A: The salts originate from seawater and intruded as a result of upward pressure from deep volcanic energy. Their influx into the lake is therefore influenced by the Kinneret water level.
B: Salt origins are Evaporites located very deep and are dissolved and migrate through faults and Karstic fis-sures and cracks but are not affected by the lake water level.
1.4. The “Zemach 1” Borehole
A borehole was excavated approximately 3 km south from Lake Kinneret. A huge salt massive was indicated with top located at a depth of 1334 m. This massive salty evaporite was formed during the Pliocene [9] and was suggested as a representative of more deep evaporites in the vicinity of the lake.
1.5. Models for [Cl] Quantification of Lake Water Salinity
More recently [10] two models of salt input processes were formulated: 1) Rimmer Model (RM); and 2) Gvirtzman Model (GM). The concept of RM is based on hydrological parameters of rainfall gauge, external ru-noff inflows, evaporation, outflow and withdrawal, lake volume, [Cl] and lake loads [11] [12]. The GM concept is hydro-geologically oriented evaluation to verify the impact of rainfall and underground aquifers yield on the sub-lacustrine salt fluxes.
There is one prominent difference between the two models: RM is a dependant of water budget component (in and out) whilst the GM is primarily led and controlled through the capacity of underground aquifers fluxes which carry dissolved [Cl]. The measureable salt loads in RM are the multiplication of [Cl] by discharge of in-puts/outputs (runoff, withdrawal, evaporation, outflow) fluxes. The impact of rainfall and the sub-lacustrine fluxes are indirect characters [11]-[13].
them penetrate the lake bottom through an aerial infiltration. Several of those bottom infiltrators were located and [Cl] were measured [10] [14]-[19].
The results of the two models implementation and specifically for future prediction might be therefore partly different.
The objective of the present paper is an attempt aimed at resolving the two disputed models. It is critical for the future prediction of the utilization of water resources and the evaluation of a reliable proper future design.
To resolve the dispute I assembled [Cl] measurements that were collected during 82 years (1933-2015) (with few sporadic measurements prior to 1933) of [Cl] in Lake Kinneret and carried out statistical evaluations to ve-rify models’ best fitness. The analysis includes only one parameter, the [Cl] with relation to time (temporal), available lake water (total Inflow minus Evaporation) taking into account negligible changes of evaporation.
2. Material and Methods
The data source of [Cl] prior to 1968 is TAHAL (water planning authority of Israel) and Mekorot (a water supply company) and later Kinneret Limnological Laboratory. The TAHAL-Mekorot data-set (1933-1989) in-clude 208 measurements of epilimnetic samples collected at Station A (lake deepest point). The KLL data (1969-2005) include 38,059 weekly and bi-weekly samples collected at 10 stations at all discrete routine sam-pling depths [20]. Results from the two data-sets were assembled together for statistical evaluation.
Statistical analyses used in this study were taken from STATA 9.1, [21], Statistics-Data Analysis and Stat-View 5.1, SAS Institute Inc., Polynomial Regression, Fractional Polynomial Prediction, and LOWESS (0.8). Due to the study scope, the dominant role is due to review trait and accompanied by data which was not in-cluded in the two models of RM and GM. Therefore the two subtitled chapters of "Material and Methods" and “Results” are included as crucial background for the presentation of the analytical results whilst most of the dis-cussion related to previously presented data.
3. Results
Figure 1. Annual averages of Chloride concentration in Lake Kinneret during 1934-1989 only one measurement in 1913 (data source: TAHAL).
[image:5.595.211.419.289.694.2]Figure 3. Polynomial Regressions (R2 and probability, p, values are given) between time (years) and annual rainfall in the northern part of the Hula Valle as averages of 3 stations: Kfar Giladi, Dafna and Kfar Blum, during 1945-2005.
Figure 4. Polynomial Regressions (R2 and probability, p, values are given) between chloride concentration in the epilimnion of Lake Kinneret in October (upper) and in April (lower) during 1945-1965.
[image:6.595.205.419.269.577.2](a) (b)
[image:7.595.195.437.301.478.2]Figure 5. Chloride concentration (ppm) and WL (MBSL) during 1933-1989). (a) Fractional polynomial prediction of chlo-ride concentration (ppm) as related to WL (MBSL); (b) trend of changes of chlochlo-ride concentration in relation to annual mean of WL (MBSL) (LOWESS; 0.8).
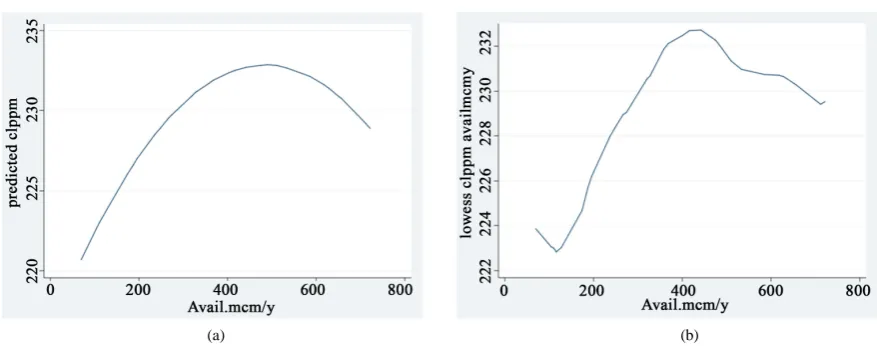
Figure 6. Fractional polynomial prediction of available water in Lake Kinneret in relation to annual means of WL (MBSL) during 1969-2005.
(a) (b)
[image:7.595.93.532.512.685.2](a) (b)
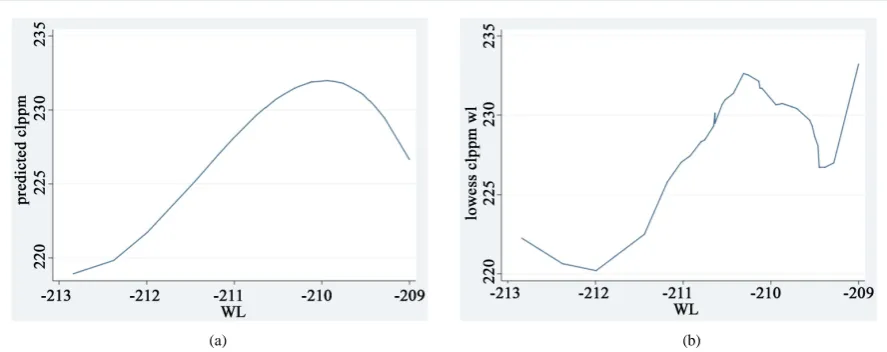
Figure 8. Annual means of water level (MBSL) and chloride concentration (ppm) during 1969-2005. (a) Fractional poly-nomial prediction of chloride concentration (ppm) as related to WL; (b) trend of changes of chloride concentration (ppm) in relation to WL (LOWESS; 0.8).
4. Discussion
The [Cl] in the saline spring within the Kinneret ecosystem was widely documented (among others, [13] [15] [24]. Serruya [1] (Table 1) indicated a significant reduction of [Cl] in Lake Kinneret as a result of two simulta-neous events: the diversion of the Ein-Nur salty springs and the heavy floods during the winter of 1968/69. None of those studies presented a comprehensive model which might be not only suitable to verify past measured data but also reliable for future prediction. Prominent designs of such models were presented by two groups of scien-tists. They included the conceptive runoff-hydrological approach (RM) and the geo-hydrological paradigm (GM) (Table 1, Table 2). RM’s predictions for the next 25 years (2041) with respect to climate change have indicated rainfall suppression, reduction of lake inflows (440 mcm/y), decline of lake water availability (200mcm/y), and increase of [Cl] (375 ppm) [11] [12] [25] [26]. The two models, RM and GM split from the same mutual basis. The mutual parts for the two models are the following. Diversion (started late 1960’s) of the salty springs of Tabcha (north-western), Fuliya and Tiberias Hot springs (mid-western) with the consequent removal of about 30% (45 - 55 tons chloride annually) of total input salts. Also the respective mass relation between freshwater and salt inputs and the water withdrawal influence on salinity because water removal is chloride suppression as well.
discharges and high WL, whilst most of the time, and especially since the mid 1980’s, the input discharges are moderate and WL is low. The analysis presented in this paper confirms that actual conditions are incompatible with the RM verification: increasing water input is obviously accompanied with WL elevation but [Cl] is ele-vated. It can be demonstrated by the fact that during the winter of 1968/69, when heavy floods and an open dam diluted the lake water, [Cl] declined, but in 1991/2, under similar hydrologic conditions but a closed dam, the [Cl] declined less (Table 1 and Table 2). RM evaluates increase of [Cl] when hydrological conditions are re-duced and GM represents the opposite—[Cl] increases when floods are heavier. The two models are collabora-tive on two sources of salt: dissolved in runoff inputs and sub-lacustrine. Nevertheless, those two sources are quantitatively dissimilar: The sub-lacustrine is much higher and therefore its significance is higher. If RM is en-tirely true, figures presented here are incorrect and should represent an opposite trend. Verification of RM should represent entire long term sequences of mutual trends of WL decline, lower input, and higher [Cl]. But actually it is true only to the extreme range of runoff inputs and the opposite occur below the range of extreme. The rational for RM is a combination of total salt and water balances without direct measurements of salt fluxes from the sub lacustrine sources. The sub-lacustrine inputs are influenced by the freshwater discharges in the eastern aquifers which are non-linearly related to the runoffs. The major salt supply to the lake is sub-lacustrine but their [Cl] is the opposite of the river runoffs: the higher the aquifer discharge is, the higher the concentration is. During drought RM predicts salinity increase due to lower impact of dilution effect but GM predicts lower input of salts. RM made a 25 year forecast of 440 mcm/y runoff inputs, evaporation of 240 mcm/y, available waters 200 mcm/ y and a [Cl] increase from 280 ppm up to 360 ppm. This forecast does not consider the option of sub-lacustrine decline of salt inputs (GM model). As a comprehensive attitude with consideration of the two models, it is suggested that freshwater elimination (by pumping) from the eastern aquifers is more efficient than salts diversion from the lake. The lake level of salinity is a questionable issue. RM predicted salinity above 300 ppm within 25 years and data from early 1900’s confirm this level as Kinneret natural conditions. If domestic water supply for the next 25 years is based on desalinization design the Kinneret waters with 300 ppm might be acceptable.
Comparative evaluation of the two flood events of 1968/69 and 1991/92 might give us the rational of the dif-ference between the two models: in the two cases about similar quantities of water input are involved: app 1 bcm within 3 - 4 winter months. During 1968/69 the south Dam was fully opened whilst in 1991/1992—it was closed. During the winter of 1968/9 a lot of water containing high concentration of salts left the lake in consequence to the influx of water containing low level of salt (Rivers inflows contain app.10 times lower salt concentration than the lake level). The result was high dilution effect in 1968/1969 and lower during 1991/1992 (Table 1 and
Table 2): Maximum decline (4 winter months) of [Cl] from 300 to 236 (difference-64) ppm was documented during 1968/1969 whilst in 1991/1992, maximal decline during 4 winter months was from 300 to 211 (differ-ence 34) ppm of [Cl]. The lack of dilution effect might be the reason for salinity increase from 275 to 400 [Cl] from late 1940’s to early 1960’s. The outflow of [Cl]—rich waters was lesser than the low level [Cl] inflows, and the lake loads of salts were enhanced. This difference initiate suggestions for optimal paradigm of anthro-pogenic salinity reduction: enhancement of water exchange. It will probably prevent the management desire aimed at permanent (or long term) and stable high water level. Nevertheless, stagnation caused by lesser water exchange is disadvantage from the view point of water quality and optional threat of eutrophication. Top priority of ecosystem protection should be given to water exchange obviously accompanied by salt removal. The optimal policy for water exchange in the Kinneret system is transporting through the NWC which is ad hoc available.
5. Conclusion and Summary
per se. It is not impossible that freshwater algae might be adapted to salinity increase [29] and similarly to [Cl] decline. When the necessity of Kinneret management was constrained to lower salinity from 400 ppm in 1967 to 200 ppm during the early 1980’s, it was implemented but phytoplankton composition was fairly stable and only changed 30 years later when nutrients (N/P mass ration and N-limitation) availability was modified. To achieve Limnological protection of Lake Kinneret ecosystem, 250 - 350 ppm [Cl] is deserved and might be implemented. If the usage of the Kinneret waters would be mostly aimed at agriculture, it is probably cheaper to control salin-ity by the less expensive operation of hydrological conditions than the expensive processes of salts removal.
Acknowledgements
The research leading to these results has received funding from the European Union’s Seventh Framework Pro-gramme FP7-REGPOT-2012-2013-1, Agreement n. 316157.
References
[1] Serruya, C. (1978) Chapter III: The Chemical Environment: A. History, B. Water Chemistry. In: Serruya, C., Ed., Lake Kinneret, Monographiae Biologicae, Vol. 32, Dr. W. Junk Publishers, The Hague, 183-204.
[2] Stoler, S. and Schneidmaser, B. (1952) Chapter: Soil and Leaves Composition. In: Research on Banana Growing, Ex-perimental Committee Jordan Valley Organization, Sifriyat HaSade Publisher, 154-174 (in Hebrew).
[3] Ziv, D. (1952) Chapter: Citruses Irrigation. In: Yafe, S.D., Ed., Agricultural Irrigation Doctrine, Sifriyat HaSade Pub-lisher, 331-349 (in Hebrew).
[4] Stoler, S. (1960) Chapter: Our Land. In: Shmueli, S., Ed., S. Stoler Anthology, Sifriyat HaSade Publisher, 11-19 (in Hebrew).
[5] Oren, H. (1961-1967) Lake Kinneret Chemistry, Interim Report. Fishery Department Agriculture Ministry. 7 p, (in Hebrew).
[6] TAHAL (1959) Cloride Concentration Measurements in Lake Kinneret. Annual Report 10 p (in Hebrew).
[7] Hydrological Service, Israel (2000) Report: The Development’ Utilization and Present Condition of Water Resources in Israel until Fall 1999. Israel Water Commission, Jerusalem (in Hebrew).
[8] Niv, D. (1978) The Geology of Lake Kinneret, Chapter. In: Lake Kinneret: The Lake and Its Drainage Basin, Kinneret Authority Publisher, 15-26 (in Hebrew).
[9] Marcus, I. and Slager, J. (1985) The Sedimentary-Magmatic Sequence of the Zemach 1 Well (Jordan—Dead Sea Rift, Israel), and Its Emplacement in Time and Space. Israel Journal of Earth Sciences, 34, 1-10.
[10] Gvirtzman, H. (2002) Israel Water Resources; Chapters in Hydrology and Environmental Sciences. Yad Ben-Zvi Press, Jerusalem' 287 p (in Hebrew).
[11] Rimmer, A. (2003) The Mechanism of Lake Kinneret Salinization as a Linear Reservoir. Journal of Hydrology, 281, 173-186. http://dx.doi.org/10.1016/S0022-1694(03)00238-5
[12] Rimmer, A. and Lichinsky, Y. (2007) A Model for the Design of Salt Concentration and Production in Lake Kinneret. Kinneret Limnological Laboratory, IOLR, Final Report, T13/2007, Submitted to the Governmental Authority of Se-wage and Water; 25 p (in Hebrew).
[13] Rimmer, A., Hurwitz, S. and Gvirtzman, H. (1999) Spatial and Temporal Characteristrics of Saline Springs: Sea of Ga-lilee, Israel. Groundwater, 37, 663-673. http://dx.doi.org/10.1111/j.1745-6584.1999.tb01158.x
[14] Ben-Avraham, Z., Amit, G., Golan, E. and Begin, Z.B. (1990) The Bathymetry of Lake Kinneret and Its Structural Significance. Israel Journal of Earth Science, 39, 77-84.
[15] Simon, E. and Mero, F. (1992) The Salination Mechanism of Lake Kinneret. Journal of Hydrology, 138, 327-343.
http://dx.doi.org/10.1016/0022-1694(92)90124-E
[16] Gvirzman, H., Garven, G. and Gvirtzman, G. (1997) Hydrogeological Modeling of the Saline Hot Springs at the Sea of Galilee, Israel. Water Resources Research, 33, 913-926. http://dx.doi.org/10.1029/96WR03191
[17] Hurwitz, S., Goldman, M., Ezersky, M. and Gvirtzman, H. (1999) Geophysical (Time Domain Electromagnetic Model) Delineation of a Shallow Brine beneath a Freshwater Lake, the Sea of Galilee, Israel. Water Resources Research, 35, 3631-3638. http://dx.doi.org/10.1029/1999WR900252
[18] Hurwitz, S., Lyakhovsky, V. and Gvirtzman, H. (2000) Transient Salt Transport Modeling of a Shallow Brine beneath a Fresh-Water Lake, Sea of Galile. Water Resources Research, 36, 101-107. http://dx.doi.org/10.1029/1999WR900292
http://dx.doi.org/10.1130/0016-7606(2000)112<1694:TGLIIA>2.0.CO;2
[20] KLL-LKDB (1970-2015) Chapter: Chemistry. In: Lake Kinneret Annual Reports. (In Hebrew) [21] Stata 9/1 (2005) Statacorp, Texas, USA.
[22] Stoler (1939) Research of Banana Irrigation in Jordan Valley. Agriculture R & D, 15 p. (In Hebrew)
[23] Migal, M.G. (2016) The Impact of EL-NIÑO/Southern Oscillation (ENSO) on Fishery and Water Quality in Lake Kinneret (Israel). Open Journal of Modern Hydrology, 6, 43-50. http://dx.doi.org/10.4236/ojmh.2016.62005
[24] Vakshal, E. (2002) Kinneret of Mine; L. Pickard Center for the Research of Underground Waters. The Faculty of Agriculture, Food and Environmental Protection, Hebrew University, Jerusalem, 32 p. (In Hebrew)
[25] Givati, A. and Rozenfeld, D. (2004) Quantifying Precipitation Suppression Due to air Pollution. Journal of Applied Meteorology, 43, 1038-1056. http://dx.doi.org/10.1175/1520-0450(2004)043<1038:QPSDTA>2.0.CO;2
[26] Givati A. and Rosenfeld, D. (2007) Possible Impacts of Anthropogenic Aerosols on Water Resources of the Jordan River and the Sea of Galilee. Water Resources Research, 43, W10419. http://dx.doi.org/10.1029/2006WR005771
[27] Stiller, M. (1994) The Chloride Content in Pore Water of Lake Kinneret Sediments. Israel Journal of Earth Science, 43, 179-185.
[28] Dror, G. and Ronen, D. (1998) Use of Piezometers for Calculation of Vertical Specific Discharge in Bottom Sediments of Lake Kinneret, Israel. Israel Journal of Earth Science, 47, 121-125.
[29] Lachapelle, J., Bell, G. and Colegrave, N. (2015) Experimental Adaptation to Marine Conditions by a Freshwater Alga.
Evolution, 69, 2662-2675. http://dx.doi.org/10.1111/evo.12760
![Table 1. Monthly means of Kinneret WL (MBSL) and [Cl] (ppm) during October 1968-September 1969](https://thumb-us.123doks.com/thumbv2/123dok_us/7905757.744715/2.595.89.539.528.719/table-monthly-means-kinneret-wl-mbsl-october-september.webp)
![Table 2. Monthly means of Kinneret WL (MBSL) and [Cl] (ppm) during October 1991-September 1992](https://thumb-us.123doks.com/thumbv2/123dok_us/7905757.744715/3.595.90.539.99.324/table-monthly-means-kinneret-wl-mbsl-october-september.webp)