Algorithm Study and Software Design of District Grid
On-Line Risk Assessment Based on Fuzzy Theory
Jing Li1, Yadi Luo1, Lijie Chen1,Donghong Zhao2
1China Electric Power Research Institute, Beijing, China 2China Wuzhou Engineering Group Co., Ltd., Beijing, China
Email: [email protected], [email protected]
Received March, 2013
ABSTRACT
In the background of the design and construction of Smart Grid Operation Supporting System for District Power Net-works, this paper established the weighted fault probability model of the overhead line which is based on equipment operating status, utility theory and fuzzy theory. In this model, the proper membership function is adopted to describe the influence of lightning, wind speed, line ice and temperature, and the outage rate of overhead line, derived from his-torical statistics, is amended. Based on this model, the power supply risk analysis software is developed to calculate the online risk indicators of district grid, and provide real-time decision support information based on risk theory for sched-uling operations personnel.
Keywords: Power System; Fault Probability Mode; the Overhead Line; Risk Assessment; Fuzzy Theory
1. Introduction
The failure of power system is a collection of possibility and severity. When analyzing power system faults, the traditional EMS only took the most likely contingency list, and also did not quantify the effect. In contrast, online operational risk analysis is more scientific, which can not only reflect possibility of contingency, but also severity of power system faults by establishing risk indi-ces[2]. Regional grids are mostly radial network structure. When faults occur, power grid splitting or loss of load would happen, so it is very essential to study online risk assessment model and algorithm applicable to regional grid, which can assist dispatchers making security deci-sion, guarantee sufficient security margin and make full use of power system transmission capacity. It can be a security barrier for power system safety and stability operation.
This paper aims to design online risk analysis software of power supply for the district grid based on the real- time possibility model of elements’ faults, and using the fuzzy theory to deal with the uncertainties factors. Oth-erwise, it can provide real-time risk-based deci-sion-making information for dispatchers.
2. Basic Concepts
2.1. Definition of Operation Risk Assessment
The basic definition of operational risk assessment of power system is: giving comprehensive measurement of
possibility and severity of uncertainty power system faces to[1]. Risk-based security assessment describes possibil-ity of contingency by probabilpossibil-ity, and denotes the sever-ity of failure by seversever-ity function. Then we can get the quantitative risk indices by integrating the two aspects.
The basic formula for calculating risk indices is:
( ) ,
isk f r i ev i f
i
R X
P E S E X
(1)Here: Xf is power system’s operational status;
is the ith failure and i
E
r i
P E is its probability; Sev
Ei,Xf
denotes the severity level of Ei under the operational status ofXf, is a risk index of the operational status
( f) isk
R X
f
X .
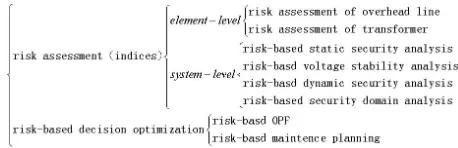
[image:1.595.305.534.646.720.2]2.2. Contents of Power System Risk Assessment
Figure 1 shows main content of domestic and foreign study currently about power system operational risk as-sessment and relationship between them. Risk-based se-curity assessment can be divided three categories: ele-ment-level risk assessment, system-level risk assessment
and
valuation typically in
2.3. Risk Assessment Methods of Power System
Re ission
e-scale grids, regional grid is closed- lo
rom 10 kV/6 kV to 66 kV
source, including large grid and a va
nes;
ble lines; op or w
increasing capacity of single load and dy
ct grid equipments lack some data acqui-si
assessment is mainly used for dispatching de
3.1. Status Selection
ion for planning department
se-3.2. Network Modeling
traditional reliability-based
etwork. The fu
risk-based decision optimization. The method of power system risk e
cludes 4 steps: determining ① component outage models; ② selecting system states and calculating their probabilities; ③ evaluating the consequences of se-lected system states; ④ calculating the risk indices.
According to different objects’ characteristic, different risk assessment methods should be adopted [5]. For simple systems, there are 4 fundamental approaches: the prob-ability convolution, series and parallel networks, Markov equations, and frequency-duration approaches. For a large-scale and complex system, risk assessment methods include status enumeration and Monte Carlo simulation. The latter can be divided into sequential and non-se- quential sampling method.
3. Algorithm Design of Online Power Supply
Risk Assessment for Regional Grid
gional grid is a composite generation and transm system, whose risk assessment includes 4 main aspects: determination of component failure and load curve model, selection of system status, identification and analysis system problems, and calculation of reliability indices. Both the status enumeration and Monte Carlo simulation can be applied to regional grid risk evaluation. The two methods use different approaches to select system status and have different forms of formulas to calculate risk indices. The techniques of identifying and analyzing problems in system status are the same. These include power flow calculation and expected contingency analy-sis for problem recognition and the optimal power flow for remedial actions.
Compared with larg
op design but open-loop operation, and has more com-plex wiring modes and operation modes. In this paper, we study the grid between 500kV substation and the load supplied by the substation directly or indirectly. The characteristics are as follows[3]:
1) Complicate voltage level, f / 220 kV/500 kV;
2) Various power
riety of distributed power source; 3) Coexistence of long and short li 4) Coexistence of overhead lines and ca
5) Complex network structure, running in open-lo eak-link style;
6) Constantly namic load; 7) Part distri
tion or have poor data acquisition such as voltage, reac-tive power, acreac-tive power transformer tap because of
in-terest, skill level or some special connection, T tie line, for example.
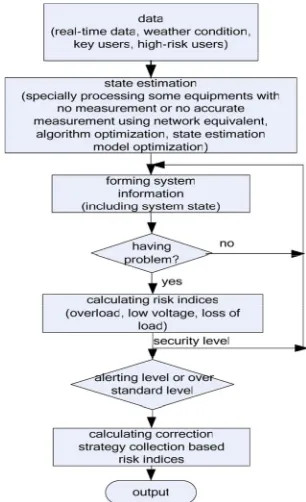
Online risk
[image:2.595.345.498.467.718.2]partment, only considering steady analysis. Based on present research, the calculation process of online power supply risk analysis for regional grid is illustrated in Figure 2, which doesn’t consider the impact of human decision.
Operational risk evaluat
lects system status with state enumeration or Monte Car-lo simulation method. The software in this paper is based regional smart grid dispatching technical supporting sys-tem, so it can get operation state by fully using telemetry and teleindication data. The probability of present system status is 1.
It is not suitable to copy
“branch-bus model” when modeling power network structure, which is feasible for planning and designing department when approximate model (node model), based on improved state estimation, we obtain network computing model (bus model) by network connectivity analysis, which can be changed with switch state so it can meet the demand of real-time condition.
Regional grid is high voltage distribution n
ndamental task of regional grid dispatching is to assur-ance grid’s security, economic, high-quality operation,
to guar needs
ponent Failure Models
controlled by regional gri
ly include overhead lin
ime Reliability Model
D head lines
htning and Line Icing is fu
antee the interests of users, to adapt to the of economic construction and people's living, in particu-lar to ensure safety and sustainable power supply for high-risk customers and important users. However, lots of high risk customers and important users connect to grid by low-voltage side, so under current technology, it is difficult to get detailed physical model of the whole grid by SCADA, especially low-voltage side grid. Cor-responding to the network which can not model by SCADA, we developed associated model interface of high risk customers and key users by introducing data-base and visualization technology and making fully use of staff report and statistical data in order to assurance the model of customers in low-voltage side more closely to reality. Associated modeling refers to obtain informa-tion of devices being associated by the informainforma-tion of associated devices. Here, associated devices are the vices with telemetry and teleindication data, and the de-vices being associated are high-risk and important cus-tomers.
1) Com
The generation unit capacity
d EMS is generally small, so we utilize the two-state (up and down) model as the failure model of generating units, not considering dated states.
Transmission components main
es, cables, transformers, capacitors, and reactors. In general, these components are presented using two-state (up and down) model.
2) Component Real-T
uring the operation of the power system, over
operation conditions are more complex and most se-verely affected by uncertain factors such as climate en-vironmental and so on, which have different influence characteristics to the overhead lines. In this paper, a method of dealing with uncertainty information based on the fuzzy theory was adopted of appointment, and com-bined with the actual operation conditions of the power system; the overhead line fault probability model is es-tablished. That the failure rate of the overhead lines is the overhead line outage probability multiplied by a correc-tion factor of the weather on the outdoor component outage probability impact. Weather factors affect the rate of overhead line fault considering temperature, wind speed, lightning and Line Icing.
Temperatures, wind speed, lig
zzy uncertain factors, which are different from random factors, there is no exact probability distribution and classical probability statistical methods can not be used to describe it. The fuzzy set theory introduced by Zadeh Professor is a powerful tool to deal with and descript the fuzzy uncertain factors. The fuzzy set allows for the de-scription of concepts in which the boundary is not sharp. Besides, a fuzzy set concerns whether an element
be-longs to the set and to what degree it bebe-longs. It does not consider the situations where elements do not belong to. As a result, the range of fuzzy set is in [0, 1]. A fuzzy set is mathematically defined by Zadeh as:
, A( )
A x x xX (2)
where is the membership function of
(3)
For the fuzzy set A, the value of the membership func-tio
lishing the membership function in
unction of lightning impact tor to de
of lightning disasters impact on
in A, and X is the universe of objects with elements x. In the case of the classical “crisp” set A, membership of x in A can be viewed as a characteristic function that can obtain two discrete values:
1; ( ) {
0;
A
ifx A
x
ifx A
n can be anywhere between 0 and 1, making it differ-ent from a crisp set. Membership function of a fuzzy set expresses to what degree the value of x is compatible with the concept of A.
The method of estab
clude weighted method, fuzzy statistics, expert scoring method, interpolation ,standard function method and so on. There is strong uncertainty to the impact of climate change for overhead lines running. In this paper, based on the long-term experience of dispatcher to judge for these types of environmental factors and determine the membership function.
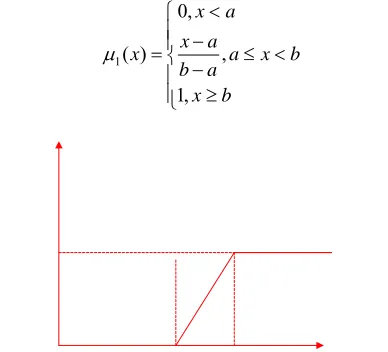
a) The membership f
The density of lightning is an important indica termine the lightning degree of a region. Lighting Lo-cation System (LLS) can automatically measure and re-cord the density of lightning. Lightning protection design standards also adopt lightning density as a reference. The membership function of the lightning effects identified here as shown in Figure 3:
The membership function overhead lines running as:
1
0,x
( ) ,
1,
a
x a
x a x b
b a
x b
(4)
[image:3.595.325.519.533.709.2]where in (4) a and b is the lightning density threshold determined according to the experiences of the dispatch-ing personnel, In other words, it does not affect while the lightning density is less than the lower limit threshold value a, and the influence coefficient is 0, otherwise, higher than the high limit threshold value b is considered a greater impact, influence coefficient is 1.
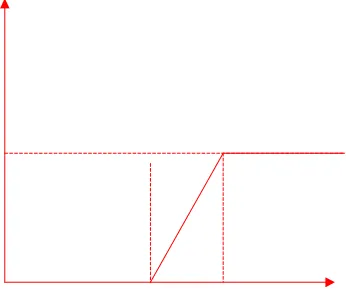
b) The membership functions of wind speed and line Ic
d speed can be obtained by the meteorological de
he wind speed, in μ2 (x), A is the impact thresh-ol
membership function of temperature impact on ov
ure forecast information can be obtained by
perature impact on ov
ing Win
partment forecast; while ice thickness for the line, air humidity, temperature and wind size the extent of ice damage has a larger impact, not yet theoretical or em-pirical model to predict the extent of ice cover based on meteorological conditions, we use the actual ice thick-ness measurement indicators to assess the severity of the ice storm. Wind speed and line of ice thickness with the fall line health density similar to lighting, the same form of the membership function μ2(x), μ3(x), shown in Fig-ure 4:
For t
d value determined according to the experiences of the dispatching personnel, b is the critical value determined catastrophe occur; Line Icing μ3 (x), a and b are respec-tively the upper and lower critical value of ice thickness impact.
c) The erhead lines The temperat
contact with the meteorological department. Within the normal temperature range, the temperature did not affect the line running, so the value is set at 0; when the temperature is too low or too high, its influence is large, and the function value is set to 1. The membership func-tion shown in Figure 5 below:
[image:4.595.348.516.81.200.2]The membership functions of tem erhead lines as:
[image:4.595.363.466.241.342.2]Figure 4. The membership function of the wind speed and line Icing.
Figure 5. The membership functions of air temperature.
4
1,
,
( ) 0,
,
1,
x c
a x
c x a
a c
x a x b
x b
b x d
d b
x b
(5)
where in formula 5, a, b, c and d determined according to
e segmentation, the fuzzy number ve
the experiences of the dispatching personnel are the im-pact threshold value that air temperature imim-pact on over-head lines running.
Any overhead lin
ctor composed by the membership function of various impact factors is determined as follows
R [ , , , ] r ri1 i2 r ri3 i4 (6)
where ri1, ri2, ri3 and ri4 successively corresponds the
fuzzy numbers that lightning, wind speed, line icing and temperature affect the segment i line outage probability , Definition B = [B1, B2, B3, B4] as the weight coeffi-cients of line fault outage rate considering four influence factors, then:
1 2
[ , , ,n]
A R B (7)
where, i in
is the impact factor of the i-th overhead lines consider g the four influential factors. Set the outage rate of overhead lines acquired from historical statistics is , and after correction by the influencing factors of ove ead line outage rate is rh λi, then:
(1 ) ,(1 ) 1 1,(1 ) 1
i i
i
i
(8)
3.3. Selection and Analysis of Expected Fault
We can fault collection by integrat-Collection
obtain the expected
[image:4.595.104.277.542.687.2]substation, single power source to substation, then it can be got the fault group which would influence the security of power supply; 3) Defining the fault group by experi-enced dispatchers and operation analysts via visual man- machine interface;
The expected fault set formatted by 1) and 2) has in-cl
requirements for co
ally ha
3.4. Risk Indices
risk indices appropriate for regional
: de
upply security of important users and high ris
in
3.5. Risk Level
an quantify the risk of system, but for
3.6. Risk-based Correction Strategy Set
op
opera-d Control for High-voltage Distract G
ed on sensibility calculation, integrating planning m
n Con-tro
r distract grid, the operation mode is usually radial op
4. Conclusions
to determine the possibility of com-uded most accidents of high frequency and high risk. 3)
is only as a necessary complement, which can reduce the manual workload and maintenance.
Online calculation software has high
mputing speed. In paper [6], the author combined fault enumeration and probability sampling method, and im-proved computing speed by parallel computing in the foreground and background. This approach has two shortcomings: first, it increased hardware cost; second, it raised inaccuracy by adopting fault sampling mode. We absorb results of existing “static security analysis” re-search to analyze fault, which can satisfy computing speed requirement. This fault analyzing method utilized AC-DC hybrid algorithm, and has introduced parallel computing technology based on multi-processor work-station. The approach has been improved by combining with node optimization, matrix inversion and node type conversion, etc, which has greatly improved computing speed. The correctness has been verified by the applica-tion in regional-level scheduling, provincial scheduling and city-level scheduling. For the test of 2000 nodes sys-tem, it only needs 3s scanning whole grid lines, trans-formers and units. The computing time would slightly increase with the increase of limit violation number.
As important users and high risk customers gener ve double power source, if not considering hot backup source in fault analysis, the risk indices of loss of load computed would deviate greatly with actual situation. So when the main source of important users or high risk customers break down, it should be analyzed after put-ting into backup source.
It is presented three
grid in this paper according to formula(1): ①line over-load risk; ②bus low-voltage risk; ③loss of load risk.
We compute risk indices ①,② by the formula, here notes the limit violation of line power flow and bus voltage; X denotes security upper limit or lower limit; the superscript 2m is used to overcome the "shelter" de-fect[4].
The power s
k customers is related to a range of social, political and economic issues. The outage severity of these users de-pends not only on the district grid’s own characteristic, but also on the users’ property. We introduced an impor-tance factor to classify these users, and because of lack-ing outage time, we only compute loss of load risk
indi-ces, not outage cost evaluation indicators. The computing formula of risk ③ is as, here: is the importance of the jth load; denotes the reduction amount of the jth load after failure I; is the load number of reduction.
We adopted real-time failure probability model denot-g the probability. For outdoor components, the weather condition value is set by dispatchers; for indoor compo-nents, the weather condition value is constantly equal to 0.
The risk indices c
dispatchers, it is more expected that the risk indices can directly show the system security condition. So we clas-sified three risk grades according the risk value: security level, alerting level and over standard level.
Distract grid is closed-loop design but open-lo
tion. When recovering, the distract high-voltage grid (220 kV and above) and radial distribution grid lower than 110 kV, different correction and control measures should be adopted.
a) Correction an rid
Bas
ethod and objective function selecting, then giving the control target and control variable, the correction meas-ure can be obtained for load and generation unit.
b) Distract Low-voltage Radial Grid Correctio l
Fo
eration under close-loop. It is generally adopted ad-justing operation mode as effective measure to ensure continuous power supply and eliminate limit violation. The correction strategy includes load balance, single power source switch, multi-source load transfer, etc. In extreme cases, it can be adjusted by removing load ac-cording to load importance. After eliminating fault, sys-tem recovery takes into account recovery path constraints and risk indices constraints.
It is often difficult
REFERENCES
[1] CIGRE Task ystem security as-sensitivity to the weather. After getting the model, when analyzing, it adopt AC-DC hybrid algorithm, and has introduced some advanced technology, including parallel computing, dynamic node ordering optimization, matrix inverse optimization, etc. The expected contingency col-lection almost includes all accidents of high frequency and high risk. And the computing speed can fully meet the requirement of online analysis of power system. For the characteristic of regional grid, by integrating SCADA, man-machine visual technology, it can assist dispatchers make decisions. It can raise power grid dispatching level from current artificial analytical mode up to automatic smart mode.
Force 38.03.12. Power s sessment. Electra, Vol. 175, 1997, pp. 49-77.
[2] Wanh, J. D. Mccalley and V. Vittal, “Increasing Thermal Rating By Risk Analysis,” IEEE Trans on Power Systems, Vol. 14, No. 3, 1999, pp. 815-828.doi:10.1109/59.780891 [3] W-H. Fu, Mccalleyjd and V. Vittal, “Risk Assessment for
Transformer Loading,” IEEE Transaction on Power Sys-tems, Vol. 16, No. 3, 2001, pp. 346-353.
doi:10.1109/59.932267
[4] Y. Q. Feng, W. C. Wu, H. B. Sun, et a1., “A Preliminary
Investigation on Power System Operation Risk Evalua-tion in the Modern Energy Control Center,” Proceedings of the CSEE, Vol. 25, No. 13, 2005, pp. 73-79.
[5] N. Ming, J. D. McCalley, V. Vittal, et a1., Online
Risk-based Security Assessment,” IEEE Transaction on Power Systems, Vol. 18, No. 2003, pp. 258-265.
doi:10.1109/TPWRS.2002.807091
[6] H. J. Shi, G. Fei and M. Ding, “Research on On-line As-sessment of Transmission Network Operation Risk,”
Power System Technology, Vol. 29, No. 6, 2005, pp.