SAR Imaging of Moving Target Based on Quadratic Phase
Function
Chao Wang, Shaobin Li
School of Electronics information Engineering Harbin Institute of Technology Harbin, China. Email: [email protected], [email protected]
Received March, 2013.
ABSTRACT
In this paper, a novel signal processing technique has been developed to refocus moving targets image from their smeared responses in the Synthetic Aperture Radar (SAR) image according to the characteristics of the received signals for moving targets. Quadratic Phase Function is introduced to the parameters estimation for moving target echo and SAR imaging. Our method is available even under a low SNR environment and acquiring an exact SAR image of mov- ing targets. The simulated results demonstrated the validity of the algorithm proposed.
Keywords: Synthetic Aperture Radar; Moving Targets; Quadratic Phase Function
1. Introduction
Airborne synthetic aperture radar (SAR) detection and imaging of moving targets on the ground has been a sub- ject of long-standing interest in both civil and military applications such as battlefield reconnaissance, fire as- sessment, traffic management and monitoring ocean cur- rents. If there are moving targets in the observed scene, SAR cannot simultaneously produce clear images of both stationary and moving targets because they have different Doppler frequency respectively, the target motion in- duced phase errors, which interact with the matched filter processing or cross-range compression, cause these im- ages to be mislocated in the cross-range dimension and smeared in both the cross-range and the range domains, we can only focus on either the stationary target or the moving target. How to detect moving targets in the background of stationary objects called clutter is premise for SAR imaging of moving targets, this problem is usu- ally solved by applying the displaced phase center an- tenna (DPCA) [1] or its modern extension, the space- time adaptive processing (STAP) [2]. Radar returns from terrain and stationary objects can be suppressed after using DPCA or STAP, only the returns from moving targets are used to reconstruct radar images.
Moving targets echo signal is generally characterized by the linear frequency modulated (LFM) signal, before obtain the focused images of moving targets, the pa- rameters of LMF should be estimated firstly, and then construct correct match filter of range and azimuth direc- tions for imaging. In which, initial frequency and chirp
rate as the basic parameters of LMF, their estimation problem has been an important research content of the signal processing. In previous investigations, several parameter estimation methods based on Maximum Like- lihood (ML) [3] estimation cannot be implemented in engineering because of a huge amount of computation. Some signal processing methods such as Radon-Wigner Transform (RWT) [4], Radon-Ambiguity Transform (RAT) [5], Fractional Fourier Transform (FrFT) [6] have been usually used in estimation of LMF parameters. It is worth mentioning that WVD combine with Radon Transform as a commonly used method of detection and estimation for LMF can achieve an idea result. However, there is cross-term interference associated with the WVD. When the signal contains more than one component, the WVD will generate cross-term interference between components that occurs at spurious locations of the time-frequency plane.
In this paper the Quadratic Phase Function (QPF) [7] [8] is introduced to the SAR moving target imaging, and a new SAR imaging algorithm based on the Quadratic Phase Function is presented. This method can achieve an idea result for moving targets imaging. The simulated results demonstrate the validity of this algorithm.
2. Radar Returns of Moving Targets
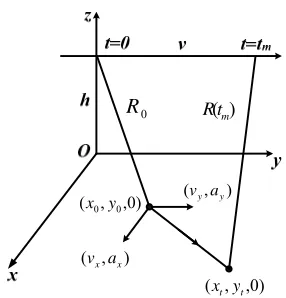
the earth. The scene of a side-looking SAR and a moving target is illustrated in Figure 1.
0
R R t( )m
) 0 , , (x0 y0
) 0 , , (xt yt
) , (vx ax
[image:2.595.100.243.120.269.2]) , (vy ay
Figure 1. Geometry of an airborne SAR and a moving tar- get
In the case of a moving point target, we assume that at a point target is located at , and the radar platform is located at . Then at time t the target moves to ( 0 x 0 y
and the platform moves to . Where xand x represent the azimuth velocity and acceleration of the point in azimuth direction respectively, yand y rep-resent the ground range velocity and acceleration of the point in ground range direction respectively. The range from the radar to the point target at time can be writ-ten as
0
t (x0,y0,0)
)
,y v ta v v
t
, 0 , 0 ( h 2 / 2 t ax ) , 0 , (vt h) 0 , 2 / 2 t t v
x y
a a 2 2 0 2 1
2 2 2 0 ( ) [( ) 2 ( ) 2 x x y y a t
R t vt v t x
a t
y v t h
]
(1)
which can be seen by expanding and approximating [9]:
0 0 0
0
0
2 2 2
0 0 2
0
( )
2 2
x y
x y x y x
x v y v x v
R t R t
R
v v v x a y a vv
t R
(2)
where the range component due to the radar motion is:
2 1 2 2 0 2
0) ]
[( )
(t vt x y h
Rradar (3)
and the range component due to the target motion is:
2 1
2
2 2 2
arg 0
2 1 2
2 0
( ) [( ) ( ) 2( )]
2 2
( ) 2 ( )]
2 2
y x
t et x y
y x
x y
a t a t
R t v t v t vt x
a t a t
v t y v t
(4)
where 0 is the initial range at , because 0 is much smaller than and is approximately equal
to , then the raw data can be described by:
R t0 x
0
R
y
00 R 0 0 2 2 2 0 0 2 ( )
exp{ 4 } exp{ 2 }
4
exp{ [( ) ] }
2
y
x y y
v R t
s( )t C j C j t
t
j v v v R a
R (5) In which t v t y
shift( )4
(6)
Equation (6) is a linear phase function due to the target velocity in the radial direction, and
2 2 2 0 0 4 ( ) ( ) 2
defocus x y y
t
t v v v R a
R
(7)
is a quadratic phase function determined by the relative velocity between the radar and the moving target in the
x
-direction---the radial velocity, and acceleration of the target.From the above phase functions we can see that by making use of a matched filter designed to match the baseband returns from a stationary target, the linear phase change due to the target’s radial velocity y in (6) causes the image of the moving target to be shifted in the cross-range direction, and the quadratic phase variation in (7) causes the image of the moving target to be defo- cused. So the present efforts in moving targets imaging require that estimations be made of targets motion before any imaging procedure can be performed.
v
3. Quadratic Phase Function
As to the LFM signal 21 2
( ) exp( )
s t b a ta t
a
a
, where b represents amplitude, 1and 2 represents initial fre- quency and chirp rate respectively. The Quadratic Phase Function Transform has been explained in detail by the reference [7, 8]:
d e t s t s u t QP ju
0 2 ) ( ) ( ) ,( (8)
Substitute
s
(
t
)
into equation (8), we can obtain:
0 ) 2 ( ) ( 2 2 2 2 2 2 1 ) , (
d e e b u tQP jat at j a u (9)
The parameter 2 can be found through peak search and the other parameters can be estimated by dechirp technology.
a
In which multi type of QPF is defined as:
L
l
l u t QP u
MQP 1
) , ( )
( (10)
And integral type of QPF is defined as:
t
dt u t QP u
IQP( ) (, ) (11)
where l is of time sample points. From the equa- tions (10) and (11), we can see that multi type or integral type of QPF can reduce cross-term interference effec- tively and then suitable for the analysis of LMF signal.
t
L
4. Application of Quadratic Phase Function
for SAR Imaging
In the section3, we have presented the Quadratic Phase Function algorithm to estimate the parameters of the LFM signal. In this section, we will discuss the SAR imaging techniques for moving targets based on Quad- ratic Phase Function algorithm, and the new approach for SAR imaging of moving targets can be illustrated explic- itly as follows:
Step 1. Range compression. Definition of range com-
pression reference function is described by:
)
exp(
)
(
2t
K
j
t
sref
r (12) where Kr v rrepresents chirp rate, while t repre- sents time value in range direction. In the case of point moving targets the acquired raw data after range com- pression can be written as in 2
2
[ ( )] [ ( )]
) (
1 t IFFT FFT s t FFT sref t
s (13) where and represent Fourier Trans- form operator and Inverse Fourier Transform operator respectively.
] [
FFT IFFT[]
Step 2. Azimuth compression function can be defined
as:
) exp(
)
( 2
1 tm j Krtm
sref
(14)where mrepresents the time value in azimuth direction. As to stationary targets, focused images could be achieved after equation (13) multiplying with equation (14), however the azimuth velocity of the moving targets will cause smearing effect in azimuth direction when processed by conventional image formation of stationary points. At this moment, we multiply every range cell with equation (14), the result can be written as in
t
) ( )
( )
( 1 1
2 tm s tm sref tm
s (15)
In order to counteract these smearing effects and get focused image, the parameters of should be taken into account during processing and for this purpose, the parameters should be estimated firstly, this is achieved by the following method named Quadratic
Phase Function in step 3.
)
(
2t
ms
Step 3. Estimate the chirp rate ˆ of , which can be written as s2
tm
,
max arg ˆ
, F
(16)
where F
, is the Quadratic Phase Function of
tm s2 .Step 4. According to the parameters which have al-
ready been estimated in step3, amended azimuth com- pression function is contrasted as in
] ) ˆ ( exp[ )
( 2
2 tm j Kr tm
sref
(17)Step 5. Using equation (17) to reconstruct azimuth
compression, we can obtain the focused SAR image of the moving targets finally. The detailed method is as fol- lows:
t,tm IFFT
FFT[s2
tm ] FFT[sref2
tm]
S (18)
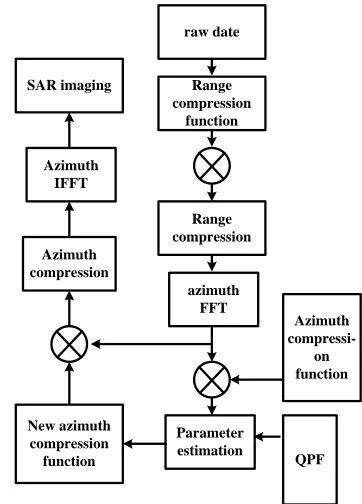
Based on the procedure above, we can obtain the fo-cused image of moving targets with the Quadratic Phase Function technique. The flow chart of this algorithm is illustrated in Figure 2.
Azimuth IFFT
SAR imaging Range compression
function
Azimuth compression
raw date
azimuth FFT
Azimuth
compressi-on function
Parameter estimation
Range compression
New azimuth compression
[image:3.595.329.510.363.615.2]function QPF
Figure 2. The flow chart of SAR imaging based on Quad- ratic Phase Function.
5. Computer Simulations
60 MHz, the pulse repetition frequency is PRF = 500, the pulse width is
w= 10 μs, the sampling frequency is Fs=70 MHz. The aircraft with the radar is moving along the x-axis with velocity v = 120 m/s, while the radar’s ground distance from the origin of the coordinate system connected to the targets is 8 Km at t = 0. The motion parameters of the targets are given in Table 1.Table 1 motion parameters of the targets used in experi- ment.
No. 1 2 3 4 5
x0(m) 0 30 5 -5 0
y0(m) 0 0 30 15 -30
Vx(m/s) 3 2.2 3.1 0 3
Vy(m/s) 0.7 1 0 0 1
ax(m/s2) 0 0 0 0 0
ay(m/s2) 0 0 0 0 0
Figure 3 is the SAR image of moving targets based on
Range-Doppler algorithm without parameter estimation, we can see that the image is blurred in azimuth direction.
Azimuth
R
a
nge
50 100 150 200 250 300 350 50
100
150
200
250
300
Figure 3. SAR imaging without parameters estimation.
Figure 4 is the result of SAR imaging after parameter
estimation, compared with Figure 3, we can see that the
blurred of azimuth direction has been removed and the moving targets has been focused.
Figure 5 and Figure 6 are the result of SAR imaging
when the SNR is -10 dB and -15 dB respectively, we can see that this method still effective when noise exists.
Azimuth
R
ange
50 100 150 200 250 300 350 50
100
150
200
250
300
Figure 4. SAR imaging based on Quadratic Phase Function.
Azimuth
Ra
n
g
e
50 100 150 200 250 300 350 50
100
150
200
250
300
Figure 5. SAR imaging based on Quadratic Phase Function with the SNR is -10 dB.
Azimuth
R
a
nge
50 100 150 200 250 300 350 50
100
150
200
250
300
6. Conclusions
In this paper, we introduce Quadratic Phase Function algorithm to estimate the parameters of the LFM signal and propose a new algorithm for moving targets imaging, which can acquire an exact SAR image even under a SNR environment. The effectiveness and practicability of this imaging approach are demonstrated by means of numerical experiments using simulated data.
REFERENCES
[1] H. S. Wang and C. Mainlobe, “Clutter Cancellation by DPCA for Space Based Radars,” IEEE Aero Space Ap-plications Conference, Crested Butte, CO, USA: IEEE, 1991. pp. 1- 128.
[2] R. Klemm, “Application of Space-time Adaptive Proc-essing,” The Institution of Electrical Engineers, London, 2004.
[3] T. J. Abatzoglou, “Fast Maximum Likelihood Joint Esti-mation of Frequency and Frequency Rate,” IEEE Trans-actions on Aerospace and Electronic System, Vol. 22, No. 6, 1986, pp. 708-715.doi:10.1109/TAES.1986.310805 [4] J. C. Wood and D. T. Barry, “Linear Signal Synthesis
Using the Radon-Wigner Transforms,” IEEE Transac-tions On Signal Processing, Vol. 42, No. 8, 1994, pp. 2105-2111.doi:10.1109/78.301845
[5] M. S. Wang, A. K. Chan and C. K. Chui, “Linear Fre- quency-Modulated Signal Detection Using Ra-don-ambiguity Transform,” Vol. 46, No. 3, 1998, pp. 571-586.
[6] R. Tao, B. Deng and Y. Wang, “Research Progress of the Fractional Fourier Transform in Signal Processing,” Sci-ence in China (Ser. F, Information Science), Vol. 49, No. 1, 2006, pp. 1-25.
[7] P. O’Shea, “A New Technique for Estimating Instanta-neous Frequency Rate,” IEEE Signal Processing Letters, Vol. 9, No. 8, 2002, pp. 251-252.
doi:10.1109/LSP.2002.803003
[8] P. O’Shea, “A Fast Algorithm for Estimating the Pa-rameters of a Quadratic FM Signal,” IEEE Transactions On Signal Processing, Vol. 52, No. 2, 2004, pp. 385-393. doi:10.1109/TSP.2003.821097
[9] V. C. Chen “Time-Frequency Transforms for Radar Im- aging and Signal Analysis,” Artech House. 2002.
[10] L. Hong, “Analysis of Multi-component LFM Signals by the Integrated Quadratic Phase Function,” Journal of Electronics & Information Technology, Vol. 31, No. 6, pp. 2009, pp. 1363-1366.