http://dx.doi.org/10.4236/jep.2013.411138
Spatial Variation of Dissolved Nutrient and Heavy Metal
Concentrations in River Bed Sediments as Influenced by
Land-Use Patterns in Ogun-Osun River Basin, Nigeria
Adebayo Oke1*, Abimbola Sangodoyin2, Kayode Are1, Ayodele Adelana1
1Obafemi Awolowo University, Institute of Agricultural Research and Training, Land and Water Resources Management Programme,
Moor Plantation, Ibadan, Nigeria; 2Agricultural and Environmental Engineering Department, Faculty of Technology, University of
Ibadan, Ibadan, Nigeria.
Email: *[email protected]
Received July 25th, 2013; revised August 23rd, 2013; accepted September 24th, 2013
Copyright © 2013 Adebayo Oke etal. This is an open access article distributed under the Creative Commons Attribution License, which permits unrestricted use, distribution, and reproduction in any medium, provided the original work is properly cited.
ABSTRACT
Evaluation of levels and spatial characteristics of dissolved nutrients and heavy metals in the river bed sediment within a basin are critical to understanding the extent of land-use impact on the river systems. Surface river bed sediments across eight rivers in the Ogun-Osun River Basin in Nigeria were collected and analyzed for Total N, 3
4
PO, Total P,
Total organic carbon, Cd, Hg, Pb, Zn, Cu, Fe, Mn and Cr. Pollution Load Index (PLI), Accumulation Factor (AF) and Hierarchical Clustering Analysis (HCA) were used to identify the impact of the pollutants and also define the spatial variation across the basin. The pollution load indices of heavy metals were moderately high ranging from 0.41 - 0.60, while AFs were 0.43 - 2.00 and 0.61 - 1.29 for heavy metals and nutrients from upstream to downstream in the rivers systems, respectively. The HCA identified 7 distinct spatial patterns describing pollutant input from the land-use in the basin. Although, heavy metals contents were low in relation to the background values, and the potential for redistribu- tion and secondary pollution was high hence, there was need to impose checks on the activities across agricultural, ur- ban and grazing land-uses that had impact negatively on the river systems in the basin.
Keywords: Ogun-Osun; Bed Sediment; Pollution; Accumulation Factor; Hierarchical Clustering Analysis
1. Introduction
Changes in land-use patterns are directly altering the func- tioning of ecosystems worldwide [1]. The changes, how- ever, have significant impact on the nutrient concentra- tions, and concomitantly influence the quality of river water and water resources. These impacts can be nega- tive and positive [2]. Agriculture, forestry, metaliferous mining, smelting industry, urban related activities are some of the land-use/land-cover types that have been identified with varying impacts on the hydrological regimes of a basin. However, soils may be contaminated by heavy metals such as Zn, Cd, Pb and Cu due to sludge from these land-uses [3,4] while nutrient from animal manure and other related agricultural activities also contribute to the quality of sediments washed off the land surfaces [5]. Earlier observation by [6] shows that land-use has impact
on water quality through changes in sediment and nutri- ent loads, salts, metals and agrochemicals, influx of patho- gens and change in the temperature regime. Sediment can further act both as a physical and chemical pollutant. Physical contribution of sediment to pollution includes in- crease in turbidity, sedimentation leading to loss of down- stream reservoir capacity, destruction of coral reefs, loss of spawning grounds for certain fish while chemical pol- lution of sediment includes redistribution of adsorbed me- tals and nutrients as well as hydrophobic organic metals in the river systems [7].
River water quality is controlled by numerous natural and anthropogenic factors. For instance the water quality in the Tibetian Rivers in China is related to the mining activities in the region [8]. River sediments receive sig- nificant anthropogenic loads of metals and other pollut- ants from both point and non-point sources, which in- crease their natural concentrations. Metals, for instance,
from different sources normally accumulate together, most- ly in fine-grained fractions of sediments [9]. To this ex- tent, researchers have identified river sediments as a re- liable medium in the study of river pollution and for con- firmation of impairment status and possible sources of pollutants when studying river pollution [10-12].
In Nigeria, there have been increasing pressures on land and water resources in an attempt to increase the production of food, fiber, fuel wood, and feeds for the growing population. This agricultural intensification has led to a substantial increase in the rates of fertilizer ap- plications, use of sludge, animal and industrial wastes, which both improve yields and have deleterious conse- quences for downstream aquatic systems, where nutrient loading can drive eutrophication [13]. Efforts have been channeled to understand the water quality status of rivers in Nigeria, even though very often, the spatial scale does not always encompass the immediate hydrological basin in such investigations. Thus, the major hydrological ba- sins that describe the nation water resources systems are not adequately described in terms of pollution and pol- lutants distribution; while assessments of water quality in relation to most rivers are location specific without a
clear picture of status of river systems at the basin level. Even then, the extent of sediments pollution as a possible source of secondary pollution has not been given much attention, most often, sediment characterizations are not always included in environmental assessment except in response to specific events. This has resulted in paucity of information on the status of river bed sediment quality in relation to heavy metals and other nutrient levels across Nigerian hydrological basins. Hence, there is limitation to the understanding of the impact on surface water re- sources generally in Nigeria. Therefore, this study was designed to: 1) assess the spatial variations of nutrient concentrations and heavy metals pollutants; and 2) de- termine the contribution of river bed sediments to water pollution as influenced by land-use patterns along Ogun and Ona river catchments of Ogun-Osun River Basin in Nigeria.
2. Materials and Methods
2.1. Description of the Study Area
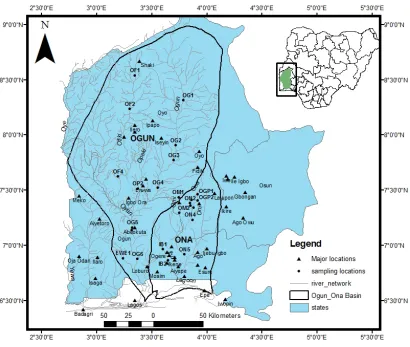
The study areas (Figure 1) cover the Ogun and Ona catch-
[image:2.595.94.504.380.727.2]ments (approx. 29,000 km2), about 65% of the Ogun-
Osun River Basin (OORB) in Nigeria. The OORB is one of the 12 delineated hydrological basins describing Nige- ria land area. River bed sediments of 8 rivers were as- sessed from 24 locations across the catchments. Land-use patterns within the study catchments are interspersed majorly with urban, agricultural, grazing grassland and forest as the major land-use types. Ogun and Ona rivers drain the Ogun and Ona catchments respectively with other rivers (Ogunpa, Ofiki, Ibu, Omi, Ewekoro and Opeki) serving as major tributaries [14]. The rainfall within the basin ranged between 990 ± 62 mm - 1500 ± 87 mm from upstream north to the downstream south. The Ogun, Ona, Ogunpa, Ofiki and Ibu rivers are perennial while Omi, Ewekoro and Opeki rivers are seasonal. However, all the rivers are sources of water either as raw water for treatment plants, direct use for domestic supply by rural populace across the basin or for agricultural purposes.
2.2. Sediment Sampling and Quality Indicators
Sediment samples were collected at 0 - 20 cm depth in 24 locations across the catchments using bucket auger. The samples were collected in February 2011, a period char- acterized with low rainfall in the study area. To ensure representative sampling, bulk sediment samples in each location were composite of 3 sub-samples. The samples were stored in an acid (HNO3) washed plastic bags for
laboratory analyses.
2.3. Laboratory Procedures
The sediment samples were air dried, crushed and al- lowed to pass through 2 mm mesh size, and then stored in glass bottles for subsequent analysis. Total organic carbon (TOC) content was determined using wet diges- tion method [15]. Total nitrogen (TN) was determined by Kjeldahl method [16]. Total phosphorus (TP) was deter- mined using ascorbic acid method for the digested solu- tion [17]. A molybdate colourimetric test was used to determine -P content in the digested solution [17]. For the analysis of heavy metals (Cadmium-Cd, Mer- cury-Hg, Lead-Pb, Zinc-Zn, Copper-Cu, Iron-Fe, Man- ganese-Mn and Chromium-Cr), subsamples of the air- dried sediment samples were oven-dried at 105˚C for 24 hr and thereafter sieved using 500 micron sieve. 100 mg of the sample was digested with a mixture of 6 ml HF; 4 ml HNO3 and 1 ml HClO4 following [18]. All analyses
were carried out in triplicate by direct aspiration into BUCK 211 Atomic Absorption Spectrophotometer Model against the standard concentration of the metals.
3 4
PO
2.4. Statistical Analysis
Descriptive statistics were performed on the data. The Duncan Multiple Range Test (DMRT) was used to com-
pare the sediment pollutant characteristics across the riv- ers. Pearson correlation analysis was carried out to evalu- ate relationships among variables and across the loca- tions. Significant relationships were established among the variables at P < 0.05 unless otherwise stated. Hierar-
chical cluster analysis (HCA) was applied to the river se- diment quality data set to group similar sampling loca- tions (spatial variability) across the river basin [19,20]. In this approach, clusters are formed sequentially by start- ing with the most similar pair of objects and forming hi- gher clusters step by step. The Euclidean distance usually gives the similarity between two samples and a “dis- tance” can be represented by the “difference” between analytical values from both samples. The HCA was per- formed on the normalized data set by means of the Ward’s method, using Euclidean distances as a measure of simi- larity. All statistical analyses were performed using SPSS 16.0 software.
2.5. Pollution Load Index and Accumulation Factor
Pollution Load Index (PLI), the potential of a metal to cause secondary pollution in river water at observed con- centration, was computed as described by [21].
PLI = n√ (Product of
n number of CF values) (1)
Where: n = Number of Metals CF Contamination Factor
Concentration of metal Background value of metal
(2) The world average concentrations of Cu (45 mg/kg), Zn (95 mg/kg), Fe (46,000 mg/kg), Mn (800 mg/kg), Pb (20 mg/kg), Cr (100 mg/kg) and Cd (0.3 mg/kg) were considered as the background values [21].
The degree of accumulation of sediment pollutants along the river courses was estimated by the Accumulation Factor (AF). The AF is the ratio of average concentration of a given parameter downstream (after a source dis- charge) to the corresponding average concentration up- stream (before the source discharge) [22].
3. Results and Discussion
3.1. Bed Sediment Nutrients and Heavy Metal Concentrations
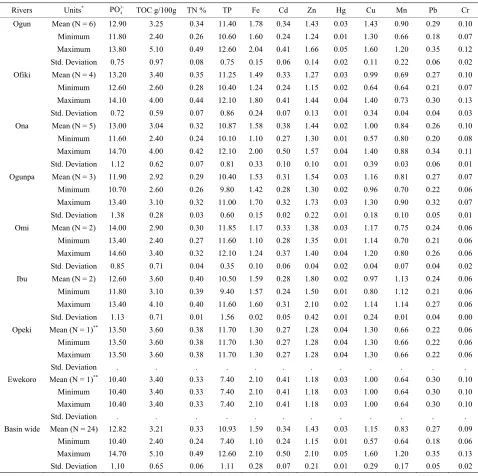
Table 1 shows the characteristics of nutrients and heavy
metals in the river courses. The mean -P observed in the basin was 12.8 ± 1.09 mg/kg. The highest concen- tration of 14.7 mg
3 4
PO
3 4
PO -P/kg was observed in Ona river and the least (10.4 mg -P/kg) in Ewekoro river. The mean TP was 10.9 ± 1.11 mg/kg in the catchments. Ogun river had the highest TP of 12.1 mg/kg while Ewekoro had the least TP of 7.4 mg/kg in the basin. The
3 4
Table 1. Concentration of sediment quality indicators in the river basin.
Rivers Units* 3
4
PO TOC g/100g TN % TP Fe Cd Zn Hg Cu Mn Pb Cr
Ogun Mean (N = 6) 12.90 3.25 0.34 11.40 1.78 0.34 1.43 0.03 1.43 0.90 0.29 0.10
Minimum 11.80 2.40 0.26 10.60 1.60 0.24 1.24 0.01 1.30 0.66 0.18 0.07
Maximum 13.80 5.10 0.49 12.60 2.04 0.41 1.66 0.05 1.60 1.20 0.35 0.12
Std. Deviation 0.75 0.97 0.08 0.75 0.15 0.06 0.14 0.02 0.11 0.22 0.06 0.02
Ofiki Mean (N = 4) 13.20 3.40 0.35 11.25 1.49 0.33 1.27 0.03 0.99 0.69 0.27 0.10
Minimum 12.60 2.60 0.28 10.40 1.24 0.24 1.15 0.02 0.64 0.64 0.21 0.07
Maximum 14.10 4.00 0.44 12.10 1.80 0.41 1.44 0.04 1.40 0.73 0.30 0.13
Std. Deviation 0.72 0.59 0.07 0.86 0.24 0.07 0.13 0.01 0.34 0.04 0.04 0.03
Ona Mean (N = 5) 13.00 3.04 0.32 10.87 1.58 0.38 1.44 0.02 1.00 0.84 0.26 0.10
Minimum 11.60 2.40 0.24 10.10 1.10 0.27 1.30 0.01 0.57 0.80 0.20 0.08
Maximum 14.70 4.00 0.42 12.10 2.00 0.50 1.57 0.04 1.40 0.88 0.34 0.11
Std. Deviation 1.12 0.62 0.07 0.81 0.33 0.10 0.10 0.01 0.39 0.03 0.06 0.01
Ogunpa Mean (N = 3) 11.90 2.92 0.29 10.40 1.53 0.31 1.54 0.03 1.16 0.81 0.27 0.07
Minimum 10.70 2.60 0.26 9.80 1.42 0.28 1.30 0.02 0.96 0.70 0.22 0.06
Maximum 13.40 3.10 0.32 11.00 1.70 0.32 1.73 0.03 1.30 0.90 0.32 0.07
Std. Deviation 1.38 0.28 0.03 0.60 0.15 0.02 0.22 0.01 0.18 0.10 0.05 0.01
Omi Mean (N = 2) 14.00 2.90 0.30 11.85 1.17 0.33 1.38 0.03 1.17 0.75 0.24 0.06
Minimum 13.40 2.40 0.27 11.60 1.10 0.28 1.35 0.01 1.14 0.70 0.21 0.06
Maximum 14.60 3.40 0.32 12.10 1.24 0.37 1.40 0.04 1.20 0.80 0.26 0.06
Std. Deviation 0.85 0.71 0.04 0.35 0.10 0.06 0.04 0.02 0.04 0.07 0.04 0.02
Ibu Mean (N = 2) 12.60 3.60 0.40 10.50 1.59 0.28 1.80 0.02 0.97 1.13 0.24 0.06
Minimum 11.80 3.10 0.39 9.40 1.57 0.24 1.50 0.01 0.80 1.12 0.21 0.06
Maximum 13.40 4.10 0.40 11.60 1.60 0.31 2.10 0.02 1.14 1.14 0.27 0.06
Std. Deviation 1.13 0.71 0.01 1.56 0.02 0.05 0.42 0.01 0.24 0.01 0.04 0.00
Opeki Mean (N = 1)** 13.50 3.60 0.38 11.70 1.30 0.27 1.28 0.04 1.30 0.66 0.22 0.06
Minimum 13.50 3.60 0.38 11.70 1.30 0.27 1.28 0.04 1.30 0.66 0.22 0.06
Maximum 13.50 3.60 0.38 11.70 1.30 0.27 1.28 0.04 1.30 0.66 0.22 0.06
Std. Deviation . . . . . .
Ewekoro Mean (N = 1)** 10.40 3.40 0.33 7.40 2.10 0.41 1.18 0.03 1.00 0.64 0.30 0.10
Minimum 10.40 3.40 0.33 7.40 2.10 0.41 1.18 0.03 1.00 0.64 0.30 0.10
Maximum 10.40 3.40 0.33 7.40 2.10 0.41 1.18 0.03 1.00 0.64 0.30 0.10
Std. Deviation . . . . . .
Basin wide Mean (N = 24) 12.82 3.21 0.33 10.93 1.59 0.34 1.43 0.03 1.15 0.83 0.27 0.09
Minimum 10.40 2.40 0.24 7.40 1.10 0.24 1.15 0.01 0.57 0.64 0.18 0.06
Maximum 14.70 5.10 0.49 12.60 2.10 0.50 2.10 0.05 1.60 1.20 0.35 0.13
Std. Deviation 1.10 0.65 0.06 1.11 0.28 0.07 0.21 0.01 0.29 0.17 0.05 0.02
N is the number of location sampled per river which was used in the computation; *unit is mg/kg except as indicated; **Opeki and Ewekoro are small rivers sampled at one location each (N = 1) included as part of the entire sampling network in the basin.
higher concentration of P forms in Ogun-Osun river ba- sin could be related to the use of fertilizers, especially P- fertilizers, laundry soaps and discharge of wastewater in the river systems. Waste disposal in the basin especially within the urban area is not adequately controlled since Nigeria has weak legislation and regulations on the han- dling, disposal and use of municipal wastes and fertilizers across agricultural land-uses [23]. Also, river Ewekoro flows across the Sagamu axis (in the downstream), a se- mi-industrial area where cement production are pre-do-
minant coupled with mining of rock phosphate. The ob- served phosphate and total phosphorous range in the se- diment were high and this could contribute to secondary pollution in the river system.
3 4
PO-P showed the influx of organic and nutrient con-
tent from major land-use into the river system which contributed to the observed sediment quality. Whereas rivers Ogunpa, Omi and Ona are purely urban drainages, Ogun and Ofiki drain agricultural, urban and grazing land-uses. It has been observed that agricultural soils can contribute up to 220 kg·C·ha−1·yr−1 of soil carbon in
eroded soil [24]. Rivers Ewekoro and Opeki are within agricultural sub-urban land-use and therefore, the input from urban and agricultural runoff contributes to the sediment quality of the Opeki, Omi and Ewekoro rivers.
There were variations in river bed heavy metals among the sampling locations across the basin. Figures 2 and 3
showed the distributions of Fe, Cd, Zn, Hg, Cu, Mn, Pb and Cr. The minimum Fe observed in the sediment was 1.1 mg/kg in ON4 and maximum concentration of 2.1 mg/kg in EW1. The observed Fe concentration in OG3, ON3, OG4, OG5 and OF1 were higher than other sam- pled locations. This could be due to the urban land-use in those locations except OF1 which is located in the agri- cultural area upstream of the Ogun River. Zn ranged be-
tween 1.2 mg/kg (OF3) and 2.1 mg/kg (IB2). The general observation of heavy metals in the sediment across the basin showed that Fe, Zn, Cu, Mn, Cr and Pb did not exceed the world average in tropical rivers [25] as com- pared with Cd which exceeded the limit (0.3 mg/kg). This implies that the levels of metal in the sediments have not reached a limit that could be of major concern (except for Cd) even though this was not the case with heavy metals in the river water as earlier documented [26]. The variations in concentration of heavy metals across the locations reflect different levels of inputs across the catchment from anthropogenic activities and land-use characteristic [27].
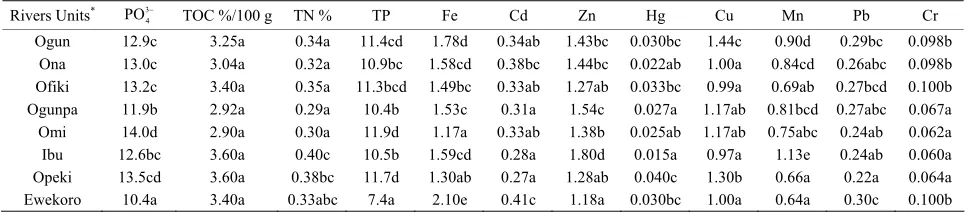
Among the rivers, significant differences (p < 0.05) existed in sediment quality indicators except for TOC
(Table 2). The DMRT separated the rivers according to
the level of significance of observed variable. River Ewe- koro draining a semi-urban catchment was significantly higher than other rivers in terms of Cd, Cr and Fe while Ogun, Ona, Ofiki and Omi are similar in 3
4
PO -P, TN,
[image:5.595.111.489.364.443.2]Cr and TOC.
[image:5.595.91.507.478.571.2]Figure 2. Distribution of Fe, Zn, Mn and Cu in sediments across rivers in Ogun and Ona basin.
[image:5.595.56.541.618.724.2]Figure 3. Distribution of Pb, Cr, Cd and Hg in sediments across rivers in Ogun and Ona basin.
Table 2. Mean separation of average values of sediment quality indicators.
Rivers Units* 3 4
PO
TOC %/100 g TN % TP Fe Cd Zn Hg Cu Mn Pb Cr
Ogun 12.9c 3.25a 0.34a 11.4cd 1.78d 0.34ab 1.43bc 0.030bc 1.44c 0.90d 0.29bc 0.098b
Ona 13.0c 3.04a 0.32a 10.9bc 1.58cd 0.38bc 1.44bc 0.022ab 1.00a 0.84cd 0.26abc 0.098b
Ofiki 13.2c 3.40a 0.35a 11.3bcd 1.49bc 0.33ab 1.27ab 0.033bc 0.99a 0.69ab 0.27bcd 0.100b
Ogunpa 11.9b 2.92a 0.29a 10.4b 1.53c 0.31a 1.54c 0.027a 1.17ab 0.81bcd 0.27abc 0.067a
Omi 14.0d 2.90a 0.30a 11.9d 1.17a 0.33ab 1.38b 0.025ab 1.17ab 0.75abc 0.24ab 0.062a
Ibu 12.6bc 3.60a 0.40c 10.5b 1.59cd 0.28a 1.80d 0.015a 0.97a 1.13e 0.24ab 0.060a
Opeki 13.5cd 3.60a 0.38bc 11.7d 1.30ab 0.27a 1.28ab 0.040c 1.30b 0.66a 0.22a 0.064a
Ewekoro 10.4a 3.40a 0.33abc 7.4a 2.10e 0.41c 1.18a 0.030bc 1.00a 0.64a 0.30c 0.100b
A strong correlation (p < 0.01) was observed between TOC, -P and TN. However, TOC did not correlate with TP. The correlation between TOC and
3 4
PO
3 4 PO-P
may relate to the particulate phosphorous in the sediment whereas, TP included the bounded and occluded phos- phorous which are not readily available and therefore not strongly related to the organic carbon content in the se- diment [28].
3.2. Correlation of Heavy Metals and Organic Load
There were inverse relationships among Fe, Zn, Mn with TOC in the sediment collected from Ogun river. These are similar to what were obtained in Ona and Ofiki rivers. These relationships with high R2 (between 0.62 and 0.85)
showed that Fe, Zn, and Mn content in the river bed sediment may not be associated with organic carbon le- vel alone, but also deposition of metals in particulate form.
Vuori [29] observed that the oxidized Fe particles in river water are removed by settling on the river bed where they may be periodically re-suspended depending on their size and the velocity of the current. During in- stream activities, Fe3+ oxyhydroxides are reduced to Fe2+,
some parts of the complex diffused upward and become oxidized while others could form other minerals and iron sulfide [29]. This dynamics may account for increased level of Fe outside the concentration bounded in the or- ganic matter [30]. The sorption and co-precipitation of metals by Fe-oxides decrease the bioavailability and tox- icity of water-borne metals [27]. The higher the concen- tration of heavy metals in the sediments, the higher the risk portends by such metal to initiate secondary pollu- tion with attendant health risks especially metals that are carcinogenic or mutagenic. Sediment-bound nutrients create a reserve pool which can be released back to the overlying waters, enhancing nutrient enrichment effects such as eutrophication [11,31].
The correlation between the metal concentrations and the organic matter content in the sediments has been shown by various researchers as a valid relationship that points towards pollution characteristics [31]. Although, adsorbed pollutants on the sediments may not be readily available for aquatic organisms, the variation of some physical and chemical characteristics of the overlying wa-ter may provoke the release of the metals back to the aqueous phase, hence under changing environmental con- ditions sediments may themselves become important pol- lution sources. This is a major danger in accumulation of metals in sediments of rivers and lakes. This phenome- non therefore, increases the possibility of secondary pol- lution which is much difficult to control or remediate in hydrological systems.
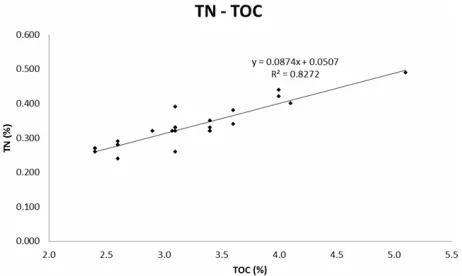
Location ON5 which is the last point on Ona river had the highest phosphate and TP. A high correlation (0.84, p < 0.05) was observed between and TP (Table 3)
across the basin which implies that much of the phos- phorous in the system are related to particulate phosphate [27]. Similarly, high correlation (0.91, p < 0.01) was equally observed between TOC and TN which confirms the understanding that high organic load is related to ni- trogen pollution in a water body. The relationship be- tween TOC and TN followed a linear regression (Figure 4). Lack of correlation of phosphate with metals on the
other hand was because phosphates released during an- aerobic decomposition are very soluble in water and are not bounded to sediment particles [32]. Soluble phos- phate easily contributes to phosphate in the river water. This substantiates the work of [33] which reported the significance of phosphorous compounds in eutrophica- tion of rivers in sub-Saharan Africa.
3 4
PO
There was no significant correlation between observed concentration of heavy metals in the sediment and loca- tions across the basin. This shows that the observed lev- els of sediment metals are not related to a specific loca- tion. This observation shows that there is a high homo- geneity in the anthropogenic characteristics which con- firm high diffuse (non-point) pollution in the river sys- tems of Ogun and Ona sub-basins.
3.3. Pollution Load and Accumulation Factor Pattern
[image:6.595.305.539.487.550.2]Figure 5 is the computed Pollution Load Index (PLI) of
Table 3. Correlation of nutrient elements in the sediment.
3 4
PO-P
TOC TN TP
3 4
PO-P
1.00 −0.02 ns −0.16 ns 0.84**
TOC 1.00 0.91* −0.15 ns
TN 1.00 −0.23 ns
[image:6.595.309.540.571.709.2]TP 1.00 *, **significant at p < 0.05 and 0.01 levels respectively; ns, not significant.
Figure 5. Heavy metals pollution load index across locations in the basin.
the heavy metals. The PLI shows the potential contribu- tion of the metals to pollution of the rivers in the basin. The PLI ranged between 0.44 and 0.61 across the loca- tions. OM1 had lowest PLI while OG5 had the highest PLI. The observed PLI was moderately high across the locations which show the impact of the heavy metals in the sediment quality and the potential to cause secondary pollution in the river systems across the basin. Figure 6
is the regression of PLI against TOC. A polynomial func- tion best describe the relationship with a low R2 (0.11).
Low R2 shows that pollution level loads in the sediment
do not depend entirely on the level of organic load in the sediment. Analysis of PLI is based on the relative depar- ure of individual observed metal concentration from the world average. When the observed concentration is within the background levels like it was with Cd (world average 0.3 mg/kg and range observed was 0.24 mg/kg - 0.50 mg/kg), the risk of secondary pollution or release of the particles laden with the metal into the water system will be high [21]. It was observed in the catchments however, that only Cd exceeded the background level (world av- erage), the concentrations of other metals were below which explains the moderate level of PLI observed in the catchments. Even though the PLI was moderately high (<1.0), the contribution of sediment pollutant load as a result of bounded metals and free particulates from in- puts into the river system explains the observed PLI lev- els.
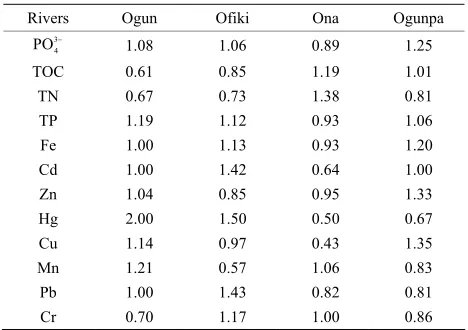
The degree of accumulation of the pollutants was es- timated using the Accumulation Factor (AF). Table 4
shows the AF of the rivers which gives the level of ac- cumulation of the metals and nutrient in river bed sedi- ment. The observed AF for the nutrient elements and heavy metals were high in the major rivers. Although, -P and TP in Ona river, TOC in Ogun and Ofiki as well as TN in Ofiki river are less than 1.0, all the nutrient variables have AF higher than 0.60. Thus, pollution in the sediment of Ogun and Ona basin increases by a factor of between 0.61 and 1.29.
3 4
PO
In terms of the heavy metals in Ona river, Cd, Fe, Zn, Hg, Pb and Cu had AF of less than 1.00. Also, Hg, Mn and Cr in Ogunpa river, Mn, Cu and Zn in Ofiki river,
[image:7.595.58.287.97.191.2]Figure 6. PLI and TOC relationship in the basin.
Table 4. Accumulation factor of dissolved nutrients and hea- vy metals in the river bed sediment.
Rivers Ogun Ofiki Ona Ogunpa
3 4
PO
1.08 1.06 0.89 1.25 TOC 0.61 0.85 1.19 1.01 TN 0.67 0.73 1.38 0.81 TP 1.19 1.12 0.93 1.06 Fe 1.00 1.13 0.93 1.20 Cd 1.00 1.42 0.64 1.00 Zn 1.04 0.85 0.95 1.33 Hg 2.00 1.50 0.50 0.67 Cu 1.14 0.97 0.43 1.35 Mn 1.21 0.57 1.06 0.83 Pb 1.00 1.43 0.82 0.81 Cr 0.70 1.17 1.00 0.86
and Cr in Ogun river all have AF of less than 1.0. The highest AF (2.00) was recorded with Hg in Ogun river. Therefore, heavy metals accumulated in river bed sedi- ment in Ogun and Ona basin by a factor of between 0.43 - 2.00. This implies increasing levels of these metals progressively towards the downstream of the river sys- tems. Thus, even though specific metals like Fe, Zn, Cu and Pb may not have exceeded the background levels for tropical rivers, the PLI and AF showed that the accumu- lation rates of these metals are not sustainable in the river systems.
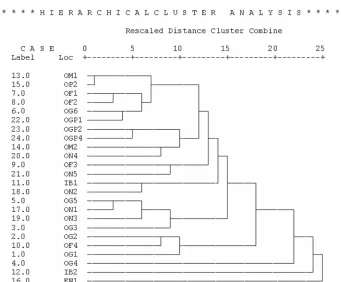
3.4. Clustering of Locations Based on Sediment Quality
Sampling locations across the basins was classified with HCA into 7 groups based on the pattern and closeness of the observed nutrient, heavy metals and organic carbon in the river bed sediments. The groupings are presented in Figure 7.
[image:7.595.306.540.230.395.2]Figure 7. The dendogram of hierarchical cluster analysis based on sediment characteristics across the basin.
Group 5: OG5, ON1, ON3 and OG3 is a heterogene- ous group comprising ON1 and ON3 which are locations on Ona river within the city of Ibadan, ON3 is within an Industrial area while OG5 is within the urban area of Abeokuta on Ogun river. OG3 is in an agricultural/grass woodland with dispersed settlements of farming commu- nity in Idi Ata, Dagilegbo, Eleyele villages among others within its catchment. The classification of river bed sedi- ments of these areas shows the closeness of the charac- teristics of inputs from urban centres and agricultural land in terms of impacts and potential to initiate river pollution.
pattern in the distribution of river bed sediment charac- teristics as influenced by the anthropogenic activities [34]. The inclusion of OGP1 which is the first sampling location on Ogunpa river (draining urban land-use) into this group is not accidental. This is because the location is in the sub-urban area where farmers use the available wetland for agricultural activities.
Group 2: OGP2, OGP4, OM2 and ON4 consists of locations within the city of Ibadan (urban land-use) the locations are clustered as a result of the relationship in terms of pattern of observed levels of heavy metals, TOC and nutrient loading which have been seen to be highly influenced by the runoff from the urban area. This classi- fication further confirms the impact of land-use type on the hydrological system.
Group 6: OG2, OF4 and OG1 are very similar because they are within agricultural land-use interspersed with grass woodland and forest. In terms of released of soil minerals, nutrient as well as heavy metal characteristics, these locations were similar. The similarity across these locations further strengthen the impacts of land-use on the hydrochemistry of rivers within the basin beyond the point sources which are often given attention in the tradi- tional monitoring, assessment and management of pollu- tion.
Group 3: OF3 and ON5 are locations near forest areas. OF3 is in Iganna, a local community within government forest reserved area and ON5 is downstream of a govern- ment forest reserved plantation. This explains the sediment quality in the river systems within these areas.
Group 4: IB1 and ON2 are in the urban area of Ijebu Ajura and Ibadan metropolis respectively. One distingui- shing characteristic of these locations was the predomi- nance of wetland which influences the influx of pollutants into the river system. The levels of heavy metals, TOC and nutrient in this group may have been influenced by the wetland nature of the land area hence the clustering of the location as a class.
ble crops using water from these rivers and other tribu- taries are being encouraged within the peri-urban envi- ronment. Agricultural activities have multiplied the pol- lution loading of the urban runoff in the sediments hence the classification of these locations as a group by HCA.
4. Conclusion
The levels of the investigated heavy metals and dissolved nutrients in the river bed sediment across the Ogun-Osun River Basin in Nigeria revealed a moderately high pollu- tion load and high accumulation rate. Currently, the level of metals except for Cd may not have exceeded the back- ground values, but with high observed accumulation char- acteristic, increasing sediment contamination is expected and may lead to secondary pollution in the river system in the near future. Also, land-use type influenced sedi- ment qualities significantly across the catchments. There- fore, agricultural, urban, sub-urban and grazing lands were the major land-use contributing to the pollutant charac- teristics of the sediments and thus the high potential for possible secondary pollution.
REFERENCES
[1] F. S. Chapin III, S. Naeem, S. W. Pacala, J. Roy, W. L. Steffen, D. Tilman, O. E. Sala, I. C. Burke, J. P. Grime, D. U. Hooper, W. K. Lauenroth, A. Lombard, H. A. Mooney and A. R. Mosier, “Ecosystem Consequences of Chang- ing Biodiversity,” BioScience, Vol. 48, No. 1, 1998, pp. 45-52. http://dx.doi.org/10.2307/1313227
[2] B. Kiersch, “Land Use Impacts on Water Resources: A Literature Review,” In: B. Kiersch and J. Faures, Eds., Land-WaterLinkagesinRuralWatershed, Proceedings of the Electronic Workshop Organized by FAO Land and Water Development Division, FAO, Rome, 2000, pp. 35- 42.
[3] B. W. Bartl and O. Horak, “Long-Term Application of Bio Waste Compost versus Mineral Fertilization: Effects on the Nutrient and Heavy Metal Contents of Soil and Plants,” JournalofPlantNutrition&SoilScience, Vol. 165, No. 2, 2002, pp. 165-171.
http://dx.doi.org/10.1002/1522-2624(200204)165:2<161:: AID-JPLN161>3.0.CO;2-P
[4] S. Moussa, W. Qi-Tang, M. Ce-Hui and M. Jean-Louis, “Plant Grown on Sewage Sludge in South China and Its Relevance to Sludge Stabilization and Metal Removal,” JournalofEnvironmentalScience, Vol. 15, No. 5, 2003, pp. 622-627.
[5] K. D. Awasthi, B. K. Sitaula, B. R. Singh and R. M. Baja- charava, “Land Use Change in Two Nepalese Watersheds,” Land Degradation and Development, Vol. 13, No. 6, 2002, pp. 495-513. http://dx.doi.org/10.1002/ldr.538 [6] I. R. Calder, “Water Resources and Land Use Issues,”
SWIM Paper 3, IWMI, Colombo, 1998.
[7] E. D. Ongley, “Control of Water Pollution from Agricul-
ture,” FAO Irrigation and Drainage Paper, Rome, 1996. [8] H. Xiang, S. Mika, B. Duo and T. G. Egil, “Water Quality
in the Tibetian Plateau: Metal Contents,” Environmental Pollution, Vol. 156, No. 2, 2008, pp. 270-277.
http://dx.doi.org/10.1016/j.envpol.2008.02.014
[9] M. S. Sanja, S. D. Dragana, D. M. Dragan and S. P. Polic, “Assessment of Heavy Metal Pollutants Accumulation in the Tisza River Sediments,” JournalofEnvironmentalMa- nagement, Vol. 90, No. 11, 2009, pp. 3382-3390. http://dx.doi.org/10.1016/j.jenvman.2009.05.013
[10] P. Lilsa and S. Micheal, “Fluxes of As, Cu, Hg, Pb in Lake Sediment in the Coppermine River Basin Canada,” Nor- dicHydrology, Vol. 38, No. 2, 2007, pp. 177-185. http://dx.doi.org/10.2166/nh.2007.006
[11] G. B. Bird, P. A. Macklin, M. G. Balteanu, D. Driga, B. Serban and M. S. Zaharia, “The Solid State Partitioning of Contaminant Metals and As in River Channel Sedi- ments of the Mining Affected Tisa Drainage Basin, North- western Romania and Eastern Hungary,” Applied Geo- chemistry, Vol. 18, No. 10, 2003, pp. 1583-1595. http://dx.doi.org/10.1016/S0883-2927(03)00078-7 [12] H. M. V. M. Soares, R. A. R. Boaventura, A. A. S. C. Ma-
chado and J. C. G. Esteves da Silva, “Sediments as Mo- nitors of Heavy Metal Contamination in the Ave River Basin Portugal: Multivariate Analysis of Data,” Environ- mentalPollution, Vol. 105, No. 3, 1999, pp. 311-323. http://dx.doi.org/10.1016/S0269-7491(99)00048-2 [13] K. S. Are, A. O. Oke, O. Babalola, G. A. Oluwatosin, A. O.
Adelana, A. O. Ojo and O. D. Adeyolanu, “Conservation Strategies for Effective Management of Eroded Landform: Soil Structural Quality, Nutrient Enrichment Ratio and Runoff Water Quality,” Soil Science, Vol. 176, No. 5, 2010, pp. 252-263.
http://dx.doi.org/10.1097/SS.0b013e3182172b1b
[14] Ogun Osun River Basin Authority, “OORBDA Publica- tion,” 1996.
[15] A. Walkley and I. A. Black, “An Estimation of the Diges- tion Method for Determining Soil Organic Matter and a Proposed Modification of the Chromic Acid Titration Me- thod,” SoilScience, Vol. 37, No. 1, 1934, pp. 29-38. http://dx.doi.org/10.1097/00010694-193401000-00003 [16] J. M. Bremner and C. S. Mulvaney, “Nitrogen Total,” In:
A. L. Page, R. H. Miller and D. R. Keeny, Eds., Methods ofSoilAnalysis. II. ChemicalandMicrobiologicalProp- erties, Agronomy Monograph 9, 2nd Edition, Soil Science Society of America, Madison, 1982, pp. 595-624. [17] J. Murphy and J. P. Riley, “A Modified Single Solution
Method for Determination of Phosphorus in Natural Wa- ter,” AnalyticaChimicaActa, Vol. 27, No. 1, 1962, pp. 31-36. http://dx.doi.org/10.1016/S0003-2670(00)88444-5 [18] H. Agemian and A. S. Y. Chau, “Evaluation of Extraction
Techniques for the Determination of Metals in Aquatic Se-diments,” Analyst, Vol. 101, No. 1207, 1976, pp. 761- 767. http://dx.doi.org/10.1039/an9760100761
(Cordoba-Argentina),” WaterResearch, Vol. 35, No. 12, 2001, pp. 2881-2894.
http://dx.doi.org/10.1016/S0043-1354(00)00592-3 [20] K. P. Singh, A. Malik, D. Mohan and S. Sinha, “Multiva-
riate Statistical Techniques for the Evaluation of Spatial and Temporal Variations in Water Quality of Gomti River (India)—A Case Study,” WaterResearch, Vol. 38, No. 18, 2004, pp. 3980-3992.
http://dx.doi.org/10.1016/j.watres.2004.06.011
[21] B. S. Shyamalendu, M. Abhijit, S. B. Bhattacharyya and C. Amalesh, “Status of Sediment with Special References to Heavy Metal Pollution of a Brackishwater Tidal Eco- system in Northern Sundarbans of West Bengal,” Tropi- calEcology, Vol. 42, No. 1, 2001, pp. 127-132.
[22] O. A. Aina, A. B. Taofeek and V. C. Azubike, “Spatial and Temporal Variations in Water and Sediment Quality of Ona River, Ibadan, Southwest Nigeria,” EuropeanJour- nalofScientificResearch, Vol. 74, No. 2, 2012, pp. 186- 204.
[23] J. O. Agbenin, M. Danko and G. Welp, “Soil and Vegeta- ble Compositional Relationships of Eight Potentially To- xic Metals in Urban Garden Fields from Northern Nige- ria,” JournalofScience, Foodand Agriculture, Vol. 89, No. 1, 2007, pp. 49-54.
http://dx.doi.org/10.1002/jsfa.3409
[24] P. A. Sanchez, K. D. Shepherd, M. J. Soule, F. M. Place, R. J. Buresh and A. N. Izac, “Soil Fertility Replenishment in Africa: An Investment in Natural Resource Capital,” In: R. J. Buresh, P. A. Sanchez and F. Calhoun, Eds., Procee- dingsofanInternationalSymposiumCosponsoredbyDi- visionsA-6 (InternationalAgronomy) andS-4 (SoilFerti- lityandPlantNutrition), andtheInternationalCenterfor ResearchinAgroforestry, Indianapolis.
[25] C. Deborah, “Water Quality Assessments—A Guide to Use of Biota, Sediments and Water in Environmental Mo- nitoring,” UNESCO/WHO/UNEP, 1996, pp. 23-28. [26] M. O. Jaji, O. Bamigbose, O. O. Odukoya and T. A. Aro-
wolo, “Water Quality Assessment of Ogun River, South Western Nigeria,” EnvironmentalMonitoringandAssess- ment, Vol. 133, No. 1-3, 2007, pp. 473-482.
http://dx.doi.org/10.1007/s10661-006-9602-1
[27] S. Surindra, K. N. Arvind, C. Mayiri and K. G. Sanjay, “Assessment of Metals in Water and Sediment of Hindon River, India: Impact of Industrial and Urban Discharges,” JournalofHarzadousMaterial, Vol. 171, No. 1-3, 2009, pp. 1360-1368.
[28] G. O. Kolawole and G. Tian, “Phosphorus Fraction and Crop Performance on an Alfisol Amended with Phosphate Rock Combined with or without Plant Residue,” African JournalofBiotechnology, Vol. 6, No. 16, 2004, pp. 1972- 1978.
[29] K. Vuori, “Direct and Indirect Effects of Iron on River Ecosystem,” Annals ofZoology Fennici, Vol. 32, 1995, pp. 317-329.
[30] W. Davison and R. De Vitre, “Iron Particles in Freshwa- ter,” In: J. Buffle and H. P. Van Leeuwen, Eds., Environ- mentalParticles Vol. 1, EnvironmentalAnalyticalandPhy- sicalChemistrySeries, 1992, pp. 315-355.
[31] D. Martincic, Z. Kwokal and M. Branica, “Distribution of Zinc, Lead, Cadmium and Copper between Different Size Fractions of Sediments I. The Limski Kanal (North Adri- atic Sea),” Science ofthe Total Environment, Vol. 95, 1990, pp. 201-215.
http://dx.doi.org/10.1016/0048-9697(90)90065-3
[32] F. W. Ruth and A. M. Mathew, “Environmental Enginee- ring,” 4th Edition, Butterworth and Heineman, Elsevier Science, 2003.
[33] P. M. Nyenje, J. W. Foppen, S. Uhlenbrook, R. Kulabako and A. Muwanga, “Eutrophication and Nutrient Release in Urban Areas of Sub-Saharan Africa-A Review,” Sci- ence ofTotal Environment, Vol. 408, No. 3, 2010, pp. 447-455.
http://dx.doi.org/10.1016/j.scitotenv.2009.10.020