The fatality index of public transport (express bus) in Malaysia
Full text
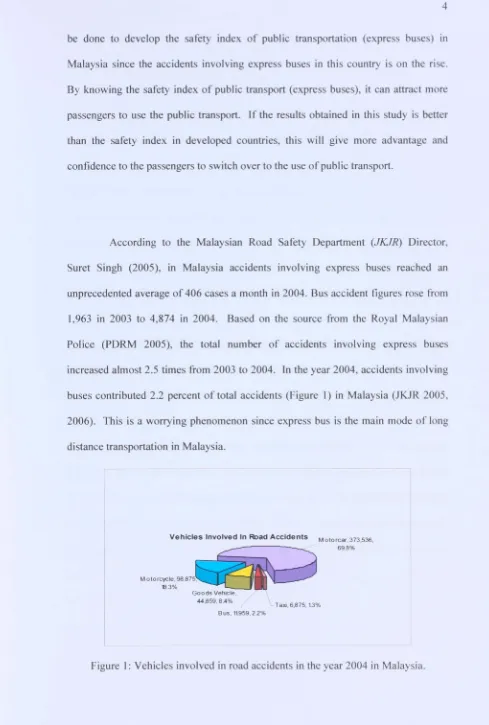
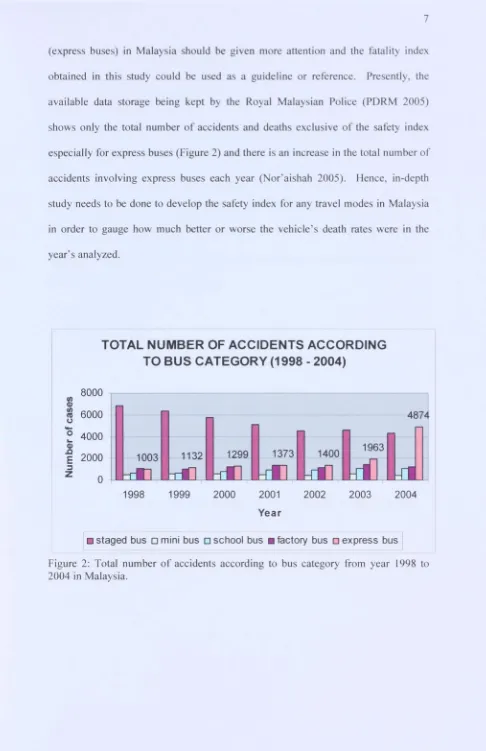
Figure
Related documents
"Setting up the Wyse Winterm requires nothing more than opening the box, setting it down, plugging it in, and walking away." The management software, Wyse Device
Residents with flood expe- rience prior to flash flood events (as compared to those without) have been found to have a higher awareness of flooding and a higher perception of
After you install your new D-Link adapter, by default, the TCP/IP settings should be set to obtain an IP address from a DHCP server (i.e. wireless router) automatically. To verify
Aquaponics without the balance between fish feed and plants decreased the nitrogen recovery efficiency and contributed high nitrogen loss via denitrification (under an
These questions extend the current research as to how racial and gender diversity impacts governance, and allow this researcher to fill gaps in the existing literature by
Taken together, in the above synthesis methods of etravirine, problems like the following still exist: (1) The starting materials are difficult to obtain (exemplified by compound
Second, we directly decompose the variation in country yields as opposed to country factors, determining for any given country yield the fraction of its variance due to variation
