Impact of Capital Structure on Firm’s Financial Performance:
Evidence from United Kingdom
Ngoc Bao Vuong∗ Trang Thi Quynh Vu† Payel Mitra‡
Abstract: The purpose of this paper is to examine empirically the impact of capital structure on financial performance of United Kingdom (UK) firms’ during the period from 2006 to 2015. The investigation is performed using data of 739 UK very large and large listed companies on London Stock Exchange. The study uses four performance measures, including return on equity -ROE, return on assets - ROA, Tobin’s Q and earnings per share - EPS as dependent variables. The two capital structure ratios, namely long-term liabilities and short-term liabilities as well as growth rate of total assets are applied as independent variables. Size is a control variable. The results indicate that firms’ financial performance, which is measured by ROA, ROE and Tobin’s Q have negative relationship with long-term liabilities in most of studied sectors, whereas short-term debts has no significant impact on these ratios. The performance which is measured by EPS also has no relationship with firm’s leverage. These findings are consistent for ROA, ROE and EPS when we consider all firms, not distinguish their line of business. The only change belongs to Tobin’s Q when we observe a positive relationship. Beside that, size and growth factor also bring benefit for firms’ performance, except Tobin’s Q. Finally, the global financial crisis seem does not effect much on the relationship between leverage and profitability indicators.
Keywords: Capital structure, firm’s performance, leverage, debts, performance measures.
Introduction
The mixture between debt and equity exploited in firms’ operational activities is acceptably de-fined as its capital structure. In which, debt, including both short-term and long-term, derives from issuing bonds or long-term notes and required working capital while stocks and retained earn-ings account for equity. In general, investigating capital structure of a corporation often means examining the ratio between its short- and long-term debt. Typically, a firm whose debt dominates in financed sources has a more hostile capital structure, leading to higher risks to investors and firm itself, such as lower interest or even bankrupt in the worst case. Such risks, however, may also be a key motivation for firm’s growth. Therefore, choosing a proper debt-equity ratio is one of the most important decisions of a company. Nevertheless, although there are many theories have been introduced in explaining capital structure of companies, and lots of researchers suggest that firm should optimize its capital structure but there is no consensus on how to achieve an optimal debt to equity ratio. We only normally known that capital structure is proved to has strong con-nection to financial performance (Zeitun & Gang Tian,2007) and the optimal capital structure
∗Faculty of Finance, Banking and Business Administration, Quy Nhon University, Vietnam
E-mail: [email protected]
†Bank for Investment and Development of Vietnam - Hanoi Branch, Ha Noi, Vietnam
exists when the mixture between firm’s debt and equity can minimize costs of capital and enhance its profitability. The impact of corporation’s capital structure on its financial achievement is still argued because some studies report positive relationship, such asGhosh and Jain(2000);Hadlock and James(2002) while others impose a negative effect of debt on financial achievement, include (Fama & French,1998;Simerly & Li,2000).
The lack of an exact formula for evaluating the optimal debt-equity ratio and the divergent conclusions in the influence of liabilities on firm’s profitability inspire us to carry out the study about the connection between capital structure and firm’s financial achievement, focus on United Kingdom (UK) only. We choose companies from UK as our sample because its wider economy ranks the fifth in the world and the second in Europe, so, UK has a strong influence on global economy. Our research aims to evaluate the link between debt/liabilities level and financial per-formance of 739 very large and large listed firms from 10 main industrial sectors on London Stock Exchange from 2006 to 2015. The explanatory variables are chosen based on financial theories, previous studies and the available of data, include short-term debts on assets, long-term debts on assets and growth rate while return on equity (ROE), return on assets (ROA), earnings per share (EPS) and Tobin’s Q are chosen as performance indicators. Apart from that, during our research period, the financial crisis beginning on autumn 2007 had a major impact on global financial mar-ket, decreasing significantly the issue of companies’ securities and lending activities of financial institutions, resulting in the disruption of financial markets, the depletion in available funds to businesses and the appearance of severe recessions in the US and European countries. Conse-quently, the examination of this paper will also disclose some aspects concerning the affliction of the 2008 financial crisis on capital structure and UK firms’ performance.
The paper is structured as follow. In session 2, we discuss some empirical evidences regarding capital structure, methodology and data are described in session 3. Session 4 will present research results. Finally, the last session will indicate some conclusions that can be derived from the findings.
Literature Review
Generally speaking, all empirical studies about the association between capital structure and firm performance are able to be categorized into two groups. In view of first group, leverage is a dependent variable and some indicators of firm performance are considered as its explanation. The latter seeks determining factors of corporation achievement, and leverage is included in explanatory variables. Our study will belong to the second group, considering leverage as the impact factor for maximizing firm value. Researchers commonly agree that leverage has more or less influence on firm performance. Akintoye(2008) who uses three performance measures, namely EPS, earnings before interest and taxes - EBIT, and dividend per share to examine such relationship reveals that firm performance remarkably responds to changes in capital structure. However, the sign of this relationship is still mixed. Jensen and Meckling(1976) estimates that the enhancement in financial performance of a company may result from using more debt since managers of such firm rarely opt for projects showing negative net present value. Nevertheless,Titman and Wessels(1988) report a negative correlation between capital structure and firm profitability in US corporations. They argue that small firms, because of low risk tolerance for leverage, often retain a distant connection to financial institutions, resulting in higher interest rates, compared to the large ones.
and ownership structure between manufacturing corporations in Japan and the US and finds a badly influence of capital structure on profitability. Similar results are reported by Friend and Lang(1988) for the US companies, Rajan and Zingales(1995) in the G7 members,Wald (1999) in the emerging countries and in China. Chakraborty(2010) employs two leverage indicators, including total liabilities over assets and liabilities over equity to detect the impact of debt on firm performance represented by EBIT over total assets and cash flows over total assets. He confirms a negative association between these variables. Omondi and Muturi(2013) also present that leverage has a significantly negative effect on ROA of Kenyan firms. More recently, the paper ofNguyen and Nguyen(2015) which focuses on Vietnamese firms points out the negative influence of capital structure by using return on assets, return on equity and Tobin’s Q as indicators for financial performance. Abeywardhana and Krishanthi (2016) analyse the connection between capital structure and firm performance of SMEs in UK, concentrating on manufacturing sector over the period from 1998 to 2008 and indicate that ROA and ROCE of these firms are afflicted negatively by leverage.
Conversely, there are some articles reporting the positive correlation between debt and financial performance. For example,Hadlock and James(2002) suggest the same pattern in changes in debt and profitability, in which companies with high profitability also might have large proportion of debt in total capital funds. Similarly,Gill, Biger, and Mathur(2011) investigate US manufacturing corporations and show that current liabilities, long-term liabilities, and total ones have positive influence on profitability (return on equity).
However, the impact of current and long-term liabilities or the relationship between leverage and each profitable measurement is not often identical. Abor(2005) indicates that short-term and total debt affect positively on ROE while long-term debt and ROE present a negative relationship by investigating 22 listed firms on Ghana Stock Exchange over a five-year period between 1998 and 2002. These results are opposing toVuatavu(2015) who reports that short-term and total debt afflict negatively on ROA and ROE while the influence of long-term debt fluctuates. The paper ofSaeedi and Mahmoodi(2011) which focus on Tehran Stock Exchange’s listed companies in the period of 8 years (2002-2009) reports that earnings per share and Tobin’s Q have remarkable and positive connection with capital structure while there is a negative impact between leverage and ROA. More especially, they do not find the correlation between ROE and capital structure. A part of such results is in line withEl-Sayed Ebaid (2009) who reveals that capital structure choices, broadly, just afflict weakly, even no effect in some cases on firm’s performance based on his study about this relationship in Egyptian companies from 1997 to 2005, using three accounting ratios, namely return on assets, return on equity and gross profit margin.
re-lationship is consistent between firms in different industrial sectors as well as the impact of 2008 financial crisis on it.
Research Method
Data
Our sample consists of 7390 observations which are originated from 739 UK’s firms among very large and large listed firms on London Stock Exchange over the period between 2006 and 2015. These firms are picked up from ten main industrial sectors in UK economy. The data of the studied companies are obtained by consulting Amadeus Dataset (Analyses Major Database from European Sources).
Table 1
Number of firms by Industry sectors
NACE Rev. 2 Industry sector Number of %
main section firms
B Mining & Quarrying (MQ) 95 12.9
C Manufacturing (MNF) 180 24.4
F Construction (CST) 71 9.61
G
Wholesale & Retail Trade; Repair of Motor Vehicles & Motorcycles (WR) 69 9.34
H Transportation & Storage (TS) 30 4.06
I Accommodation & Food Service Activities (AF) 31 4.19
J Information & Communication (IC) 115 15.6
L Real Estate activities (RE) 33 4.47
M Professional, Scientific & Technical activities (PST) 62 8.39 N Administrative & Support Service activities (AS) 53 7.16
Total 739 100%
This table shows the number of UK companies used to investigate the influence of capital structure on firms’ performance. There are 739 listed UK’s firms in 10 sectors during the period 2006-2015. Companies are sorted in sectors using the NACE, Rev. 2 main section classification in Amadeus Dataset
Empirical Models
According to previous researches, financial performance of firm is often represented by return on assets (ROA), return on equity (ROE), Tobin’s Q and earnings per share (EPS) (Akintoye, 2008;Salim & Yadav,2012;Akintoye,2008). All these indicators are being termed as dependent variables. While ROA, ROE, and EPS are accounting based measurement calculated from firms’ financial statements, Tobin’s Q is a measurement mixed between market values and accounting values. In details, ROA, ROE, EPS and Tobin’s Q are calculated like this:
ROA= Net Income/Total Asset
ROE= Net Income/Total Equity
EPS= Net Income/Share Outstanding
The independent variables in this analysis are ratio of short-term liabilities over total assets, ratio of long-term liabilities divided by total assets, and growth rate is calculated as percentage change of total assets.
Beside that, Ramaswamy (2001) and Frank and Goyal (2003) suggest that the firm’s size may influence its performance because large firms might have more capacity and capabilities than smaller ones. Therefore, the paper controls the differences in firm’s operating environment by including the size variable in the model. Size is measured by the natural logarithm of total assets of the firm and included in the model to control the effect of firm’s size on dependent variables. Based on aforementioned variables, the relationship between firm’s leverage and its financial performance is tested by the following regression models:
ROAI,t=β0+β1ST LI,t+β2LT LI,t+β3SizeI,t+β4GrowthI,t+I,t
ROEI,t=β0+β1ST LI,t+β2LT LI,t+β3SizeI,t+β4GrowthI,t+I,t
T obin0sQI,t=β0+β1ST LI,t+β2LT LI,t+β3SizeI,t+β4GrowthI,t+I,t
EP SI,t=β0+β1ST LI,t+β2LT LI,t+β3SizeI,t+β4GrowthI,t+I,t
In which:
ST LI,t: Short term liabilities to total assets for firm I in year t
LT LI,t: Long term liabilities to total assets for firm I in year t
SizeI,t: Logarithm of total assets for firm I in year t
GrowthI,t: Change in total assets for firm I in year t
I,t: The error terms
Empirical Results
Descriptive Analysis
Table 2
Summary statistics for regression variables
ROA ROE Tobin’s Q EPS STL LTL Growth Size Mean 0.330 -1.000 1.390 0.710 0.480 0.360 0.440 11.91
Median 3.920 8.540 0.830 0.130 0.340 0.220 0.050 11.71
Standard deviation 18.22 82.31 2.560 5.460 2.410 0.500 7.310 2.380
Skewness -2.160 -3.210 11.95 19.22 11.18 6.440 20.55 0.210
Excess kurtosis 8.400 54.56 222.8 440.2 255.9 98.69 504.9 0.012 This table presents the correlation among variables used to investigate the influence of capital structure on UK firms’ performance, the data is annual during the period from 2006 to 2015. This table presents some summary statistics on the variables used to investigate the influence of capital structure on 739 UK firms’ performance,the data is annual during the period from 2006 to 2015.
Having a look on Table 2, among four dependent variables that measure the firms’ performance, ROE has the lowest mean and is negative (-1%) whereas Tobin’s Q has the highest one (1.39) which means that UK’s companies are overvalued. In contrast to mean, ROE has the highest volatility which equal to 82.31% while the volatility of Tobin’s Q is the smallest (2.56%). ROA and ROE all have the negative skewness which are -2.16 and -3.21, respectively. By contrast, Tobin’s Q and EPS skew positively. Tobin’s Q and EPS also have much larger excess kurtosis than ROA and ROE.
Regarding to four independent variables (short-term liabilities, long-term liabilities, growth and size), STL and LTL have not much difference in mean (48% and 36%, respectively) and so do median. However, the standard deviations of these two variables is quite different, 2.41% and 0.5%, respectively and all these four variables have right skewness. Growth has the highest and size has the lowest excess kurtosis not only among four independent variables but also in all variables in this research
Table 3
Correlation matrix
ROE ROA Tobin’s Q EPS STL LTL Size Growth
ROE 1
ROA 0.364 1
Tobin’s Q -0.096 -0.043 1
EPS 0.016 0.003 -0.014 1
STL 0.026 -0.027 0.035 -0.027 1 LTL 0.104 0.066 -0.093 0.056 -0.002 1 Size 0.265 0.311 -0.141 0.121 -0.099 0.396 1
Growth 0.007 -0.006 0.021 -0.012 -0.047 0.039 -0.048 1 This table presents the correlation among variables used to investigate
the influence of capital structure on UK firms’ performance, the data is annual during the period from 2006 to 2015.
correlation between any of the dependent and independent variables. Thus, it can be said that the multicollinearity problem does not exist in our models.
Results
Table 4
The impact of capital structure on UK firms’ financial performance during the period 2006-2015
ROE ROA EPS Tobin’s Q
STL Coefficient 0.129 0.029 0.002 0.144
T-statistics 1.189 1.185 0.254 38.49
P-value 0.234 0.236 0.799 0.000***
LTL Coefficient -5.794 -3.741 0.063 0.126 T-statistics -2.536 -8.352 0.414 1.802 P-value 0.011** 0.000*** 0.679 0.071* Growth Coefficient -0.002 0.009 -0.001 -0.002 T-statistics -0.070 0.757 -0.106 -1.083
P-value 0.944 0.449 0.916 0.279
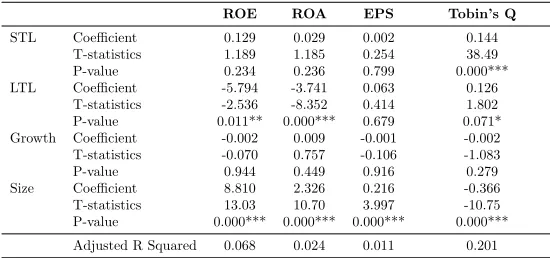
Size Coefficient 8.810 2.326 0.216 -0.366 T-statistics 13.03 10.70 3.997 -10.75 P-value 0.000*** 0.000*** 0.000*** 0.000*** Adjusted R Squared 0.068 0.024 0.011 0.201 The table depicts the relationship between capital structure and financial performance of UK firms which is represented by ROE, ROA, Tobin’s Q and EPS during the period from 2006 to 2015. The choice between pooled OLS, fixed effects and random effects model is conducted by using F-test, Breusch-Pagan test, and Hausman test. *, **, *** indicates statistically significant at 10%, 5% and 1%, respectively.
Table 5
Financial performance measured by ROA in ten sectors
MQ MNF CST WR TS AF IC RE PST AS STL Coefficients 0.046 -3.071 1.135 0.365 -1.415 1.289 -0.022 1.991 -0.769 -15.42
P-value 0.955 0.053* 0.206 0.813 0.296 0.634 0.347 0.622 0.500 0.000***
LTL Coefficients -2.408 -6.963 -7.658 -2.637 -3.280 -1.800 -0.548 -2.951 -4.285 -1.485
P-value 0.137 0.000*** 0.000*** 0.063* 0.0130** 0.344 0.697 0.084* 0.000*** 0.703
Size Coefficients 3.193 2.326 4.457 0.306 1.088 -0.642 0.453 3.956 1.065 -0.122
P-value 0.587 0.000*** 0.000*** 0.340 0.031** 0.300 0.219 0.000*** 0.000*** 0.941
Growth Coefficients -0.076 5.324 0.177 0.611 3.358 2.855 -0.003 2.128 0.898 6.130
P-value 0.000*** 0.000*** 0.040** 0.055* 0.000*** 0.247 0.801 0.133 0.130 0.000***
Adj R Sq 0.191 0.160 0.092 0.016 0.073 0.059 0.012 0.053 0.078 0.079
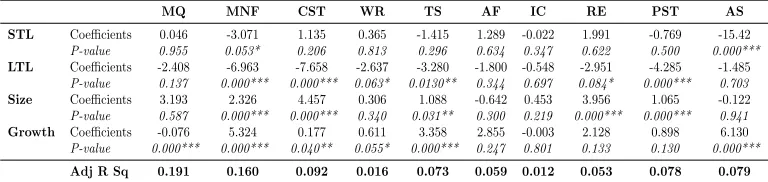
The table shows the influence of capital structure on ROA of UK firms in 10 sectors: Mining & Quarrying (MQ), Manufacturing (MNF), Construction (CST), Wholesale & Retail Trade; Repair of Motor Vehicles & Motorcycles (WR), Transportation & Storage (TS), Accommodation & Food Service activities (AF), Information & Communication (IC), Real Estate activities (RE), Professional, Scientific & Technical activities (PST), Administrative & Support Service activities (AS) during the period from 2006 to 2015. The choice between pooled OLS, fixed effects and random effects model is conducted by using F-test, Breusch-Pagan test, and Hausman test. *, **, *** indicates statistically significant at 10%, 5% and 1%, respectively.
As can be observed from regression results in Table 5, if measuring performance of all firms in ten sectors by ROA, there is a negative relationship between return on assets and long-term debts. Long-term debts have strongest impact on Construction sector with significant coefficient of -7.658 at 99% confidence level, followed by Manufacturing, and Professional, Scientific & Technical activities. It means that firms in all ten main sectors will have lower ROA if requiring more long-term debts. The result is in tandem with Table 3. Different from long-long-term debts, short-long-term debts have both negative and positive impact on ROA of companies in these sectors. It has negative relationship with firms’ performance in Manufacturing, Transportation & Storage, Information & Communication, Professional, Scientific & Technical activities, and Administrative & Support Service activities. Among these industries, the negative impact is highest in Administrative & Support Service activities which 1% rise in short-term liabilities will lead to 15.42% decline in ROA. The positive effect is proved in remained sectors. However, only two negative coefficients are significant implying the similar pattern of short-term and long-term debts on ROA. There are two alternative explanations for the negative sign of leverage on ROA. The first one is pecking order theory which suggest that firms tend to use internal funds rather than debt in financing activities, so more profitable firms should choose less debt. The second explanation is that, the firm is over leveraged by the manager, thus hurting the company’s performance. Additionally, regarding to statistically significant coefficients only, size and growth of firms both have positive impact in most of sectors, except for negative coefficient of growth in Mining & Quarrying sector. These results indicate an improvement in financial performance along with the increase in size and growth rate of firms during the period from 2006 to 2015. A positive sign in size is consistent with research expectations when the bigger firms are expected to achieve better performance. Growth also has a positive effect on firm performance implying that previous asset’s expansion can be served as a quite good predictor of firm performance.
Table 6
Financial performance measured by ROE in ten sectors
MQ MNF CST WR TS AF IC RE PST AS STL Coefficients 1.279 5.984 4.452 -30.34 -0.708 4.576 0.045 -2.276 2.387 -15.48
P-value 0.653 0.436 0.222 0.006*** 0.964 0.756 0.730 0.842 0.636 0.064*
LTL Coefficients -5.482 -5.988 -14.90 17.88 22.81 6.753 13.27 -3.636 -1.58 -1.124
P-value 0.334 0.164 0.015** 0.079* 0.137 0.511 0.096* 0.464 0.733 0.99
Size Coefficients 15.00 3.269 21.10 15.53 9.4 -5.045 4.317 7.217 5.599 4.641
P-value 0.000*** 0.210 0.000*** 0.001*** 0.056* 0.092* 0.029** 0.000*** 0.000*** 0.011**
Growth Coefficients 0.283 15.56 0.942 3.714 4.851 -6.700 -0.003 2.547 1.870 14.96
P-value 0.549 0.000*** 0.007*** 0.085* 0.758 0.622 0.967 0.539 0.478 0.001***
Adj R Squared 0.045 0.017 0.096 0.031 0.072 0.034 0.03 0.062 0.049 0.053
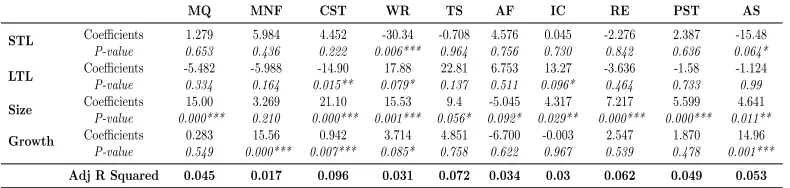
The table shows the influence of capital structure on ROE of UK firms in 10 sectors: Mining & Quarrying (MQ), Manufacturing (MNF), Construction (CST), Wholesale & Retail Trade; Repair of Motor Vehicles & Motorcycles (WR), Transportation & Storage (TS), Accommodation & Food Service activities (AF), Information & Communication (IC), Real Estate activities (RE), Professional, Scientific & Technical activities (PST), Administrative & Support Service activities (AS) during the period from 2006 to 2015. The choice between pooled OLS, fixed effects and random effects model is conducted by using F-test, Breusch-Pagan test, and Hausman test. *, **, *** indicates statistically significant at 10%, 5% and 1%, respectively.
In contrast, the relationships between short-term as well as long-term liabilities and ROE are different among examined sectors. However, only the negative effects between short-term debts and ROE in Wholesale & Retail Trade; Repair of Motor Vehicles & Motorcycles, and Administrative & Support Services activities are significant. This finding is the same to ROA. The remarkable thing in Table 4.5 belongs to long-term liabilities. In Wholesale & Retail Trade; Repair of Motor Vehicles & Motorcycles, and Information & Communication sectors, the growth of 1% in long-term debts will results in the rise of 17.89% and 13.27%, in turn. This positive relationship can be explained by applying the benefit of financial leverage in business activities of companies in two above sectors. The identical results are reported inGill et al.(2011);Samour and Hassan(2016) ’s papers.
Table 7
Financial performance measured by EPS in ten sectors
MQ MNF CST WR TS AF IC RE PST AS STL Coefficients 0.065 -0.013 0.104 -0.040 0.007 -0.346 0.000 0.540 -0.902 -0.091
P-value 0.842 0.894 0.379 0.690 0.953 0.470 0.943 0.458 0.354 0.498
LTL Coefficients 0.215 -0.020 -0.030 0.004 -0.055 -0.181 -0.069 -0.208 0.651 0.433
P-value 0.744 0.730 0.885 0.967 0.623 0.592 0.373 0.602 0.462 0.000***
Size Coefficients 0.139 0.140 0.278 0.101 0.050 0.294 0.031 0.100 0.716 0.051
P-value 0.573 0.000*** 0.000*** 0.000*** 0.476 0.012** 0.183 0.275 0.077* 0.157
Growth Coefficients -0.001 -0.048 -0.004 0.021 0.072 -0.164 -0.001 0.796 0.160 0.061
P-value 0.995 0.283 0.771 0.285 0.447 0.706 0.829 0.089* 0.744 0.272
Adj R Squared 0.019 0.07 0.082 0.106 0.007 0.045 0.002 0.015 0.005 0.080
The table shows the influence of capital structure on EPS of UK firms in 10 sectors: Mining & Quarrying (MQ), Manufacturing (MNF), Construction (CST), Wholesale & Retail Trade; Repair of Motor Vehicles & Motorcycles (WR), Transportation & Storage (TS), Accommodation & Food Service activities (AF), Information & Communication (IC), Real Estate activities (RE), Professional, Scientific & Technical activities (PST), Administrative & Support Service activities (AS) during the period from 2006 to 2015. The choice between pooled OLS, fixed effects and random effects model is conducted by using F-test, Breusch-Pagan test, and Hausman test. *, **, *** indicates statistically significant at 10%, 5% and 1%, respectively.
(0.101).
In regard to core independent variables, firm’s leverage seems has no effect on its earnings per share proved by small and insignificant coefficients in all investigated sectors, except for long-term debts of companies in Administrative & Support Service activities which have a slightly beneficial impact. These results are contradicting to previous studies which find a significant relationship between debts and EPS (Saeedi & Mahmoodi,2011;Salim & Yadav,2012).
Table 8
Financial performance measured by Tobin’s Q in ten sectors
MQ MNF CST WR TS AF IC RE PST AS STL Coefficients -0.496 0.484 1.299 0.008 -0.006 0.293 0.001 -0.226 0.028 0.013
P-value 0.020** 0.001*** 0.000*** 0.956 0.931 0.176 0.978 0.754 0.659 0.952
LTL Coefficients -0.42 -0.483 -0.324 -0.474 -0.305 -0.046 0.328 0.143 -0.082 -0.908
P-value 0.321 0.000*** 0.000*** 0.000*** 0.000*** 0.764 0.392 0.635 0.144 0.000***
Size Coefficients -1.342 0.026 0.032 0.064 0.029 -0.124 0.083 0.393 -0.135 -0.295
P-value 0.000*** 0.568 0.306 0.118 0.352 0.027** 0.391 0.128 0.004*** 0.000***
Growth Coefficients 0.014 0.251 0.005 0.000 0.254 0.980 -0.001 -0.199 0.032 0.108
P-value 0.682 0.000*** 0.149 0.999 0.000*** 0.000*** 0.899 0.430 0.289 0.148
Adj R Squared 0.064 0.041 0.690 0.009 0.184 0.220 0.003 0.010 0.023 0.075
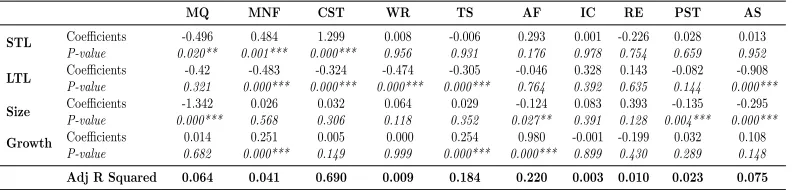
The table shows the influence of capital structure on Tobin’s Q of UK firms in 10 sectors: Mining & Quarrying (MQ), Manufacturing (MNF), Construction (CST), Wholesale & Retail Trade; Repair of Motor Vehicles & Motorcycles (WR), Transportation & Storage (TS), Accommodation & Food Service activities (AF), Information & Communication (IC), Real Estate activities (RE), Professional, Scientific & Technical activities (PST), Administrative & Support Service activities (AS) during the period from 2006 to 2015. The choice between pooled OLS, fixed effects and random effects model is conducted by using F-test, Breusch-Pagan test, and Hausman test. *, **, *** indicates statistically significant at 10%, 5% and 1%, respectively.
Table 8 summarizes the impact of capital structure indicator variables on Tobin’s Q of firms. In contrast to the values in Table 6, this table shows a negative impact of long-term liabilities on Tobin’s Q which implies that the more long-term debts of the firm, the lesser is market value. Interestingly, there is a positive impact on two sectors although p-values are not statistically significant. As opposed to long-term debts, short-term liabilities have mixed impacts depending on corporation’s sector. While there is a negative coefficient for Mining & Quarrying sector (-0.496), its coefficient is positive in Manufacturing and Construction. In remaining sectors, short-term debts and Tobin’s Q has no significant relationship.
Additionally, the relationship between growth rate and Tobin’s Q is the same to other in-dependent variables. However, unlikely to previous studies but in tandem with results in our paper, firm’s size negatively related to Tobin’s Q in some sectors, including Mining & Quarry-ing, Accommodation & Food Service, Professional, Scientific & Technical, and Administrative & Support Service activities. One reasonable explanation is that younger companies normally have more growth potential than more mature firms. The market provides a premium for these smaller growth firms, which translates into higher price-to-book ratios for them.
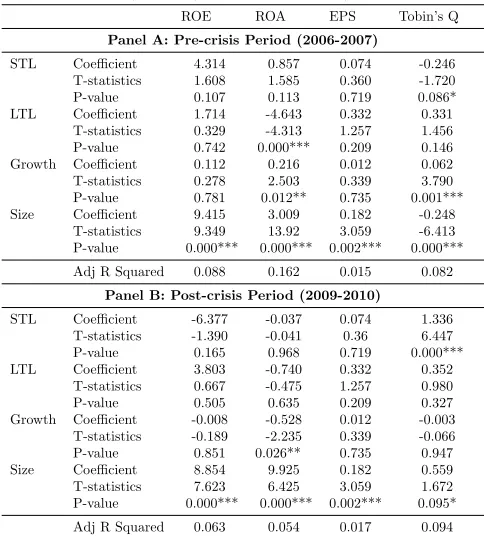
Having a look on Panel A of Table.9, in pre-crisis period between 2006 to 2007, short-term debts have positive impact on both ROA, ROE and EPS but have inverse effect on Tobin’s Q of all firms in our sample. The relationship is not significant in ROA, ROE and EPS but has significance at confidence level of 90% in Tobin’s Q. Quite similarly, long-term debts almost have positive effect on the performance of UK’s firms, except for ROA and it is also the only indicator which has a significant coefficient. Generally, before financial crisis, leverage does not contribute much to the performance improvement of UK firms.
smaller and lower growth rate firms. However, the expansion of firm’s size will reduce Tobin’s Q ratio which likes the finding in Table 3 and 7.
In Panel B, we consolidate some figures to study the impact of the capital structure variables like leverage, size and growth on the firms’ performance during the post-crisis period (2009-2010) in UK. The results present some changes if we compare these finding to the ones in pre-crisis period. For example, in the period before crisis, short-term liabilities have a negative coefficient of -0.246 with Tobin’s Q but it increases to 1.336 during the post-crisis period. Thus, we can have said that the relationships between short-term and long-term liabilities on Tobin’s Q are reverse due to the impact of crisis. It can be explained since interest rate in UK declined dramatically, from the peak of 5.75% in July 2007 to the trough of 0.5% in March 2009 to drag economy out of recession. Likely, the effect of size on Tobin’s Q switches from negative to positive during two sub-period. It is because in post-crisis years, big companies which are more diversified, better-managed and have a larger risk tolerance have a higher possibility to exist and grow than smaller firms.
Table 9
The impact of capital structure on UK firms’ financial performance in pre-crisis period (2006-2007) and post-crisis period (2009-2010)
ROE ROA EPS Tobin’s Q
Panel A: Pre-crisis Period (2006-2007)
STL Coefficient 4.314 0.857 0.074 -0.246 T-statistics 1.608 1.585 0.360 -1.720 P-value 0.107 0.113 0.719 0.086* LTL Coefficient 1.714 -4.643 0.332 0.331
T-statistics 0.329 -4.313 1.257 1.456 P-value 0.742 0.000*** 0.209 0.146 Growth Coefficient 0.112 0.216 0.012 0.062 T-statistics 0.278 2.503 0.339 3.790 P-value 0.781 0.012** 0.735 0.001*** Size Coefficient 9.415 3.009 0.182 -0.248
T-statistics 9.349 13.92 3.059 -6.413 P-value 0.000*** 0.000*** 0.002*** 0.000***
Adj R Squared 0.088 0.162 0.015 0.082
Panel B: Post-crisis Period (2009-2010)
STL Coefficient -6.377 -0.037 0.074 1.336 T-statistics -1.390 -0.041 0.36 6.447 P-value 0.165 0.968 0.719 0.000*** LTL Coefficient 3.803 -0.740 0.332 0.352
T-statistics 0.667 -0.475 1.257 0.980
P-value 0.505 0.635 0.209 0.327
Growth Coefficient -0.008 -0.528 0.012 -0.003 T-statistics -0.189 -2.235 0.339 -0.066 P-value 0.851 0.026** 0.735 0.947 Size Coefficient 8.854 9.925 0.182 0.559 T-statistics 7.623 6.425 3.059 1.672 P-value 0.000*** 0.000*** 0.002*** 0.095*
Conclusion
The paper is conducted mainly to investigate the effect of capital structure on financial perfor-mance of UK firms during the period from 2006 to 2015. Moreover, we also examine whether this relationship is consistent between firms in different industrial sectors as well as the impact of the financial crisis in 2008 on it. Our research is carried out base on the sample of 739 listed companies on London Stock Exchange which are collected from ten major sectors of UK economy. Financial performance represented by ROE, ROA, EPS and Tobin’s Q are assessed in the relationship with firm’s liabilities as well as growth ratio. Control variable is firm’s size.
The empirical results suggest that long-term debts can be harmful for the improvement of firm’s profitability, in terms of ROA and ROE because of their negative relationship. Our finding does not follow MM theory and be consistent with many previous studies. The result might be made clear based on agency conflict, in which firms’ performance is afflicted badly because of using too much debt. However, for Tobin’s Q, both short-term and long-term liabilities affect positively. Firm’s leverage seems have no impact on EPS. In general, due to the values of coefficients, we assume that the impact of leverage on ROA and ROE is much stronger than other performance indicators. Besides that, the increase of total assets also does not bring any benefit to financial performance of UK’s firms. This result is quite different to popular views which suggest that growth rate has a positive relationship with firms’ performance based on the supposition that the company which has good growth opportunities may also be received low-cost funds, resulting in the improvement in using assets. In contrast to growth, corporation’s size strongly and positively effect on ROA, ROE and EPS.
The results for leverage become diverse when we look at its impact on UK companies in different sectors. In some sectors, current and long-term liabilities present the same relationship, positively or negatively. Others affect in opposite directions. Specially, there is a case that debts and firm achievement are not correlated in few sectors. To analyse the influence of financial crisis in 2008, we compare the association between firm’s liabilities and its financial results in two sub-periods: 2006 to 2007 and 2009 to 2010. The outcomes depict some significant changes in the effect of short-term debts and size on Tobin’s Q. The relationship is not the same for other dependent variables but it is not significant statistically.
References
Abeywardhana, Y., & Krishanthi, D. (2016). Impact of capital structure on firm
per-formance: Evidence from Manufacturing Sector SMEs in UK. Retrieved from
https://ssrn.com/abstract=2816499
Abor, J. (2005). The effect of capital structure on profitability: An empirical analysis of listed firms in Ghana. The Journal of Risk Finance,6(5), 438–445.
Akintoye, I. R. (2008). Sensitivity of performance to capital structure: A consideration for selected food and beverages companies in Nigeria. Journal of Social Sciences,7(1), 29–35.
Chadha, S., & Sharma, A. K. (2015). Capital structure and firm performance: Empirical evidence from India. Vision,19(4), 295–302.
Chakraborty, I. (2010). Capital structure in an emerging stock market: The case of India.
Research in International Business and Finance,24(3), 295–314.
El-Sayed Ebaid, I. (2009). The impact of capital-structure choice on firm performance: empirical evidence from Egypt. The Journal of Risk Finance,10(5), 477–487. Fama, E. F., & French, K. R. (1998). Taxes, financing decisions, and firm value. The
Journal of Finance,53(3), 819–843.
Frank, M. Z., & Goyal, V. K. (2003). Testing the pecking order theory of capital structure.
Journal of Financial Economics,67(2), 217–248.
Friend, I., & Lang, L. H. (1988). An empirical test of the impact of managerial self-interest on corporate capital structure. The Journal of Finance,43(2), 271–281.
Ghosh, A., & Jain, P. C. (2000). Financial leverage changes associated with corporate mergers. Journal of Corporate Finance,6(4), 377–402.
Gill, A., Biger, N., & Mathur, N. (2011). The effect of capital structure on profitability:
Evidence from the United States. International Journal of Management, 28(4), 3–
15.
Hadlock, C. J., & James, C. M. (2002). Do banks provide financial slack? the Journal of
Finance,57(3), 1383–1419.
Hossain, A. T., & Nguyen, D. X. (2016). Capital structure, firm performance and the recent financial crisis. Journal of Accounting and Finance,16(1), 76–88.
Jensen, M. C., & Meckling, W. H. (1976). Theory of the firm: Managerial behavior, agency costs and ownership structure. Journal of Financial Economics,3(4), 305–360. Kester, W. C. (1986). Capital and ownership structure: A comparison of United States and
Japanese manufacturing corporations. Financial Management, 5–16. doi: 10.2307/
3665273
Nguyen, T., & Nguyen, H.-C. (2015). Capital structure and firms’ performance: Evidence
from Vietnam’s stock exchange. International Journal of Economics and Finance,
7(12), 1–10.
Omondi, M. M., & Muturi, W. (2013). Factors affecting the financial performance of listed companies at the Nairobi Securities Exchange in Kenya. Research Journal of Finance
and Accounting,4(15), 99–104.
Rajan, R. G., & Zingales, L. (1995). What do we know about capital structure? Some evidence from international data. The Journal of Finance,50(5), 1421–1460. Ramaswamy, K. (2001). Organizational ownership, competitive intensity, and firm
perfor-mance: An empirical study of the Indian manufacturing sector. Strategic
Manage-ment Journal, 22(10), 989–998.
Saeedi, A., & Mahmoodi, I. (2011). Capital structure and firm performance: Evidence
from Iranian companies. International Research Journal of Finance and Economics,
70(11), 20–29.
Salim, M., & Yadav, R. (2012). Capital structure and firm performance: Evidence from Malaysian listed companies. Procedia-Social and Behavioral Sciences, 65, 156–166. doi: 10.1016/j.sbspro.2012.11.105
Samour, S., & Hassan, L. (2016).Capital structure and firm performance: Did the financial crisis matter? a cross-industry study.
Simerly, R. L., & Li, M. (2000). Environmental dynamism, capital structure and
per-formance: A theoretical integration and an empirical test. Strategic Management
Journal,21(1), 31–49.
Titman, S., & Wessels, R. (1988). The determinants of capital structure choice. The
Journal of Finance,43(1), 1–19.
Vuatavu, S. (2015). The impact of capital structure on financial performance in Romanian
listed companies. Procedia Economics and Finance,32, 1314–1322.
Wald, J. K. (1999). How firm characteristics affect capital structure: an international comparison. Journal of Financial Research,22(2), 161–187.
Zeitun, R., & Gang Tian, G. (2007). Does ownership affect a firm’s performance and default
risk in Jordan? Corporate Governance: The International Journal of Business in