Journal of Chemical and Pharmaceutical Research
__________________________________________________
ISSN No: 0975-7384 CODEN(USA): JCPRC5
J. Chem. Pharm. Res., 2011, 3(2):234-244
Studies of zinc (II) in pharmaceutical and biological samples by
spectrophotometer using APMT as chelating reagent
K. Vasudeva Reddy1,2*, D. Nagarjuna Reddy2 and K. Hussain Reddy2
1
Department of Chemistry, Govt. College for Women, Chintamani, Karnataka
2
Department of Chemistry, Sri Krishnadevaraya University, Anantapur, AP
______________________________________________________________________________
ABSTRACT
2-Acetylpyridine-4-methyl-3-thiosemicarbazone (APMT) is proposed as a new sensitive reagent for spectrophotometric determination of zinc (II). APMT reacts with zinc (II) in the pH range 5.5 - 6.5 to form yellow coloured complex. The absorbance value of Zn (II) - APMT complex was measured at different intervals of time at 365 nm, to ascertain the stability of the complex. It was observed that the colour development was instantaneous and stable for more than 48 h. The system obeyed Beer's law upto 1.05 µg mL-1 of zinc(II). The molar absorptive and Sandell's sensitivity of the species is 3.5 X 10⁴ L mol-1 cm-1 and 1.9 X 10⁻³ µg cm-2 at 365 nm. The composition of the zinc (II) complex with APMT was studied by Job's continuous variation and molar ratio method. Various certified reference materials (NIST 1573 and NBS 1572) have been tested for the determination of zinc for evaluating the accuracy of the developed method. The results of the proposed method are in agreement with AAS method.
Keywords: APMT, Zinc (II), pharmaceutical and Biological samples.
______________________________________________________________________________
INTRODUCTION
Zinc is an essential element for all animals including human beings and plays an important physiological role. In human blood, zinc is distributed 75- 85% in erythrocytes (mostly as carbonic anhydrase), 12 to 22% in plasma, and 3% in leukocytes. One third of zinc in plasma is loosely bound to serum albumins, the remainder being more firmly attached to α-globulins, with
minor fractions complexes in histidine and cysteine.1 – 3
deficiency has been linked to a low sperm count and infertility. Zinc deficiency during pregnancy may produce serious defects and foetal loss.4
Although a little zinc is vital to health, too much is harmful, a single 220 mg zinc sulphate capsule can cause nausea and vomiting. Toxic effects, which may also include abdominal pain, fever and severe anemia can result from eating acidic foods or drinking liquids that have been stored in galvanized containers.
It is clear that zinc is an essential element and has significant importance, both biologically and industrially. When the quantity is more than what is required, zinc produces toxic effects. Hence, separation and determination of zinc (II) from its associated metal ions is indispensable.
The review of literature indicates only a few thiosemicarbazones have been exploited for the spectrophotometric determination of zinc (II). Not much attention has been paid for the spectrophotometric determination of zinc (II) with thiosemicarbazones. This has prompted the researcher to make a systematic investigation for utilizing 2-Acetylpyridine-4-methyl -3-thiosemicarbazone (APMT) first time for the spectrophotometric determination of zinc (II) in microgram quantities. Later, the established method is successfully applied for the determination of zinc (II) in pharmaceutical and biological samples. The proposed method when compared with other reported spectrophotometric methods 5 - 11 was found to be more sensitive and selective. It also offers advantages like reliability and reproducibility in addition to its simplicity instant color development and less interference.
EXPERIMENTAL SECTION
Apparatus: A PerkinElmer Lambda 25 range 190-1100 nm, band width 1 nm UV-VIS
spectrophotometer with 1.0 cm quartz cell was used for absorbance studies. An Elico LI-120 digital pH meter was used for pH adjustment.
Reagents: All reagents used were of analytical reagent grade unless otherwise stated.
Acetylpyridine-4-methyl-3-thiosemicarbazone(APMT)prepared by simple procedure. 2-acetylpyridine (4ml, 0.0357 mol) in 5ml of methanol, 4-methyl-3- thiosemicarbazide (3.75 g, 0.0357 mol) dissolved in 10 ml of hot water) were taken in 250-ml round bottom flask. Suitable quantity (~ 2 ml) of glacial acetic acid was added to the reaction mixture and refluxed for 3 hours. On cooling the reaction mixture, light brown coloured product was separated. It was collected by filtration and washed several times with hot water and 50 percent cold methanol. This compound was recrystalised from ethanol and dried in vacuum. Yield 3.8 g; m.p. 183-185 0C. (Scheme 1).
Scheme 1
A sample of 2.0847 g of zinc chloride was taken in a litre standard flask. This was then dissolved and made up to One liter with double distilled water. The exact content of zinc was determined, gravimetrically by 8-hydroxyquinoline.12 The working solutions were obtained by
+
S N
H2 NH C NH CH3 N
C
CH3
N NH C NH CH3
S
N C
O CH3
diluting the stock solution to the requisite concentrations with double distilled water. 1.0 mol L-1 sodium acetate and 1.0 mol L-1 acetic acid solutions were prepared in double distilled water. Suitable portions of these solutions were mixed to get the desired pH.
General procedure: To an aliquot of a working standard solution 1 mL of 3X10⁻⁴ M zinc(II), were added pH 6.0 buffer (10 mL), 1X10⁻² M reagent solution in (1 mL) 25 mL standard flask and made up to the mark with double distilled water. The absorbances of solutions were measured at 365 nm against the reagent blank.
RESULTS AND DISCUSSION
Characterization of APMT: The compound was characterized by IR and 1H-NMR spectral data. Infra red spectrum of APMT shows bands at (3288(s), 3239(s), 3043(m), 1577(s), 1537(s), 1497(s), 1364(w), 1147(m), 832(s) and 681(s)cm-1 corresponding to ν(N–H) (asymmetric and symmetric), ν(C–H)aromatic stretch, ν(C=N)stretching(Schiff base), ν(C–H) aromatic ring,
ν(C–H)of pyridine ring, ν(N–H) stretch(primary amide), ν(C=S), ν(C–H)-oop bend (aromatic) and ν(C–C)-oop bend aromatic ring vibrations. 1H-NMRspectrum of APMT (CDCl3+DMSO–
d6) showed signals at 2.39(3H,S), 7.37–8.58(m) due to C 5H4N(pyridine), and 3.24(s)
corresponds to CH3 group attached to nitrogen atom of thiosemicarbazone.
PKa values of APMT: The absorption spectra of APMT at different pH values were recorded.
The compound shows single absorption maximum (Position depends on pH) which may be due to π – π* transitions. In alkaline medium (8 – 10), this band is shifted towards higher wavelength
(lower energy) due to the formation of conjugated negative anion. The shifting of absorption maximum from lower wavelength to higher wavelength is known as bathochromic shift, a common spectral property of Schiff reagent.
The PKa values were determined by recording the UV-Visible spectra of micro molar (1x10⁻⁴)
solutions of reagent at various pH values and by taking the arithmetic mean of the values obtained from the measurement at different wavelengths determined spectrophotometrically using Phillips and merit method2. The values of deprotonation of APMT are 4.1 (PK1) and
8.2(PK2) (Scheme 2).
Zinc(II) react with APMT in acidic pH to give coloured complexes Table 3. Various physico-chemical and analytical characteristics of the complex is summarized in Table 1.
NH N C N CH3 C S CH3 HN N N C N CH3 C N H S H CH3 Keto form
Enol form Mono anion
pK2 = 8.2
pK1= 4.1
N N C N CH3 C N H S CH3 (-)
+ H+
Analytical procedures for various samples
Pharmaceutical samples: The samples were treated separately with concentrated nitric acid on a hot-plate, at a low temperature, to avoid violent spurting. The temperature of the hot-plate was increased to 300 ºC. The residue obtained was dissolved in nitric acid (1:1) and then slowly heated 2 h to produce a dry mass. Finally the residue was dissolved in a minimum amount of double distilled water. The same solution was quantitatively transferred into a 50 mL volumetric flask and then made up to the mark with double distilled water.
Biological samples: 2 – 5 g of dried fish and sheep liver samples were taken in a 250 ml beaker
6 ml of concentrated nitric acid was, added and gently heated for half-an-hour. After the disappearance of the froth, 6 ml of 1 : 1 nitric acid and perchloric acid were added. The contents were digested for one hour and repeatedly treated with 6 ml portions of nitric acid and perchloric acid mixture until the solution becomes colourless. The acid solution was evaporated to dryness and the resulted white residue was dissolved in minimum volume of 1M nitric acid and made up to the volume in a 50 ml volumetric flask 13-16.
Certified Reference Materials: About 0.1 g of each sample was dissolved in 10 mL of
aqua-regia. They were heated to near dryness and the nitrate was expelled from the residue, using 5 mL of concentrated hydrochloric acid. Each residue was extracted into double distilled water separately and made up to 50 mL in volumetric flask. The concentration of zinc was determined by following the procedure described in general procedure.
Determination of Zinc using 2-Acetylpyridine-4-methyl-3-thiosemicarbazone: zinc (II)
reacts with 2-Acetylpyridine-4-methyl -3-thiosemicarbazone (APMT) and forms a yellow colored complex in sodium acetate-acetic acid buffer of pH 5.5. The complex has a maximum absorbance at 365 nm. It is instantaneous and is stable for more than 48 h. Hence to develop a rapid and sensitive spectrophotometric method for the determination of zinc (II), when present alone or in presence of diverse ions, which are usually associated with zinc (II) in pharmaceutical and biological samples.
1. Absorption spectra of the reagent and Zn (II)-APMT complex
1.0 ml of 3 X10⁻⁴ M zinc(II) solution, 1.0 ml of 1 X 10⁻² mol L-1 APMT solutions were added to containing 10 ml of buffer (pH 6.0) in a 25 ml standard flask and made up to the mark with double distilled water. Spectrum was recorded using the reagent solution as a blank, which was prepared by using the same solution without zinc(II). Similarly, the absorption spectrum of the reagent was also recorded, using the solvent as a blank. The absorption spectra of both the reagent and the complex are depicted in Figure 1.
From the two spectra it is clear, that the Zn(II)-APMT complex and the reagent have maximum absorbance’s, at 365 nm and 350 nm, respectively. The reagent has a minimum absorbance at the maximum absorbance of the complex and does not interfere in the determination of zinc(II). Hence, all further absorbance measurements of the complex are made at 365 nm.
2 Effect of pH on the extraction of Zn(II)-APMT complex:
Fig: 1. Absorption Spectra of a) APMT Vs Water blank b) Zn (II) – APMT complex Vs APMT solution, [Zn (II)] =1.2 x 10⁻⁵ M, [APMT]=2 x 10⁻⁴ M, pH = 6.0
The studies were carried out keeping the 1.0 ml of 3 X 10⁻⁴ mol L-1 zinc (II) solution and 1.0 ml of 1 X 10⁻² mol L-1 APMT solution constant and varying the pH values from 4.0 to 10.0 using suitable buffer solutions. The volume of each aqueous phase was adjusted to 25.0 mL with double distilled water. The plot between pH and its absorbance is shown in Figure 2. From the graph, it is observed. Hence, sodium acetate-acetic acid buffer is used for further studies, keeping 6.0 as the optimum pH.
4 5 6 7 8 9 10 11
0.00 0.05 0.10 0.15 0.20 0.25 0.30 0.35 0.40 0.45 0.50
A
b
s
o
rb
a
n
c
e
pH
Fig: 2 Effect of pH on the absorbance of Zn (II) – APMT complex, [Zn (II)]=1.2 x 10⁻⁵ M, [APMT]=4 x 10⁻⁴ M, Wavelength = 365 nm
3 Effect of reagent concentration on the absorbance of Zn (II)-APMT complex:
4 Adherence of the Zn(II)-APMT complex system to Beer's law:
Known aliquots of various solutions , each containing constant volumes of 10.0 mL of sodium acetate-acetic acid buffer (pH 6.0), 1.0 mL of 1 X 10⁻² mol L-1 reagent, and varying volumes of zinc(II) (0.105-1.05 µ g) were prepared in a 25 mL standard flask and made upto double distilled water.The absorbances of the complexes were measured at 365nm. A graph plotted between the amount of Zn(II) and its absorbance is shown in Figure 3.
0.0 0.1 0.2 0.3 0.4 0.5 0.6 0.7 0.8 0.9 1.0 1.1
0.0 0.1 0.2 0.3 0.4 0.5
0.6 A365= 0.507C - 0.0026
A
b
s
o
rb
a
n
c
e
Amount of Zn(II) (µg/ml)
Fig: 3 Calibration plot for Zn (II) determination pH = 6.0[APMT] =4 x 10⁻⁴ M, Wavelength = 365 nm
5 Sensitivity and molar absorptivity of the Zn(II)-APMT complex:
The molar absorptivity of the complex is calculated and noted as 3.5 X 10⁴ L mol-1 cm-1 and the Sandell's sensitivity of the complex is 1.88 X 10⁻³ µg cm-2. The regression line is given by Absorbance = 0.507C - 0.0026.
6 Precision, accuracy and detection limit of the method:
To assess the precision and accuracy of the method, determinations were carried out with different concentrations of zinc(II), under optimum conditions. The standard deviation is found to be not more than 0.007 and the relative standard deviation is less than 1%. It is evident from these results that, the method is precise, besides being accurate. The detection limit, Cmin, was
determined as the amount of zinc (II) corresponding to three times the standard deviation of the blank values and a value of 0.02 µ g mL-1 was obtained.
7 Determination of the composition of Zn(II)-APMT complex:Spectrophotometric
investigation of the metal complex was made to obtain the composition of the complex. Job's method of continuous variation and molar ratio methods were employed to elucidate the composition of the complex.
Job's method of continuous variation: Equimolar solutions of zinc(II) and the APMT (2 X 10⁻⁴
Fig: 4 Job’s method of continuous variation of Zn (II)-APMT complex. Zn (II) = APMT = 2 x10⁻⁴ M (Stock solution), Wavelength = 365 nm, pH = 6.0
The composition of the complex is found to be 1:1 (M:L). The stability constant of the complex is calculated by using the following equation.
(
)
C
2
1
α
α
β
=
−
The values α and C are calculated as 0.106 and 4 x 10⁻⁵ M. The stability constant is found to be
1.987 x 10⁶. Molar ratio method: The amount of metal ion (5.0 ml of 2 X 10⁻⁴mol L-1) and reagent concentration (2 X 10⁻⁴ mol L-1 ) with different volume ( 1-9 ml) of APMT to that of the metal ion. To each solution, 10.0 mL of sodium acetate-acetic acid buffer (pH =6.0) was added in 25 ml standard flasks and made up to the mark with double distilled water.
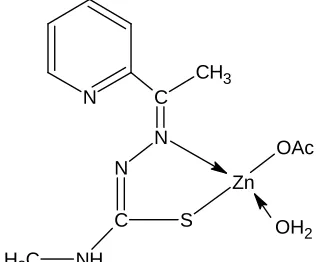
The absorbance of these solutions were recorded at 365nm, against their corresponding reagent blanks and a plot is drawn between the absorbance with mole proportion of the metal ion (Figure 5). From the graph, it is observed that one mole of the reagent and one mole of the metal ion participate in the complex formation, which is in good agreement with the results of Job's method of continuous variation. Based on the compositions of the complex determined in solution state, the structure tentatively assigned for the Zinc complex with 2-Acetylpyridine 4-methyl-3- thiosemicarbazone (structure )
N C
CH3
N N
C S
NH C H3
Zn OAc
OH2
Structure : Zn (APMT) (OAc) H2O complex
8 Effect of foreign ions on the extraction of Zn (II)-APMT complex:
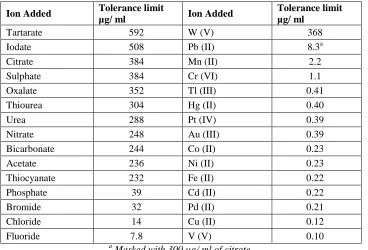
[image:8.595.225.385.188.319.2]In order to assess the possible analytical applications of this color reaction, the effect of some foreign ions was examined, by carrying out determinations of 0.53 µ g of zinc(II) with a known amount of foreign ion in question, using the recommended general procedure. The criterion for interference is an absorbance varying more than ± 2% from the expected value for zinc(II) alone.
Table 1. Physico – Chemical and Analytical characteristics of Zn – APMT complex
S.No Characteristics Results
1 λmax (nm) 365
2 pH - range (optimum) 5 – 8
3 Mean absorbance 0.2625 ± 0.0015
4 Mole of reagent required per mole of metal ion for full
colour developed 10 Fold
5 Time stability of the complex (in hrs) 6 Hr
6 Beer’s law validity range (µg/ml) 0.105 -1.05
7 Molar absorptivity (L mol-1 cm-1) 3.5 x 10⁴ 8 Specific absorptivity (ml g-1 cm-1) 0.533
9 Sandell’s sensitivity (µ g/cm2) 0.0019
10 Composition of complex as obtained Jobs and molar ratio
methods (M:L) 1 : 1
11 Stability constant of the complex 1.987 x10⁶
12 Standard deviation in 10 replicate determinations of 0.533
µg/ml of Zn (II) 0.005
13 Relative standard deviation (RSD)% 0.96
Anions like tartarate, oxalate, iodate citrate, sulphate do not interfere in the determination even when present up to 500 µ g or more. Thiourea, nitrate, urea , bicarbonate, acetate and thiocyanate tolerable upto 300 µg. Fluoride, chloride, bromide, iodide, phosphate and EDTA do not have any effect on the interfere severely during the determination of zinc (II). The results are given in Table 2.
Table 2. Tolerance limit of foreign ions in the determination of 0.53 µg/ ml of Zinc
Ion Added Tolerance limit
µg/ ml Ion Added
Tolerance limit µg/ ml
Tartarate 592 W (V) 368
Iodate 508 Pb (II) 8.3a
Citrate 384 Mn (II) 2.2
Sulphate 384 Cr (VI) 1.1
Oxalate 352 Tl (III) 0.41
Thiourea 304 Hg (II) 0.40
Urea 288 Pt (IV) 0.39
Nitrate 248 Au (III) 0.39
Bicarbonate 244 Co (II) 0.23
Acetate 236 Ni (II) 0.23
Thiocyanate 232 Fe (II) 0.22
Phosphate 39 Cd (II) 0.22
Bromide 32 Pd (II) 0.21
Chloride 14 Cu (II) 0.12
Fluoride 7.8 V (V) 0.10
a
[image:9.595.125.493.188.438.2]Masked with 300 µg/ ml of citrate
Table 3. Chromogenic Characteristics of APMT
Metal ion λmax (nm) pH range Molar
absorptivity *
Colour of the complex
Cu (II) 380 5 – 8 1.47 X 10⁴ Yellow
Hg (II) 350 6 – 8 1.08X 10⁴ greenish yellow
Co (II) 360 5 – 8 1.86 X 10⁴ orange Yellow
Ni (II) 375 6 – 8 2.16 X 10⁴ Yellow
Zn (II) 365 5 – 8 3.50 X 10⁴ Pale yellow
V (v) 380 5--8 1.07 X 10⁴ Yellow
Cd (II) 362 5--8 2.68 X 10⁴ greenish yellow
* L. mol-1.cm-1
9 Applications of the developed method:
The proposed method was applied for the determination of zinc(II) in pharmaceutical, biological samples and Certified Reference Materials.
Determination of zinc(II) in pharmaceutical samples. Pharmaceutical samples like zincovit,
Table 4. Determination of zinc(II) in pharmaceutical samples
Name of the
Sample Composition, certified value mg/tablet
Amount of Zn(II) found (mg/tablet) AAS
method
Present method
Zincovit Zinc sulphate monohydrate, 63mg
(equivalent to lemental zinc 22.92mg) 22.92 22.89
Zevit Zinc sulphate monohydrate, 61.8mg
(equivalent to elemental zinc 22.49mg) 22.49 22.45
Becozinc Zinc sulphate monohydrate, 54.93mg
(equivalent to elemental zinc 19.99mg) 19.99 19.91
Antoxid Zinc sulphate monohydrate, 27.45mg
(equivalent to elemental zinc 9.99 mg) 9.99 9.87
Determination of zinc(II) in biological samples. Biological samples like Sheep liver and Fish
[image:10.595.99.513.91.254.2]liver were analyzed for Zn (II) using the proposed method. The results are comparable to the data obtained by AAS method (Table 5).
Table 5. Analysis of liver sample of Sheep and Fish
Liver samples Amount of zinc
a found (µg/g of dried liver) AAS method Present method
Sheep liver 3.325 3.317
Fish liver 2.859 2.843
Note ‘a’: average of five determinations.
Determination of zinc(II) in certified reference materials.
The present method is applied for the determination of zinc(II) in certified reference materials such as Tomato leaves (NIST 1573) and Citrus leaves (NBS 1572) (Table 6).
Table 6. Determination of zinc(II) in certified reference materials
Note ‘a’: average of five determinations.
CONCLUSION
A thorough literature survey revealed that many thiosemicarbazones were used for the determination of zinc(II). Studies upon the use of 2-Acetylpyridine-4-methyl -3-thiosemicarbazone (APMT) as an analytical reagent are limited. Hence, the present investigations were carried out with a view to test the potentiality of APMT as a complexing agent for Zn(II) and its subsequent determination by spectrophotometry. The method has good sensitivity, compared with other existing spectrophotometric determination methods. Finally, the developed method can be conclusively declared apt for the determination of Zn(II) in pharmaceutical and biological samples.
Certified reference material
Zinc a( mg kg-1)
Certified value present method
Tomato leaves (NIST 1573) 62.0 61.84
[image:10.595.170.441.346.402.2]Acknowledgement
Authors are thankful to Dr. K. Ramakrishna Prasad, Associate Professor, IISC, Bangalore for his help in recording IR and NMR spectra of reagent samples. Permission to K.Vasudeva Reddy by the Commissioner, Collegiate Education Department, Government of Karnataka is acknowledged.
REFERENCES
[1] William D R, Computer Models of Metal Biochemistry and Metabolism in Chemical
Toxicology and Clinical Chemistry of Metals, Academic Press: NY, 1983.
[2] Fisher G L, Sci. Total Environ. 1975, 4, 373.
[3] Giroux E L, Durieux M and Schechter P J, Bioinorg. Chem., 1976, 5, 211. [4] Hernick M and Fierke C A, Arch. Biochem. Biophys. 2005, 443, 71.
[5] Reddy B K, Kumar J R, Sarma LS and Reddy A V, Anal. Lett. 2002, 35, 1415. [6] Hoshi S, Yotsuyanagi T and Aomura K Bunseki Kagaku, 1977, 26, 592. [7] Nevado J J B, Leyva J A M and Ceba M R, Talanta 1976, 23, 257.
[8] Benamor M, Belhamel K and Draa M T, J. Pharm. Biomed. Anal. 2000, 23, 1033. [9] Herrador M A, Jiménez A M, Asuero A G, Analyst 1987, 112, 1237.
[10]Leyva J A M, Pavon J M C and Pino F, Inform. Quim. Anal. 1972, 26, 226.
[11]Korn M G A, Ferreira A C, Teixeira L S G and Costa A C S, J. Braz. Chem. Soc. 1999,
10, 46.
[12]Vogel, A. I.; A Text Book of Quantitative Inorganic Analysis, Longman Green: London,
1961.
[13]Hussain Reddy,K and Venkata Reddy, D, Acta ciencia India, 1984, XC 4, 207. [14]Kazumi Inagaki et al. The Analyst, 2000, 125, 191.