State
Investment
in
Research
&
Development
FORFÁS STATE INVESTMENT IN R&D 2012-13
1
Table of Contents
Executive Summary 3
Introduction 5
Chapter 1: State funding of research and development 7
1.1 Types of research and development indicators 8 1.2 Government budget spending on research and development 9 1.3 Detailed Government department spending on research and development 10 1.4 Programmes classified by area of research 11 1.5 GBAORD as a percentage of GNP and international comparisons 12 Chapter 2: Expenditure on R&D performed in the public sector 16
2.1 Total expenditure on R&D performed in the Government sector 16 2.2 Types of Research 19 2.3 Fields of science 20 Chapter 3: Human resources dedicated to publicly performed R&D 21
3.1 Research and development personnel 21 3.2 State sector research staff by occupation 22 3.3 State sector research staff by qualification 23 3.4 Research and development staff by fields of science (FTE) 24 Appendix 1. Methodology 26 2. Definition of Research & Development 27 3. Government Departments and Agencies included in the 2012-2013 survey 28 4. Acronyms 29
5. Main Government Departments/Agencies R&D programmes 30
6: Sample Questionnaire 33
7: Forfás Board Members 37
2
List of Figures
Figure 1: Gross Expenditure on R&D (GERD) - elements 8 Figure 2: GBAORD trend in current prices, €m. (2004-2013) 9 Figure 3: GBAORD trend (€m) and GBAORD as a percentage of GNP (2004-2013) 12 Figure 4: International comparison of GBAORD as a percentage of GDP/GNP (2012) 14 Figure 5: Average annual growth rate of GBAORD for selected countries, (2003–2012) 15 Figure 6: GOVERD as a percentage of GNP and GOVERD €m trend, (2004-2013) 16 Figure 7: Major State research and development performers, per cent of total (2013) 17 Figure 8: Total R&D personnel & researchers - headcount (2006-13) 21 Figure 9: Total R&D personnel & researchers by occupation - headcount (2012-13) 22 Figure 10: Total R&D personnel by occupation – Full Time Equivalents (FTEs), (2013) 22 Figure 11: Total R&D personnel by occupation and gender (FTEs), (2013) 22 Figure 12: Total R&D personnel & researchers by qualification - headcount (2012-13) 23 Figure 13: Total R&D personnel by qualification – Full Time Equivalents (FTEs) (2013) 23 Figure 14: Total R&D personnel by qualification and gender (FTEs), (2013) 23 Figure 15: Researchers classified by gender and field of science (FTE), (2013) 25
List of Tables
Table 1: Main Government Depts & Agencies with spending of R&D activities (2013 est) 10 Table 2: GBAORD classifications for Ireland 2013 11 Table 3: GBAORD as a percentage of economic activity (GDP/GNP) (2003+2012) 13 Table 4: GOVERD as a percentage of GDP, selected countries (2002, 2007, 2011) 18 Table 5: GOVERD by type of research (2012-2013) 19 Table 6: Field of science classified by type of research, (2012-2013) €m. 20 Table 7: Total male/female and as percentage of total by field of science, FTEs (2013) 24
Science Budget Categories
GBAORD (R&D)
- the total expenditure by Government on research and development
GOVERD (R&D)
- the research and development carried-out in Government Departments or Agencies
(a sub-set of GBAORD) GOVERD (R&D) – Researchers
- the number of researchers working within the Government sector. Data provided for
Ex
The App
Figu
Irela belo
Figu
xecutive
State’s inve propriations o
ure A. GBA
Overall ex
Estimated
€773m.
The inten
consistent
and’s GBAOR ow the EU27
ure B. Inte
e Summ
estment in re or Outlays on
AORD trend (
xpenditure le
d direct Gove
nsity level of t with the 20
RD intensity average at 0
rnational co
mary
esearch and n R&D (GBAO
(€m.) (curre
evels fell fro
ernment fun
investment 012 outturn
rate in 2012 0.65 per cen
omparison of
FORF
developmen ORD) decreas
ent prices) a
om a peak of
nding for rese
is expected figure.
of 0.57 per nt of GDP (Fi
f GBAORD as
FÁS STATE I
nt, also know sed in 2012 o
and as a perc
f €938m in 2
earch in 2013
to remain a
cent of GNP gure B).
s a percenta
INVESTMENT
wn as Govern over 2011 (F
centage of G
008 to €760m
3 is expected
t 0.57 per ce
P and 0.46 pe
age of GDP/G
T IN R&D 20
nment Budge Figure A).
GNP, 2004-2
m in 2012 (-1
d to increase
ent of GNP i
er cent of GD
GNP, 2012
012-13
3
et
2013
19%).
e to
n 2013
4
Figure
The 10 R&D (G and Ag
Figure
Figure Govern
e C. GOVER
0-year trend GOVERD). T gencies.
Expenditure allocation of
GOVERD as a drop from 0
e D. Total R 2006-1
D shows bot nment secto
The overall 2006 from 1 equivalent (
The number same period researchers
RD trend (€m
as illustrate his is R&D pe
e on R&D in t f €98m in 20
a percentage .11 per cent
R&D personn 13
th the total r.
number of R ,297 to 1,10 FTE) numbe
r of (FTE) R& d. There wil
(FTE) in 200
m) (current p
ed in Figure C erformed wi
the State sec 013 (-29%).
e of GNP ove t in 2004 to 0
nel/research
number of R
R&D personne 5 in 2013 an rs.
&D personnel l be 507 (FTE 06 (+4.5%).
prices) and
C shows that thin the Stat
ctor has falle
er the ten-ye 0.07 per cen
hers in Gove
R&D personne
el (headcoun nd this trend
l dedicated t E) researche
as a percen
t levels of Go te sector by
en from a hig
ear period fr t in 2012/13
ernment Sec
el employed
nt) has fallen is also refle
to research h ers employed
tage of GNP
overnment E Government
gh of €138m
om 2004 to 2 3.
ctor (headco
directly wit
n by 14.8 pe cted in the f
has risen slig d in 2013 com
P, 2004-2013
Expenditure o t Departmen
in 2004 to a
2013 shows a
ount/FTE ter
thin the
er cent since full-time
ghtly over th mpared with
3
on nts
an
a
rms)
FORFÁS STATE INVESTMENT IN R&D 2012-13
5
Introduction
This report tracks public funding and performance of State-funded Research & Development (R&D) and aims to capture key performance metrics within the State sector. A total of 35 Government departments and agencies who are engaged in some form of R&D activity in 2012-2013 were surveyed. This report presents findings from the ‘Research and Development Funding and Performance in the State Sector – 2012-13’ survey undertaken by Forfás with the final outturn data for 2012 together with estimates for 2013.
This survey data is required for, and/or included in, the following reports:
Commission Regulation (EC) No 995/2012 of 26 October 20121. This Regulation covers the
production and development of Community statistics on science and technology. Data is required by Eurostat on Government expenditure and on the numbers employed in research and development in the public sector.
OECD ‘International data collection on resources devoted to research and development’.2
Strategy for Science, Technology & Innovation. Indicators collected are included in the
SSTI Indicators report to identify issues arising and resulting policy requirements.
The metrics analysed in the report include:
Chapter 1: State funding of research and development
Government Budget Appropriations and Outlays on Research and Development
(GBAORD).
Data on Government Departments / Agencies funding by area of research and as a
percentage of GNP & international comparisons.
Chapter 2: Expenditure on R&D performed in the Public Sector
Government Expenditure on Research and Development (GOVERD). R&D performed in
Government Departments and their Agencies.
Chapter 3: Human resources dedicated to publicly performed R&D
Data on the overall totals, gender, qualifications and occupations of R&D staff.
The survey is carried out using the definitions, rules and guidelines set out in the OECD
Frascati Manual3. This allows for a common dataset to be collected across all OECD and EU
countries which facilitates better international comparisons and benchmarking.
1 Commission Regulation (EC) No 995/2012 of 26 October 2012
http://eur-lex.europa.eu/LexUriServ/LexUriServ.do?uri=OJ:L:2012:299:0018:0030:EN:PDF
2 Main Science and Technology Indicators (MSTI) , OECD
6
Data on GBAORD, GOVERD and human resources is also prepared under European statistical legislation. All international comparison figures relate to the most recent data available for each country.
The data refers to direct Government expenditure and other Government expenditures such as R&D tax credits to business are not included.
The findings from this survey complement the findings from the other R&D performance surveys conducted by Forfás and the Central Statistics Office. These include the Business Expenditure R&D survey (BERD) and the Higher Education R&D performed survey (HERD). The total performance of R&D in the State is then added to create the Gross Expenditure on R&D (GERD) metric.
Forfás would like to thank the many respondents to this survey who have taken the time to gather information and complete the data requests for this key area of Government policy.
For further information on this survey please contact:
Deborah Quinn Forfás
Wilton Park House Wilton Place Dublin 2
Telephone: 353 (01) 6073135
Email: [email protected]
FORFÁS STATE INVESTMENT IN R&D 2012-13
7
Chapter 1: State funding of research & development
In this chapter, total Government spending on research and development (R&D) is charted for the last decade and benchmarked against international competitors.
1.1 Types of research and development indicators
R&D, as defined by the OECD, “comprises creative work undertaken on a systematic basis in order to increase the stock of knowledge, including knowledge of man, culture and society,
and the use of this stock of knowledge to devise new applications”.4 This report focuses on
the following R&D international data measures:
Government Funding of R&D (GBAORD)
GBAORD – Government Budget Appropriations or Outlays on R&D – (this chapter). This is all the money allocated by Government to R&D to be performed in all sectors of the economy e.g. within the higher education sector, by businesses or by Government Agencies.
R&D Performers (GOVERD, HERD, BERD)
The other international measure of R&D activity is derived by tracking the expenditure of the performers of R&D. The main performers are:
1. Government Sector (GOVERD – Government Expenditure on R&D)
GOVERD – Measure of R&D performed in the Government sector. This is the
expenditure from all sources spent on R&D performed in Government departments and agencies. This expenditure is tracked in Chapter 2 of this report.
2. Higher Education Sector (HERD – Higher Education Expenditure on R&D)
HERD - Measure of R&D performed in the higher education sector. This is the
expenditure from all sources spent on R&D performed in universities and institutes of technologies. This expenditure is tracked through the HERD survey. Data from the ‘Higher Education R&D Survey 2010-11’ will be available shortly on the Forfás web site.
8
3. Bu
4. Gr
Figure
5 Busin http: ureon
6 Busin http:
usiness Enter BERD - Me expenditure is tracked t Expenditure Office (CSO Forfás web
ross Expendit GERD - Co in the high (GERD).
e 1: Gross e
ess Expenditu //www.cso.ie nresearchandd
ess Expenditu //www.forfas
rprise Sector easure of R&
e from all so through the B
e on R&D 20
O) web site5 a
site6
ture on R&D llectively, th her educatio
expenditure
ure on R&D 20 e/en/newsand development2
ure on R&D 20 s.ie/publicati
(BERD – Bus D performed ources spent BERD survey 12-13’ surve and a summa
(GERD) he expenditu
n sector (HE
on R&D (GE
011-12 – Key F devents/press 20112012/
011-12, Forfás on/search.jsp
siness Expend d in the busin on R&D perf y and the late ey. This data ary of the fin
ure by gover ERD) make up
ERD) - eleme
Findings, CSO, sreleases/201
s. August 2013 p?ft=/publicat
diture on R& ness enterpr formed in bu est available a is accessib ndings of thi
nment (GOV p the total o
ents
, February 20 3pressrelease
3
tions/2013/tit
&D)
rise sector. T usinesses. T e data is from
le on the Ce s survey is a
ERD), busine r Gross Expe
13
es/pressreleas
tle,11162,en.p
This is the This expendit
m the ‘Busin entral Statist available on t
ess (BERD) an enditure on R
sebusinessexpe
php
ture ess tics the
nd R&D
1.2
The is th incl
Figu
Whi the cent ‘ind repo
Governm
internationa he Governme
udes:
funding for Department Foundation
funding for Enterprise I
funding for and others.
ure 2: GBAO
le there is a State remai t increase on dustrial produ orting increa
ment budge
ally recognis ent Budget A
R&D program t of Educatio Ireland (SFI)
business sec reland and o
R&D perform
ORD trend in
decline in e ns significan n 2012 levels uction and te ased allocati
et spending
sed indicator Appropriation
mmes in the on and Skills, ) and others;
ctor R&D, ad others; and
med in the G
current pri
expenditure i t and alloca s. The incre echnology’ s ons over 201
FORF
g on researc
r for benchm ns or Outlays
higher educ , the Higher ;
ministered v
Government s
ices, €m. (2
in the last fo ted expendi eased alloca sectors with 12 figures.
FÁS STATE I
ch and dev
marking State s on R&D me
cation sector Education A
via State age
sector e.g. T
004-2013)
our years, th ture in 2013 ted expendi both Enterp
INVESTMENT
velopment
e-funding pe
etric (GBAOR
r administere uthority (HE
encies includ
Teagasc, The
he level of R& stands at €7 ture in 2013 rise Ireland
T IN R&D 20
erformance o
RD), which
ed by the EA), Science
ding IDA Irela
e Marine Inst
&D funding f 773m, a 1.7 is primarily and IDA Irela
012-13
9
of R&D
and,
itute,
from per
10
1.3 Detailed Government department spending on research and development
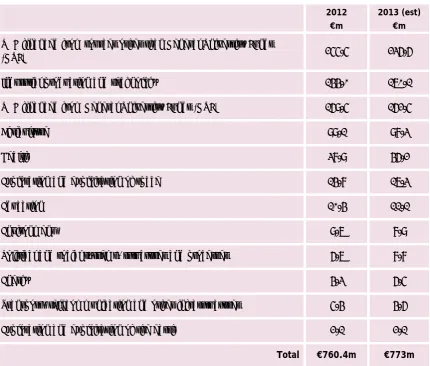
Table 1 provides a breakdown of estimated R&D spending by the main administrating Government departments and agencies in 2013 and the outturn figures for 2012.
The largest agency funding R&D projects in 2013 was the Higher Education Authority, which has allocated an estimated €212.1m to R&D activities (or 27.4 per cent of the total State spending on R&D). This spending includes expenditure on R&D programmes and indirect funding via the HEA block grant to supported institutions. The HEA also allocates direct funding via the Programme for Research in Third-Level Institutions (PRTLI) on behalf of the Minister for Jobs, Enterprise and Innovation.
The next largest funder of R&D activities was Science Foundation Ireland, allocating an estimated €159.1m (20.6 per cent) to R&D in 2013 via research grants and other research supporting programmes.
[image:11.595.72.500.376.738.2]A summary of the main programmes are outlined in Appendix 5.
Table 1: Main Government Departments and Agencies with spending on R&D activities (2012 and 2013 estimates)
Funding Department/Agency 2012
€m
% of Total
2013 €m
% of Total
Higher Education Authority 234.1 30.8% 212.1 27.4%
Science Foundation Ireland 161.9 21.3% 159.1 20.6%
Enterprise Ireland 92.4 12.2% 107.6 13.9%
Teagasc 59.7 7.9% 59.1 7.6%
IDA Ireland 44.6 5.9% 56.0 7.2%
Health Research Board 36.5 4.8% 43.5 5.6%
Irish Research Council 31.0 4.1% 31.4 4.1%
Dept. of Agriculture, Food and the Marine 28.4 3.7% 26.2 3.4%
Dept. of Jobs, Enterprise and Innovation 20.0 2.6% 21.7 2.8%
Marine Institute 7.8 1.0% 9.0 1.2%
Environmental Protection Agency 9.6 1.3% 8.8 1.1%
Others 34.4 4.5% 38.5 5.0%
FORFÁS STATE INVESTMENT IN R&D 2012-13
11
1.4 Programmes classified by area of research
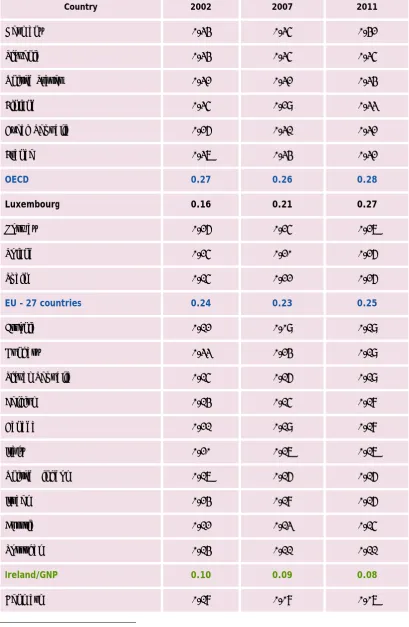
[image:12.595.90.521.157.523.2]The total GBAORD for 2012 and 2013 can be classified into a number of economic areas:
Table 2: GBAORD classifications7 for Ireland 2012-13
2012 €m
2013 (est) €m
R&D financed from sources other than General University Funds
(GUF) 255.5 236.6
Industrial production and technology 144.0 170.1
R&D financed from General University Funds (GUF) 169.5 162.5
Agriculture 99.1 98.3
Health 38.9 46.2
Exploration and exploitation of space 14.8 17.3
Education 10.4 11.1
Environment 9.7 8.9
Political and social systems, structures and processes 6.7 8.8
Energy 4.3 6.5
Transport, telecommunication and other infrastructures 5.4 4.6
Exploration and exploitation of the earth 2.1 2.1
Total €760.4m €773m
Over half of total GBAORD funding for 2013 was allocated for R&D performed in higher education (GUF). This €399m includes funding for various agencies, such as Science
Foundation Ireland, the Higher Education Authority’s Programme for Research in Third-Level Institutes and other research funding bodies operating in the higher education sector.
The Industrial production and technology area shows an increase of €26m over the 2012 outturn figure. This accounts for 22 per cent of total GBOARD in 2013 and is expected to reach €170m.
Agriculture at €98m accounts for 12.7 per cent of total Government estimated spending on R&D programmes in 2013 while health accounts for 6 per cent of total spend.
The remaining GBAORD is divided between exploration and exploitation of space & the earth, education, the environment, energy, political and social systems, transport,
telecommunications and other infrastructures.
12 1.5
In orde GBAOR GBAOR for R&
In Figu increa downw €773m
Figure
The GB activit
The pe during
Betwe outpac
Fundin at 0.57
8 OECD Deve
9 GNP 2 http:
GBAORD
er to compar RD indicator RD includes a &D in the hum
ure 3 the GBA se in state R ward trend in m shows a slig
e 3: GBAORD
BAORD inten ty divided by
eriod 2004 to a period of
en 2008 and cing nominal
ng during 201 7 per cent of
D (2002), Fras lopment, OEC
2013 – forecas //www.centr
as a percen
re state fund with data de all funding fo manities and
AORD trend R&D spending
n the followi ght increase
D trend (€m)
nsity ratio [St y Gross Natio
o 2007 saw t strong fundi
2011 the GB l economic g
12 and alloca f GNP.
scati Manual: CD, Paris, www
st €134.445m, ralbank.ie/pu
ntage of GN
ding of R&D a erived using or R&D from
social scien
line shows th g from €615m ng four year of 1.7 per c
) and GBAOR
tate R&D fun onal Product
he GBAORD ing arising ou
BAORD inten growth to 0.6
ated funding
Proposed Stan w.oecd.org/st
, Central Ban blications/Pag
NP and inte
across count the guidelin direct exch nces.
hat between m to €938m rs. The alloc cent compare
RD as a perc
nding for R& (GNP)] has r
intensity rat ut of strong
nsity rate ros 6 per cent of
g for R&D act
ndard Practice ti/frascatiman
nk, Quarterly B ges/Quarterly
ernational c
tries, the OE nes set out in
equer source
n 2004 and 2 by 2008 in c cated GBAOR ed to the 201
centage of G
&D activities risen over th
tio hover ove economic gr
se as a result
f GNP9
tivities in 20
e for Surveys o nual
Bulletin Q4 – O yBulletin.aspx
comparison
ECD recomme n the Frascat es. It also inc
013 there wa urrent prices RD estimate
12 outturn fi
GNP (2004-20
as a per cen he last decad
er 0.5 per ce rowth.
t of strong R
013 show GBA
on Research a
Oct 2013 ns
ends using th
ti Manual8.
cludes fundi
as a rapid es. There wa
for 2013 of igure of €760
013)
nt of econom de.
ent - this was
R&D spending
AORD intens
and Experimen
he
ing
as a
0m.
mic
s
g
ity
FORFÁS STATE INVESTMENT IN R&D 2012-13
13
[image:14.595.107.491.176.706.2]Alongside this overall funding, we can also examine the civil GBAORD figures. Civil GBAORD is a good metric for international comparisons as it does not include the defence portion of the R&D budget, for which Ireland does not allocate any sum of money.
Table 3: GBAORD as a percentage of economic activity (GDP/GNP)10
Country 2003 2012
Finland 0.97% 1.03%
Denmark 0.73% 1.01%
Iceland 1.08% 0.95%
Portugal 0.58% 0.94%
Germany 0.74% 0.88%
Estonia 0.37% 0.83%
Netherlands 0.81% 0.80%
Austria 0.65% 0.80%
Norway 0.72% 0.76%
Japan 0.69% 0.75%
Czech Republic 0.48% 0.68%
EU 27 (2003-2011) 0.63% 0.65%
Belgium 0.61% 0.64%
Luxembourg 0.22% 0.60%
Ireland - GNP 0.43% 0.57%
Slovenia 0.54% 0.56%
Ireland - GDP 0.36% 0.46%
Australia 0.54% 0.42%
United States 0.47% 0.40%
Greece 0.27% 0.30%
14
Over t relativ
In Irela to 0.57 same p
Figure
* The la
Finland OECD c
In 2012 0.46 p
The lev latest
11 OEC graph
he last ten y ve to econom
and the GBA 7 per cent of period was 0
e 4: Internat
atest available
d, with GBAO countries.
2, the Irish g er cent of to
vel of invest year for whi
D – Main Scien hs are ‘civil’ G
years most E mic activity.
AORD intensit f GNP in 201 0.36 per cent
tional compa
e data for the
ORD spendin
government i otal GDP.
tment intens ich data is av
nce & Techno GBAORD i.e. e
U countries
ty ratio also 2. The inten t in 2003 com
arison of GB
e EU 27 countr
ng of 1.03 pe
invested 0.5
sity of our Eu vailable.
logy Indicator excludes defe
have seen a
increased in nsity ratio fo mpared to 0.
BAORD as a p
ries is for 201
er cent of GD
57 per cent o
uropean part
rs, June 2013, ence expendit
n improveme
n this period or R&D invest .46 per cent
percentage o
1.
DP, is one of
of GNP on res
tners was 0.6
, Vol. 2013/1. ure. http://w
ent in GBAOR
from 0.43 p tment agains in 2012.
of GDP/GNP
the stronges
search and d
65 per cent i
All GBAORD d www.oecd.org
RD performa
per cent in 20 st GDP for th
P (2012*)11
st performin
development
in 2011 – the
data used in t g/sti/msti.htm
ance
003 he
ng
t or
e
Figu
Figu the cent
The late 2003
12 O gra
ure 5: Avera
ure 5 shows t data is avail t though, as
average ann est data avai
3 and 2011 w
OECD – Main Sc aphs are ‘civi
age annual g
the annual a lable. Luxem shown in Ta
nual growth lable for the works out at
cience & Tech l’ GBAORD i.e
growth rate
verage grow mbourg stand able 3 (Page
rate of Irela e EU (27 coun
4.1 per cent
hnology Indica e. excludes de
FORF
e of GBAORD
wth rate of G ds out with a 13), this wa
and’s GBAOR ntries) is 201 t.
ators, July 201 efence expend
FÁS STATE I
D for selecte
BAORD since an annual av s from a low
D for the las 11 and the a
13, Vol. 2013/ diture. http:/
INVESTMENT
d countries,
e 2003 for al verage increa w base.
st 10 years is nnual growth
1. All GBAORD /www.oecd.o
T IN R&D 20
, (2003–201
l countries w ase of 18.7 p
s 4.6 per cen h rate betwe
D data used in org/sti/msti.h
012-13
15
2)12
where per
nt. The een
16
Cha
dev
Resear agenci
The fu other s gather Develo Expend can be contin
2.1 To
The ex sector expect repres
Figure below
GOVER in Figu droppe
Figure
13 GNP http:
apter 2:
velopme
rch and deve ies is measur
unding for Go sources but d red in a sepa opment (HER diture on R& e calculated. ues to be Te
otal expen
xpectation fo in 2013 is th ted to reach ent a margin
6 below sho €100m but h
RD as a perce ure 6. This
ed from 0.11
e 6: GOVERD
P 2013 – foreca //www.centr
: Expe
ent per
elopment pe red by GOVE
overnment E does not inc arate survey RD) survey. W &D) data, the
. As can be s eagasc.
diture on R
or expenditu hat it remain €98m in 201 nal increase
ows that GOV have been m
entage of GN graph shows 1 per cent in
D as a percen
ast €134.445m ralbank.ie/pu
nditure
rformed
rformed by r RD.
xpenditure o lude R&D pe conducted b When GOVER e cumulative een later in
R&D perfor
ure on resear ns at approxi 13 up from t of approxim
VERD expend maintained in
NP over the t that, as a p 2004 to 0.0
ntage of GN
m, Central Ba blications/Pag
e on res
d in the
relevant Gov
on R&D (GOV erformed in t by Forfás titl RD is combine e Gross Expe
this chapter
rmed in the
rch and deve imately the the outturn f mately 1 per c
diture levels n the last thr
ten-year per percentage o 7 per cent in
P and GOVE
ank, Quarterly ges/Quarterly
search
e public
vernment de
VERD) comes the higher e led, the High
ed with the nditure on R r, the main p
e Governme
elopment pe same level a figure of €97
cent.
dropped in ree years and
riod from 200
of GNP13, the
n 2013.
ERD €m trend
y Bulletin Q4 – yBulletin.aspx
and
c secto
partments a
s from public ducation sec her Education
HERD and BE R&D for the c performer of
ent sector
rformed in t as 2012. Exp m in 2012. T
2009 and aga d now stand
04 to 2013 is level of GO
d, (2004-20
Oct 2013
or
and their
c, private an ctor which i
n Research a ERD (Busines country (GER f GOVERD
the Governm penditure is This would
ain in 2010 t at €98m.
s also illustra OVERD has
013)
nd s and ss RD)
ent
to
[image:17.595.84.501.498.706.2]Figu
Figu
As c be t repr supp
Othe per
The
ure 7: Major
ure 7 illustra
can be seen, the largest p
resents 64.5 ports science
er major con cent) and th
contribution
r State resea
tes the majo
Teagasc, th performer of per cent of e-based inno
ntributors in he Departme
n to GOVERD
arch and dev
or contributo
e Irish agricu Government total GOVER ovation in the
clude the Ec ent of Agricu
D from the M
FORF
velopment p
ors to in-hou
ulture and fo t R&D in 201 RD which is e e agri-food a
conomic and lture, Food a
Marine Institu
FÁS STATE I
performers,
use R&D in th
ood develop 3, with expe estimated at and broader
Social Resea and the Mari
ute is €3.9m
INVESTMENT
per cent of
he State sect
ment author enditure of €
€98m in 201 bio-economy
arch Institut ine at €5.6m
(4 per cent)
T IN R&D 20
f total (2013
tor in 2013.
rity, continu €63m. This 13. Teagasc
y sectors.
te at €6.3m ( m (5.8 per ce
).
012-13
17
3)
ed to
18
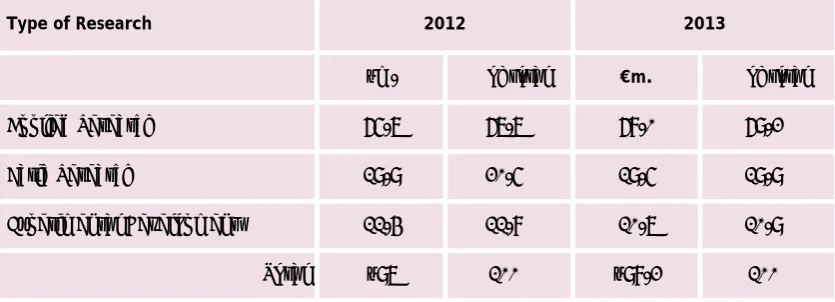
Table 4: GOVERD as a percentage of GDP, selected countries (2002, 2007, 2011)14
Country 2002 2007 2011
Germany 0.34 0.35 0.42
Slovenia 0.34 0.35 0.35
United States 0.32 0.32 0.34
Finland 0.35 0.29 0.33
Czech Republic 0.26 0.31 0.32
France 0.37 0.34 0.32
OECD 0.27 0.26 0.28
Luxembourg 0.16 0.21 0.27
Norway 0.26 0.25 0.27
Poland 0.25 0.20 0.26
Spain 0.15 0.22 0.26
EU – 27 countries 0.24 0.23 0.25
Estonia 0.12 0.09 0.19
Hungary 0.33 0.24 0.19
Slovak Republic 0.15 0.16 0.19
Belgium 0.14 0.15 0.18
Canada 0.21 0.19 0.18
Italy 0.20 0.17 0.17
United Kingdom 0.17 0.16 0.16
Israel 0.24 0.18 0.16
Austria 0.12 0.13 0.15
Portugal 0.14 0.11 0.11
Ireland/GNP 0.10 0.09 0.08
Denmark 0.18 0.08 0.07
14
FORFÁS STATE INVESTMENT IN R&D 2012-13
19
In Table 4, GOVERD as a percentage of GNP15 in Ireland is compared with GOVERD as a
percentage of GDP in countries where data is available. The most recent data available is for 2011 and in this table it is compared with data from 2002 and 2007.
Ireland had the second lowest intensity rate from the selected countries with 0.08 per cent in 2011 compared with an EU-27 average of 0.25 per cent. There is a concentration in Ireland on increasing the R&D performance in the higher education part of the overall research system. Note that the figures for Higher Education Research & Development (HERD) are not included in this survey. Another reason for Ireland’s low ratio is the relatively small size of the Irish public research sector compared to other countries.
2.2 Types of Research
The type of research being performed in the various Government departments and agencies is also measured in this survey. The OECD Frascati Manual defines the three categories of research as follows:
Basic Research – experimental or theoretical work undertaken primarily to acquire new
knowledge, without any particular application or use in view;
Applied Research – original investigation undertaken in order to acquire new knowledge,
primarily directed towards a specific practical aim or objective; and
Experimental Development - systematic work, drawing on existing knowledge gained
[image:20.595.95.513.469.620.2]from research and practical experience that is directed at producing new materials, products and devices, to installing new processes, systems and services, or to improving substantially those already produced or installed.
Table 5: GOVERD by type of research (2012-2013)
Type of Research 2012 2013
€m. % of total €m. % of total
Applied Research 65.7 67.7% 68.0 69.2%
Basic Research 19.9 20.5% 19.5 19.9%
Experimental Development 11.4 11.8% 10.7 10.9%
Total €97 100% €98.2 100%
Of all allocated funds for research to be undertaken by Irish Government departments and agencies in 2013, 69.2 per cent is in applied research, with expenditure amounting to €68m. Basic research accounts for 19.9 per cent of total funding and stands at €19.5m.
Experimental development accounts for 10.9 per cent of all expenditure at €10.7m.
When compared to the outturn figures for 2012, there is a slight increase in funding for Applied Research in 2013.
20
2.3 Fields of science16
[image:21.595.75.491.176.564.2]The fields of science classifications are defined by the OECD Frascati Manual in agreement with European nations.
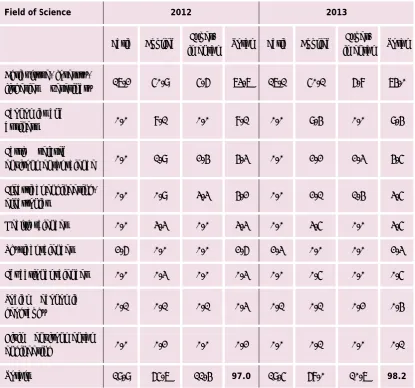
Table 6: GOVERD - Field of science classified by type of research, (2012-13) €m.
Field of Science 2012 2013
Basic Applied Exper-
imental Total Basic Applied
Exper-imental Total
Agriculture, forestry,
fisheries & veterinary 17.2 50.9 5.6 73.7 17.1 50.1 6.8 74.0
Economics and
business 0.0 8.1 0.0 8.1 0.0 9.4 0.0 9.4
Earth & related
environmental science 0.0 1.9 2.4 4.3 0.0 2.2 2.3 4.5
Electrical engineering,
electronics 0.0 0.9 3.3 4.2 0.0 2.1 1.4 3.5
Health sciences 0.0 3.3 0.0 3.3 0.0 3.5 0.0 3.5
Physical sciences 2.6 0.0 0.0 2.6 2.3 0.0 0.0 2.3
Educational sciences 0.0 0.3 0.0 0.3 0.0 0.5 0.0 0.5
Social & economic
geography 0.1 0.1 0.1 0.3 0.1 0.1 0.2 0.4
Civil & environmental
engineering 0.0 0.2 0.0 0.2 0.0 0.1 0.0 0.1
Totals 19.9 65.7 11.4 97.0 19.5 68.0 10.7 98.2
The majority of funds spent on research performed in the public sector is spent on applied research, this amounted to an allocation of €65.7m out of a total spend of €97m in 2012 and €68m out of a total allocation of €98.2m in 2013.
Applied research in agricultural sciences continues to be the field of science in which most expenditure takes place. In 2013, €50.1m was allocated to applied science in this area with €17.1m on basic research and another €6.8m spent on experimental development.
The major performer of R&D in the Government sector is Teagasc which, along with the Department of Agriculture, Food and the Marine are engaged in the field of agricultural sciences. Other agencies working in this field are Bord Iascaigh Mhara, the Inland Fisheries Board and the Marine Institute.
Ch
Go
Pers are Gov deve educ
The of R
The time sect robu
3.1
In a man pers agen time
Figu
17Fu
equa
hapter 3
overnm
sonnel engag examined in vernment dep
elopment wi cation or bu
survey gath R&D staff.
survey also e equivalent tor researche ust benchma
Resear
ddition to re nagerial staff sonnel has d ncies have m e equivalent
ure 8: Total
ull Time Equiv als one resear
3: Hu
ment pe
ged in R&D a n this chapte partments an ithin the Gov siness sector
hers informat
seeks to asc t’ (FTE) term ers and resea arking with c
rch and dev
esearchers, t f connected ropped since maintained th t terms at ap
R&D person
valent (FTE) - rcher in headc
uman re
rforme
activities per er. The data nd agencies vernment se rs.
tion on the o
certain the a
ms17. Gatheri
arch support omparable d
velopment
the R&D pers with the pro e 2006 by alm
he number o pproximately
nnel and Res
A researcher count terms an
FORF
esource
ed resea
rformed in in was collecte and relates
ctor. It doe
overall totals
amount of tim ing informat t staff, speci data from ot
personnel
sonnel numb ogramme. W most 200 fro of researcher y 500.
searchers - h
spending 70 p nd 0.7 researc
FÁS STATE I
es dedi
arch an
nstitutions w ed from surv only to perso
s not include
s, gender, oc
me spent by tion on the ti ifically on R& ther countrie
bers include While the ove om 1297 to 1
rs they empl
headcount t
per cent of the chers in FTE t
INVESTMENT
cated t
nd deve
within the Go ey returns fr onnel workin e R&D person
ccupations a
staff on R&D ime spent by &D work, allo es.
support, adm erall number
105 in 2013, oy both in h
terms (2006
eir time on re erms.
T IN R&D 20
to
elopme
overnment se rom 35 ng in researc
nnel in the h
and qualifica
D activities i y Governmen
ows for mor
ministrative rs of R&D
Governmen eadcount an
6-2013)
esearch activit 012-13
21
nt
ector
ch and higher
tions
n ‘full-nt
e
and
nt nd
22 3.2
A brea catego
Figure
Figure
Figure
State sec
akdown of th ories: Resea
e 9: Total R&
e 10: Total R
e 11: Total R
ctor researc
he occupation rcher, Techn
&D personne
R&D personn
R&D personn
ch staff by
n of research nician and O
el by occupa
nel by occup
nel by occup
occupation
h staff is ava Other R&D pe
ation - headc
pation –
full-In th G
O o
T a ac fu
pation & gen n
ailable under ersonnel. 201
count terms
A breakdow that the p personnel estimates, will be a s in 2013 in research p Governme
The total n personnel expected t
-time equiva
n ‘full-time e here were 93 Government S
Of this total 5 r 54 per cen
echnicians (2 nd other sup ccounted for ull-time equi
nder – (FTEs
The occupat can be brok
Male researc per cent of researchers cent.
There are tw technicians per cent to
r the followi 13 numbers a
s (2012-2013
wn of R&D p redominant are research
it is anticip light increas the overall n personnel em
nt sector.
number of re was 558 in 2 to total 564
alents (FTEs
equivalent’ ( 37 R&D perso Sector in 201
506.7 staff w t.
209) made u pport staff (2 r 24 per cent ivalent numb
), (2013)
tions of FTE en down by
chers (319.8 the total wh (186.8) num
wice the num to female te 7 per cent.
ing three are estimate
3)
personnel sho number of R hers. Based o pated that th
se of 1 per c number of mployed in th
esearch 2012 and are in 2013.
s), (2013)
(FTE) terms onnel in the 13.
were researc
up 22 per cen 221.3)
t of the tota bers.
R&D person gender.
8) make up 3 hile female mber 20 per
mber of male echnicians –
es.
ows R&D on here
ent
he
e
hers
nt
al
nel
4
3.3
The (Inte hold qua
Figu
Figu
Figu
18 IS ht
State s
qualificatio ernational St ders (level 8)
lifications
ure 12: Tota
ure 13: Tota
ure 14: Tota
SCED 2011 – In ttp://www.uis
ector resea
ns of R&D st tandard Clas ), other univ
al R&D perso
al R&D perso
al R&D perso
nternational S s.unesco.org/
arch staff b
taff can also ssification of versity degre
onnel by qua
onnel by qua
onnel by qua
tandard Class Education/Do
FORF
by qualifica
be broken d
f Education)1
ees & other t
alification -
alification –
alification a
sification of Ed ocuments/isce
FÁS STATE I
ation
down accordi
18. There are
tertiary diplo
headcount t
It is als Govern by qual showed personn additio level qu
full-time eq
In ‘full-tim there were Governmen
Again in FT staff with t 226.4 with
nd gender -
The chart s of R&D Per equivalent
Of the tota employed, females (10 19 per cen females.
ducation ed-2011-en.pd
INVESTMENT
ing to ISCED e three cate omas (levels
terms (2012
o possible to ment emplo lification. In d that 29 per nel were PhD
nal 50 per ce ualifications
quivalents (F
me equivalent e 281.4 PhDs
nt Sector in 2
TE terms the third level q other qualif
(FTEs), (20
shows the ge rsonnel (FTEs numbers).
al number of males (178. 02.6) by alm t males to 11
df
T IN R&D 20
2011 levels egories: PhD 5,6,7) and o
2-2013)
o track oyed R&D per
2013,the su r cent of tota D holders an
ent held thir s.
FTEs), (2013
t’ (FTE) term s in the 2013.
ere were 429 qualifications fications.
013)
ender breakd s – full-time
f PhD holder .8) out numb most two to o 1 per cent
012-13
23
–
other
rsonnel urvey
al R&D d an rd
3)
ms
9.2 s and
down
24
3.4 Research and development staff by fields of science
Of the total 506.7 (FTE) researchers employed in the Government Sector in 2013, 318.6 were male and 188.1 were female, and the following table sets out their fields of science.
Table 7: Total male/female and as percentage of total by field of science, FTEs (2013)
Fields of Science Male
Researchers Male researchers as % of all male researchers
Female Researchers
Female researchers as % of all female researchers
Agriculture, forestry and fisheries &
veterinary 153.0 48.0% 83.5 44.4%
Electrical Engineering, electronics 80.3 25.2% 22.2 11.8%
Physical sciences 42.0 13.2% 9.0 4.8%
Economics and Business 30.0 9.4% 32.6 17.3%
Earth & related environmental sciences 4.9 1.5% 3.5 1.9%
Educational sciences 3.0 0.9% 3.6 1.9%
Health sciences 3.0 0.9% 30.0 15.9%
Other social sciences 2.0 0.6% 3.3 1.7%
Environmental Engineering 0.5 0.2% 0.5 0.3%
Total 318.6 100% 188.1 100%
When analysed by the OECD standard fields of science19, the following statistics emerge for
2013. The majority of the Government researchers work in the ‘agricultural, forestry and fisheries’ field. Some 48 per cent of all male researchers and 44.4 per cent of female researchers are engaged in research and development work in this area.
The next largest category for men is ‘electrical engineering & electronics’ with 25.2 per cent of male R&D staff working in this area.
For women the next two areas are ‘economic & business’ with 17.3 per cent and the ‘health sciences’ with 15.9 per cent.
In terms of the numbers of researchers, there are more or as many male researchers in every Field of Science with the exception of ‘health sciences’, ‘economics and business’, ‘other social sciences’ and ‘educational sciences’.
Figu for m num
Figu
ure 15 below male and fem mber of FTEs
ure 15: Rese
w illustrates t male researc in 2013 was
earchers cla
the gender b chers in
506.7.
ssified by ge
FORF
breakdown w -time equiva
ender and m
FÁS STATE I
within the dif alents numbe
major field o
INVESTMENT
fferent majo er (FTE). The
of science (F
Almos resea engag the ‘a scienc
A qua the ‘e techn
Approxi cent of researc ‘agricul
The nex concent researc in the ‘s
T IN R&D 20
or fields of sc e total estim
FTE), (2013)
st half of all rchers (FTE) ged in resear agricultural ces’.
arter are wor engineering a nology’ field.
imately 45 p female (FTE hers are wor ltural science
xt largest tration of fe
hers are em social scienc
012-13
25
cience mated
)
male are rch in
rking in and .
er E)
rking in es’.
26
Appendix 1
Methodology
The information given in this report relates to information supplied by 35 institutions in receipt of monies from the exchequer for the performance or support of research and development.
Expenditure data for specific programmes refer to the 2012 outturn costs of programmes
and to the expected costs in 2013. The outturn costs are mainly funded by matching grant-in-aid or voted monies. Where programmes are funded in other ways these monies are noted separately. In these instances, the expenditure (cost) data shown includes both exchequer and other income contributions.
Expenditures are based on unaudited figures, except in a few cases where they are
identical with a vote by the Oireachtas. For convenience, general overheads, where shown, are distributed in proportion to programme expenditures.
Programmes are attributed to the institution most directly involved - that is to those
actually operating them, but not necessarily funding them. An example of the latter is the Department of Jobs, Innovation and Employment which funds, but does not operate or manage research programmes. Only their own administrative costs are attributed to the funding institutions in such cases.
Apportionment problems arise in the third level sector, mainly from the monies
distributed by the Higher Education Authority (HEA) and the Department of Education and Skills through its recurrent core funding – general university funds (GUF). This core grant is allocated as a block grant to cover core teaching and research activities within
institutions - the internal allocation of funds as between teaching and research are at present a matter for each institution. The allocation of the core grant is determined on a formula basis. The allocation is based on a standard per capita amount in respect of weighted EU student numbers in four subject price groups. Student numbers in the four groups are weighted to reflect the relative cost of the subject groups. A further
FORFÁS STATE INVESTMENT IN R&D 2012-13
27
Appendix 2
Definition of Research & Development
For the purpose of this survey research and development is defined as:
Research:
Original, experimental or theoretical investigations undertaken to acquire new
knowledge, with or without a particular application or use in view.
Development:
Systematic work drawing on existing knowledge gained from research and/or practical
experience that are directed to producing new products, processes, systems, services, varieties and breeds and to improving substantially already existing ones. Data collection conducted solely or primarily as part of the research and development (R&D) process included under “research” or “development” as appropriate.
These definitions are in accordance with the standard practice for surveys on research and
development set out in the ‘Frascati Manual - OECD, 2002’20
28
Appendix 3
Government Departments and Agencies included in the 2012-2013
‘R&D Funding and Performance in the State Sector’ survey
Government Departments Associated Agencies
Department of Agriculture, Food and the Marine
Bord Iascaigh Mhara Marine Institute Teagasc
Department of Arts, Heritage and the
Gaeltacht Údarás na Gaeltachta
Department of Communications, Energy and Natural Resources
Inland Fisheries Ireland
Sustainable Energy Authority of Ireland
Department of Education and Skills
Dublin Institute for Advanced Studies FÁS
Higher Education Authority
Irish Research Council (encompasses the former
Irish Research Council for Humanities and Social Sciences and Irish Research Council for Science, Engineering and Technology)
Department of Jobs, Enterprise & Innovation
Enterprise Ireland Forfás
IDA Ireland
InterTradeIreland
Science Foundation Ireland Shannon Development
Department of the Environment, Community and Local Government
Environmental Protection Agency Met Éireann
Radiological Protection Institute of Ireland
Department of Finance Economic and Social Research Institute
Department of Health Health Research Board
Department of the Taoiseach National Economic and Social Council
Department of Transport, Tourism
and Sport National Roads Authority
Offices
Central Bank and Financial Services Authority of Ireland
FORFÁS STATE INVESTMENT IN R&D 2012-13
29
Appendix 4
Acronyms
BERD Business Expenditure on R&D
CSO Central Statistics Office
DIAS Dublin Institute for Advanced Studies
EPA Environmental Protection Agency
ESRI Economic and Social Research Institute
FÁS Foras Áiseanna Saothair – National Training and Employment Authority
FTE Full Time Equivalent
GBAORD Government Budget Appropriations and Outlays on R&D
GERD Gross Expenditure on R&D
GOVERD Government Expenditure on R&D
HEA Higher Education Authority
HERD Higher Education Expenditure on R&D
HC Head Count
HRB Health Research Board
IRCHSS Irish Research Council for the Humanities and Social Sciences (now Irish Research Council)
IRCSET Irish Research Council for Science, Engineering and Technology (now Irish Research Council)
NESC National Economic and Social Council
NRA National Roads Authority
OPW Office of Public Works
OST Office of Science and Technology - Department of Jobs, Enterprise and Innovation
RPII Radiological Protection Institute of Ireland
SEAI Sustainable Energy Authority of Ireland
30
Appendix 5
Main Government Departments/Agencies R&D programmes
The State currently invests in a wide range of R&D programmes. A summary of the main programmes in 2013 includes:
€212.1 million - The Higher Education Authority’s (HEA) research programme is designed to
enhance the research capabilities, capacity and infrastructure of Ireland’s higher education institutions. These investments have been divided into a portfolio of programmes across disciplines spanning humanities and social sciences, the biosciences and technology and innovation sectors. Research is funded from the core grant which is allocated to institutions and the internal allocation of funds between teaching and research is a matter for each institution.
€159.1 million - Science Foundation Ireland (SFI) was established in 2000 to support
globally competitive scientific research. SFI funds a variety of academic researchers and research teams which aim to promote research excellence in biotechnology, information communication technology (ICT), sustainable energy and energy efficient technologies. The allocation of finance is decided by SFI on the basis of scientific merit. In line with the recommendations of the Report of the Research Prioritisation Steering Group, SFI is committed to supporting scientific research in areas with the greatest potential for economic return.
€107.6 million – Enterprise Ireland (EI) is the national organisation responsible for bringing
together innovation, business development and internationalisation for Irish industry. They aim to facilitate collaborative links between enterprise and the research community that will lead to the practical application of research in business. As such, EI offers a variety of supports and funding to companies that wish to engage in R&D. For example, EI’s R&D Fund is designed to provide support for research, development and technological innovation relevant at all stages of company development, and will enable companies to progress from undertaking an initial research project to high level innovation and R&D activity.
€59.1 million – Teagasc, the Agriculture and Food Development Authority, is the Irish
institute responsible for research in agricultural production, the environment and the rural economy. The annual research portfolio comprises 300 research projects, carried out by 500 scientific and technical staff in research centres throughout Ireland. The four main research areas are: Animal and Grassland - The aim of this programme is to increase the profitability, competitiveness and sustainability of Irish livestock production through research and
innovation. The Crops, Environment and Land Use programme is in place to develop and transfer cost-effective crop production systems, along with evidence-based knowledge to support and underpin the development of an environmentally sustainable, competitive and profitable agri-food sector. With the Rural Economy and Development programme advanced social science investigation tools are utilised to understand the linkages between the various forces affecting the agri-food and rural economy to improve the quality of life in rural Ireland. Finally, the Food Programme undertakes scientific research leading to the
FORFÁS STATE INVESTMENT IN R&D 2012-13
31
€56 million - IDA Ireland has national responsibility for securing new investment from
overseas in manufacturing and international services, and for encouraging the existing foreign enterprises to expand their business. The Research, Development & Innovation (RD&I) Support programme is designed to support companies at all stages of RD&I and enable them to move from start-up R&D, through developing capacity and adding competence, to a fully integrated RD&I function. Support levels are tied to an assessment of strategic objectives, in conjunction with commercial and technical assessments.
€43.5 million - The Health Research Board’s (HRB) is the lead agency in Ireland
supporting and funding health research. It provides research funding and maintains health information systems and commissions research linked to national health priorities. Its
research funding role provides support for projects, programmes and fellowships in health research through an open competition process, along with an element of peer review. Funding covers all areas of health research from biomedical, translational, clinical and practised-based research through to population health and research concerning the health services.
€31.4 million - The Irish Research Council21 manages a suite of inter-linked research
schemes, funding scholars at various career stages from postgraduate study to senior research project based awards. For early stage researchers these include the Government of Ireland Postgraduate Scholarships and Government of Ireland Postdoctoral Fellowships, which fund research at pre- and post-doctoral levels, and the Research Development Initiative Scheme, which allows researchers and research teams to expand their activities into new research areas by way of stimulus project grants and knowledge transfer initiatives. For established academics, the Government of Ireland Research Fellowships and the Government of Ireland Senior Research Fellowships offer research opportunities for members of the academic staff of recognised higher education institutions to undertake stated projects. The Government of Ireland Research Projects Grants Scheme funds world-class, innovative research undertaken on an extended or group project basis. The Council manages and monitors all awards funded under these schemes on a bi-annual basis.
€26.2 million – The Department of Agriculture, Food and the Marine provides a wide
range of services directly and also through specialist state agencies operating under its aegis. The Department operates a number of testing centres and laboratories in the areas of veterinary diagnostics and research, meat control, seed testing, plant variety testing, cattle performance testing, pesticide control, and dairy products control. Research and development expenditure in 2012 was concentrated in the areas of crop improvement, veterinary and meat laboratory R&D activities, food and agricultural production and improvement of livestock genetic resources in plants and animals.
21 In 2012, The Irish Research Council for Science, Engineering and Technology (IRCSET) and The Irish
32
€21.7 million – The Department of Jobs, Enterprise & Innovation has a wide economic
development and job creation remit. Within the Department, the Office of Science, Technology and Innovation (OSTI) is focussed on delivering this goal through the development, promotion and co-ordination of national science, technology and innovation policy, and by progressing the Strategy for Science, Technology and Innovation. In support of these aims, the Department manages Ireland’s membership of the European Space Agency (ESA) (a principal objective of this membership is to promote opportunity for high-technology industry in Ireland) and the European Molecular Biology Laboratory (EMBL) (an Inter-Governmental Research Organisation whose mission is the development of molecular biology throughout Europe). Membership of EMBL complements Ireland's significant investment in the biotechnology area by presenting opportunities for research training, networking and enhanced international collaboration.
€9 million – The Marine Institute’s activities, in relation to marine research, fall into
three main areas. (1) Research Performer: The Marine Institute undertakes research (both
applied and experimental development) through its operational programmes and also through leading and participating in many national and international research projects.
(2) Research Funder: The Marine Institute administers the Marine Research Sub-Programme
of the National Development Plan 2007-2013. (3) Research Promoter, Coordinator and
Catalyst: As the lead implementing agency for Sea Change – A Marine Knowledge, Research
& Innovation Strategy for Ireland 2007-2013, the Institute co-ordinates and promotes marine research, bringing together industry, higher education institutions and government bodies to support the development of Ireland’s knowledge economy and the marine sector.
€8.8 million – The Environmental Protection Agency supports R&D activities in a range of
FORFÁS STATE INVESTMENT IN R&D 2012-13
33
Appendix 6 - Sample Questionnaire
Re
se
ar
ch
&
D
ev
el
op
m
en
t Fu
nd
in
g a
nd P
er
fo
rma
nc
e in
th
e St
at
e Sect
or
2
01
3
Th is S ur ve y pr ov id es de ta ils o f t he a llo ca tio ns a nd o ut tu rn s by g ov er nm en t o n re se ar ch a nd de ve lo pm en t a ct iv iti es. T
34 S. & E . B .M .W Ba si c A pp lie d Ex pe ri m en tal De ve lo pm en t Cu rr en t Cap it al C ur re nt Cap ital Cu rr en t Ca pi ta l Cur re nt Cap it al C ur re n t Ca pi ta l C urre n t Ca pi ta l Cur re nt C ap ita l Cur re nt C ap ita l 1 0% % %% % 2 0% % %% % 3 0% % %% % 4 0% % %% % 5 0% % %% % 6 0% % %% % To ta l 0 0 0 0 0 0 0 0 0 0 0 0 0 0 0 00 00 Def in it io n: Ty pe s of in -h ous e R es ea rc h Act ivi ty Ba si c : E xpe ri m en ta l o r t he or et ic al w or k u nde rt ak en pr im ar ily t o a cqu ir e ne w k no w le dge , w it ho ut a ny p ar ti cu la r a ppl ic at io n o r us e i n vi ew . Ap pl ie d : Or ig in al i nv es ti ga ti on u nd er ta ken i n o rd er t o a cq ui re n ew k no w le dg e, pr im ar ily di re ct ed t ow ar ds a s pec if ic p ra ct ica l a im o r ob je ct iv e. Ex pe ri m enta l De ve lo pm en t
: S
36 Ag en cy N am e: ( se e n ot e b el ow o n T ran sn at io na lly C o-or di nat ed R es ea rc h)
0 0 0 0 0 0 0 0 0 0
00 0 T ran sn at io na lly C o -o rd in at ed R es ea rc h 1
. I
nt er -g ov er nm en ta l o r E ur ope an C om m is si on bo di es t ha t ca rr y o ut R & D a ct iv it y w it h o w n de di ca te d r es ea rc h f ac ili ti es i .e
. CER
N , I LL , EM BL , J RC, ES O , ES RF . 2
. E
ur ope -w id e t ran sn at io na l pu bl ic R& D p rog ra m m es e .g . Eu ro pe an S pa ce A ge nc y, Eu re ka , EM BC e tc . 3
. B
ila te ra l o r m ul ti la ter al p ub lic R & D p ro gr am m es es ta bl is he d b et w een M em ber St at e g ov er nm en ts e .g . H IR LA M Al so i nc lu de o n t hi s l is t a ll f un di ng to 't ra ns na ti on al ly c oo rd in ate d r ese ar ch p ro je cts ' th es e f al l i nt o th re e c ate go ri es : Se ct io n 4
: R
FORFÁS STATE INVESTMENT IN R&D 2012-13
37
Appendix 7: Forfás Board Members
Eoin O’Driscoll (Chairman)
Chairman, Southwestern
Martin Shanahan
Chief Executive, Forfás
Mark Ferguson
Director General, Science Foundation Ireland
John Murphy
Secretary General, Department of Jobs, Enterprise and Innovation
Barry O'Leary
Chief Executive, IDA Ireland
Frank Ryan
Chief Executive Officer, Enterprise Ireland
Michael O’Leary
38
Appendix 8: Recent Forfás publications
Addressing Future Demand for High-Level ICT Skills
Forfás, EGFSN November 2013
Business Expenditure on Research & Development (BERD) 2011/2012
Forfás, CSO August 2013
State Investment in Research & Development 2011 – 2012
Forfás August 2013
Social Enterprise in Ireland: Sectoral Opportunities and Policy Issues
Forfás July 2013
Ireland's Construction Sector: Outlook and Strategic Plan to 2015
Forfás July 2013
Forfás Annual Report 2012
Forfás July 2013
Research Prioritisation: Framework for Monitoring Public Investment in Science, Technology and Innovation and 14 Action Plans
Forfás
July 2013
Monitoring Ireland’s Skills Supply – Trends in Education and Training Outputs 2013
EGFSN
July 2013
National Skills Bulletin 2013
EGFSN July 2013
Annual Business Survey of Economic Impact 2011
Forfás July 2013
Global Entrepreneurship Monitor (GEM) 2012
Global Entrepreneurship Monitor July 2013
Annual Employment Survey 2012
Forfás July 2013
Ireland's Competitiveness Performance 2013
Forfás May 2013
Making it in Ireland: Manufacturing 2020
Forfás April 2013
Future Skills Requirements of the Manufacturing Sector to 2020
FORFÁS STATE INVESTMENT IN R&D 2012-13
39 Sectoral Regulation
Forfás April 2013
EGFSN Statement of Activity
EGFSN March 2013
Costs of Doing Business in Ireland 2012
Forfás March 2013
Vacancy Overview 2012
EGFSN February 2013
Action Plan for Jobs 2013
Forfás, DJEI February 2013
A Review of the Equity Investment Landscape In Ireland
Forfás January 2013
Regional Labour Markets Bulletin 2012
EGFSN January 2013
A Review and Audit of Licences Across Key Sectors of the Irish Economy
Forfás December 2012
Global Entrepreneurship Monitor (GEM) 2011
Global Entrepreneurship Monitor September 2012
Annual Employment Survey 2011
Forfás August 2012
National Skills Bulletin 2012
NCC July 2012
Monitoring Ireland’s Skills Supply – Trends in Education and Training Outputs 2012
EGFSN
July 2012
Ireland’s Competitiveness Scorecard 2012
NCC July 2012
Forfás Annual Report 2011
The publications of Forfás and the advisory
groups to which it provides research
support are available at www.forfas.ie
To sign up for our email alerts contact us at [email protected] or through the website.
November 2013
Forfás
Wilton Park House Wilton Place Dublin 2
Tel: +353 1 607 3000 Fax: +353 1 607 3030