Abstract
— A visual information given by a
digital
image
consumes
enormous
storage
capacity. Moreover, the memory, bandwidth and
computational power required to store, transmit
and processes a typical digital image is very
expensive. Therefore, image compression is
necessary to represent a digital image with the
smallest possible number of bits without suffering
any information loss as well as speeding up the
transmission and minimizing storage requirement.
This project employs Wavelet Transform to
compress still image as this technique currently
provide the most promising approach to
high-quality image compression. Comparison with
JPEG compression were carried out on relevant
aspect of the Human Visual System (HVS) and
image quality assessment measurement such as the
mean square error (MSE) and the peak
signal-to-noise ratio (PSNR) by means of MATLAB®
software. Finally, the findings proposed the
Wavelet compressed image is more natural and
pleasing to the eye. The results suggest that
Wavelet compression offers better image quality
especially when high compression is required.
Keywords: Compression,Wavelet Transform, JPEG, MSE, PSNR
I. INTRODUCTION
oday, the importance of human perceptual properties to visualize information clearly and efficiently must be considered. Image quality assessments can be used to monitor image quality and optimize the compression performance and parameter settings [1]. Digital images are available in uncompressed form, and usually very large in size. The digital image contains a fixed number of rows
Ida Laila Ahmad is with Faculty of Electrical and Electronic Engineering, Universiti Tun Hussein Onn Malaysia, 86400 Batu Pahat, Johor (e-mail: [email protected]).
Nor Azah Mat Sout has completed her degree in Computer Engineering at UTHM is now with Politeknik Kota Melaka, No 2, Jln PPM 10, 75250, Plaza Pandan Malim, Melaka (e-mail: nor_azah@polimelaka .edu.my).
and columns of pixels require more storage space. Image compression is a method of using algorithms to decrease file size. The intention of image compression is to reduce redundancy of the image data in order to be able to store or transmit data efficiently.
There are two types of image compression which are lossy and lossless. A lossy compression achieves its effect at the cost of a loss in image quality, by removing some image information while lossless compression techniques reduce size with preserving all of the original image information and therefore without degrading the quality of the image [2].
Basically, this project deals with image quality assessment concerning on two image compression techniques namely Wavelet and Joint Photographic Experts Group (JPEG). The comparison was limited to still digital images in terms of Human Visual System (HVS), Peak Signal to Noise Ratio (PSNR) and Mean Square Error (MSE) evaluation.
II. METHODOLOGY
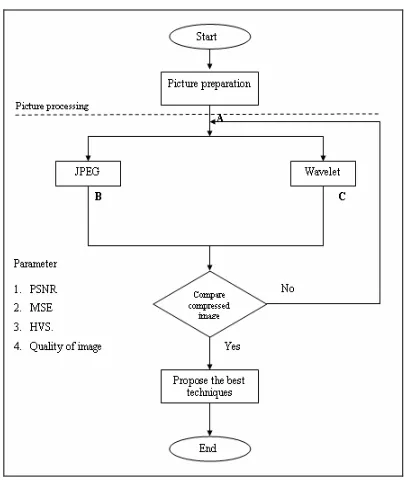
[image:1.612.330.534.475.716.2]The implementation of this project involved several stages which are represented by figure 1 below.
Figure 1: Flowchart of project implementation.
Wavelet Compression Techniques for Digital Image Optimization
Ida Laila Ahmad and Nor Azah Mat Sout
T
Proceedings of MUCEET2009
Malaysian Technical Universities Conference on Engineering and Technology June 20-22, 2009, MS Garden,Kuantan, Pahang, Malaysia
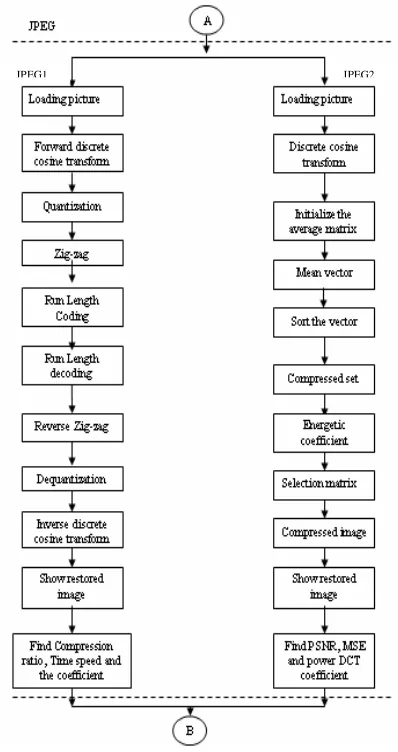
Picture preparation step generates an appropriate digital representation of the information in the medium being compressed for example the picture might be divided into blocks of 8 × 8 pixels with a fixed number of bits per pixel. To attain JPEG format images, there are two algorithms employed namely Forward Discrete Cosine Transform (FDCT) and Discrete Cosine Transform (DCT) as shown in figure 2. The transformation operation is a linear transform that aims to reduce the entropy of the image. This operation is reversible and does not cause any loss of information to the image [3].
Figure 2: JPEG compression algorithm.
After FDCT process, the image is quantized. This step maps a large set of input image data to a smaller set of output image data, attempting to remove redundancies in the image. Later, Zigzag process takes the quantized 8x8 block and orders them in a ‘zigzag’ sequences. This process helps entropy coding by placing low-frequency coefficients (usually larger values) before the high-frequency coefficients (usually close to zero).
After that, the entropy coding operation will be done to compress the image further without the loss of information [4]. In this part, Run Length Encoding (RLE) was adapted which is then transmitted to a Run Length decoder that
executes these transformations in the inverse order to decompress the image. It follows with the reverse zigzag step and dequantization process. Then, the Inverse Discrete Cosine Transform (IDCT) will be used to retrieve the image from its transform representation. This technique gives the results of compression ratio, time speed and the coefficient
Other than that, DCT approach or JPEG1 will manipulate the input image in two dimensions over 8x8 blocks. Then, initialization of the average matrix is carried out and this helps to convert a mean matrix (8x8) into a vector matrix (64x1). The next step facilitates vector sorting process and produced the compressed set of matrix.
This matrix is set to choose only the required number of coefficients and later, the most energetic coefficient from the mean matrix can be obtained. Finally, the image will be restored and the image compressed will be displayed. This technique yield the PSNR, MSE and power DCT coefficient result.
[image:2.612.336.528.406.720.2]Most of Wavelet compression technique utilizes Forward Discrete Wavelet Transform (FDWT) [5] as shown in figure 3. This technique converts an indexed image to a grayscale image. Later, the colormap smoothness must be identified to ensure decomposition can be performed. The next step involved construction and displaying approximations details from the coefficients. Later, multilevel wavelet decomposition is used and finally display the resultant compressed image. By using Wavelet technique, the details of PSNR, MSE, Bit Rate and threshold can be acquired.
Figure 3: Wavelet compression algorithm.
III. SIMULATIONRESULTS
This section analyzed the results of JPEG1, JPEG2 and Wavelet compression techniques. Figure 4(a) show the original image and the lattice of bright dots is formed by the DC coefficients from each of the DCT blocks is shown in figure 4(b) that converts its spatial representation into a frequency range. This is performed as a 2-dimensional operation, as x and y axes represent pixel intensity.
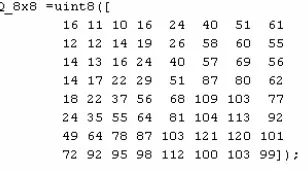
(a) (b) Figure 4: (a) Original image. (b) 8x8 DCT image. After that, each block of DCT coefficients is subjected to quantization process, wherein grayscale and color information are discarded. These values were determined by measuring the thresholds for visibility of the DCT basis functions [6]. In other words, measuring each basis function the amplitude (coefficient value) that is detectable by the human eye. Each DCT coefficient is then divided by its corresponding quantization value and rounded off to the nearest integer value given by figure 5.
Figure 5: Luminance quantization table.
[image:3.612.313.535.47.165.2]Then, it is followed by the zigzag process as given by figure 6 below.
Figure 6: Zigzag sequence.
During entropy procedure, RLE scheme is used. Basically, the number of consecutive zeros that occurred in each block is being recorded before the decoding procedure was done. The decoding steps adapted run length decoding, reverse zigzag, dequantization, and IDCT. The JPEG1 resultant images are shown in figure 7(a) and figure 7(b).
(a) (b)
Figure 7:(a), (b) Reconstructed digital images using JPEG1.
As for JPEG2 technique 64 required bases were plotted first. The zero-padding has been used to increase the resolution. All these base images are shown in figure 8 below
(a) (b)
(c) (d)
Figure 8: (a) The base pictures (3D surface figure). (b) The base pictures (3D surface figure), x 20 resolution. (c) The base pictures (2D mesh figure), x 10 resolution. (d) The base pictures (2D mesh figure), x 10 resolution.
[image:3.612.69.300.158.280.2]The Power of DCT coefficient also can be defined from the DCT image. Figure 9 shows the matrix of DCT power coefficient due to coefficients energy in decibel (dB).
[image:3.612.320.536.260.483.2] [image:3.612.110.264.427.512.2] [image:3.612.333.530.598.712.2]By using the power coefficient details, the reconstruction of image have been implemented. The JPEG2 gives compressed images as shown in figure 10 below. The details of PSNR and MSE are also included.
(a) PSNR = 48.78 (b) PSNR = 65.47 MSE = 0.8611 MSE = 0.0185
Figure 10: (a),(b) Reconstructed digital images by JPEG2.
[image:4.612.337.526.46.224.2]As a comparison, Wavelet technique concerns more on performing multiple decompositions as given by figure 11. Wavelet transformation is powerful because of its multi-resolution decomposition technique [7]. This technique allows wavelets to decorrelate an image and concentrate the energy in a few coefficients.
Figure 11: Approximations and coefficient details.
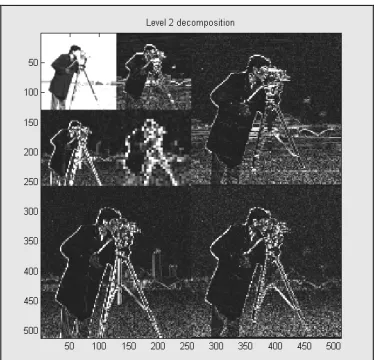
In this technique, the HAAR wavelet with 3-level decomposition was selected. Then, then original image from the multilevel decomposition must be reconstructed. This reconstruction of the original image can be found from the coefficients C of the multilevel decomposition. The reconstruction of the image starts from the innermost band. Figure 12 (a),(b),(c) shows the image output after several level of decomposition steps.
Figure 12(a): 1-level decomposition.
Figure 12(b): 2-level decomposition.
Figure 12(c): 3-level decomposition.
[image:4.612.70.300.107.242.2] [image:4.612.338.525.257.437.2] [image:4.612.90.290.356.582.2] [image:4.612.335.527.467.649.2]Figure 13: Comparison between original image with the Wavelet HAAR reconstructed image.
(a) Original image (b) PSNR = 58.43 MSE = 0.0034
(c) PSNR = 41.47 (d) PSNR = 36.76 MSE = 4.6312 MSE = 13.7142
(e) PSNR = 34.11 (f) PSNR = 33.45 MSE = 25.2184 MSE = 29.1339
Figure 14 (a)-(e): Comparison of PSNR and MSE values based on coefficients for HAAR Wavelet Compression algorithm.
[image:5.612.77.289.45.175.2]In addition to it, all the data obtained from simulations were tabulated given by table 1 and table 2. Furthermore, the relationships among them have been addressed and analyzed.
Table 1: Comparison result for JPEG technique
Comparison Value 25.6 36.33 39.64 48.78 59.54 65.47 179.094 15.1384
7.0645 0.8611 0.0723 0.0185 0 10 20 30 40 50 60 70
1 10 15 30 45 50
No. of coefficient
[image:5.612.311.545.54.306.2]P a ra m e te rs (M S E ) 0 20 40 60 80 100 120 140 160 180 200 P a ra m e te r( P S N R ) PSNR (dB) MSE
[image:5.612.101.279.217.644.2]Figure 15: Comparison of PSNR (dB) and MSE values due to threshold for JPEG technique.
Table 2: Comparison result for Wavelet technique
Comparison Value 0.4371 0.478 0.6907 1.2482 1.6475 4.4041 25.2184 13.7142 4.6312 2.4491 29.3565 0.0934 58.43 33.45 34.11 36.76 41.47 44.24 0 5 10 15 20 25 30 35
1.5 10 15 30 45 50
Threshold P a ra m e te rs (M S E ) 0 10 20 30 40 50 60 70 P a ra m e te rs (B it r a te & P S N R ) MSE Bit rate PSNR
Figure 16: Comparison of PSNR (dB), MSE and bit rate values due to threshold for Wavelet technique.
Based on table 1 and figure 15, it clearly shows that the higher number of coefficient, the higher PSNR value can be obtained. PSNR is inversely proportionally to MSE thus the higher the PSNR, the better the image quality will be, and vice versa. Moreover, the perceptual image quality or HVS suggest the higher number of coefficient; the better image quality can be achieved. Hence, JPEG technique which
HVS
[image:5.612.313.539.361.603.2]employs DCT gives a fair result in terms of image optimization. Evaluation for the JPEG techniques shown the image that have been compressed consist of straight edges formed by square block called blockiness [8],[9]. The blockiness is usually the most annoying artifact in image quality usually caused by unwanted distortions which affecting the resultant images.
From table 2 and figure 16, selection of lower threshold value had caused PSNR and bit rate values lower, since they are directly proportional. On the other hand, the MSE value shows the opposite effect because PSNR is inversely proportional to the error made in the approximation caused by MSE [10]. Nevertheless, Wavelet technique does not produce any significant degradation or image distortion. Therefore, this technique is seen to be the better option in implementing image compression.
IV. CONCLUSION
This project evaluated two image compression techniques which are Wavelet and JPEG. Both of the techniques belong to lossy type of compression. The quality of a lossy compressed image depends on number of factors for instance; JPEG depending on DCT coefficients while Wavelet depends on threshold values [11]. Wavelet compressed image is more natural and pleasing to the eye provided it does not degrade nor producing significant unpleasant effect. It can be conclude that, the evaluation result seems to propose that Wavelet compression offers better image quality especially when high compression is required.
ACKNOWLEDGMENT
The authors would like to thank all members of Medical Electronics Group, for their ideas and contributions and FKEE, UTHM for supporting this work.
REFERENCES
[1] Zhou Wang and Bovik, A.C (2002), “Why is Image Quality Assessment so difficult?” Image Quality, 4. 1-3.
[2] Brown. A (2003). “Digital Preservation Guidance Note: Image compression”. Image Compression. 1. 5-9.
[3] Baxes, G.A, (1994). “ Digital Image Processing.” Principle and application. United State of America : John Wiley & Sons, Inc. [4] Gonzalez. R.C and Woods, R.E.( 1993) “ Digital Image Processing,”
University of Tennessee : Addison-Wesley Publishing Company,Inc. [5] Bethel,D. (1997). “Optimization of Still Image Compression
Techniques.” University of Bath : Thesis Ph.D.
[6] Choo, Li Tan (2001). “Still Image Compression Using Wavelet Transform.” University of Queensland : Thesis Degree.
[7] Mc Andrew, A (2004). “ Introduction to C Digital Image Processing with Matlab,” United State of America : Thomson Course Technology. [8] Hung,Quoc Lai and Steven Tjoa (2004). “Digital Image Processing:
Wavelet-Based Image Compression” University of Maryland : Thesis Degree.
[9] Amhamed Saffor et.al (2001)“A Comparative Study of Image Compression Between Jpeg and Wavelet” Malaysian Journal of Computer Science. 14. 39-45.
[10] Jackson.J.J and Hannah.S.J (1993) “Comparative Analysis of Image Compression Techniques” IEEE Transcations on Image Processing. 28. 513-517.