Foreign Direct Investment in State Owned Enterprises
Kyu-Hee Joo
1,
Hyoung Suk Shim
2,∗,
Wonsik Sul
31InvestmentInformationTeam&ForeignInvestmentPolicyCenter,KoreaTrade-InvestmentPromotionAgency,Seoul,Korea 2SchoolofBusiness,CollegeofStatenIsland,TheCityUniversityofNewYork,10314,NewYork,UnitedStates
3DivisionofBusinessAdministration,SookmyungWomen’sUniversity,Seoul,Korea
Copyright c2017 by authors, all rights reserved. Authors agree that this article remains permanently open access under the terms of the Creative Commons Attribution License 4.0 International License
Abstract
We analyze determinants of foreign direct investment (FDI) in non-competitive industries. We develop a micro-level FDI determination model that allows for nonzero mark-up, and estimate it using the administrative FDI recipient records and annual financial statement data for Korean state owned enterprises (SOE). Using SOEs as our research objects can rule out the endogeneities of mark-up, firm ownership structure and the associated vertical or horizontal incentive FDI. This yields a consistent estimation of the effect of mark-up and other productivity-related factors on FDI. From the empirical analysis, we find that FDI is more likely to flow into firms with large-scale physical capital and output, and a positive mark-up, and the effect is the inverse of the number of workers in the firms, which implies that FDI might not cause productivity spillover effect in non-competitive industries.Keywords
Foreign Direct Investment, State Owned Enterprises, Public Sector Pricing, Productivity Spillover1
Introduction
In this study, we seek an answer to the question: what motivates foreign investors to invest in a specific domestic firm, if firms do not need to improve its productivity for re-alizing positive profit and the associated investment return. We derive a new foreign direct investment (FDI) determi-nation model that allows for nonzero mark-up, and examine the mark-up’s effect on FDI. We then estimate the model us-ing the administrative FDI recipient records of Korean state owned enterprises (SOE). Analyzing SOE’s FDI records al-lows to obtain statistically consistent estimates by ruling out endogenous mark-up and SOE’s ownership structure that are associated with horizon and vertical incentive FDI. The em-prical analysis of FDI in SOEs, moreover, does not require the competitive market assumption, and we can analyze the role of market competitiveness on FDI determination.
This question about FDI’s motivation naturally arises from current FDI studies such as Wang and Wang [30], which
ar-gue with a micro-level data analysis that FDI has no statis-tically significant productivity improvement. They use Chi-nese firm level data for about 125,000 private firms and SOE per year from 2001 to 2007 and performs a firm productivity equation estimation with foreign ownership and FDI. Wang and Wang [30] find no evidence of productivity improvement caused by foreign ownership. This study draws a skeptical conclusion about the productivity improvement as a major channel of realizing positive FDI return, which is made by decreasing production cost at a given market price. The study further shows that the emprical result is consistent over the type of firms whether it is a private firm or a SOE, and the different measures of firm productivity.
The other channel is through mark-up, which is made by increasing market prices given production cost. Sembenelli and Siotis [25] analyzes the channel with micro-level data. They use domestic and foreign firms in Spain from 1983 to 1996 to perform a ’profit-cost margin’ equation estima-tion, where the margin is a proxy measure for mark-up, and find that FDI increases mark-up in the long-run and foreign presence reduces mark-up in the short-run, but this effect of foreign presence shrinks overtime. Sembenelli and Siotis [25]’s analysis implies that, for foreign investors, FDI return through productivity improvement may not be attractive than mark-up. This seems to be true, if the productivity improve-ment is costly, whereas mark-up is just given by the domestic firm’s market power.
model. Eicher et al [14] and Blonigen and Piger [4] develop Bayesian estimation of the gravity model to rule out selection bias and model mis-specification that cause inconsistency of their econometric estimations.
Clearly needed is a micro-level FDI determination model which also relaxes the competitive market assumption and allows firms to have positive excess profit so the foreign in-vestor can earn positive excess investment return. However, positive excess profit for a firm in a non-competitive industry is obviously endogenous, because the firm is no longer a price taker, it is rather a price maker who can influence the market price by adjusting their quantity supplied to obtain maximum positive profit. Econometric model estimations with the com-petitive market assumption, which do not control for this en-dogeneity, may then yield biased and inconsistent result.
The other critical issue for developing the model is own-ership structure. The seminal works in MNE and foreign in-vestment theory by Helpman [15], and Markusen [22] dis-tinguish between horizontal and vertical incentive FDI, argu-ing that the vertical incentive FDI aims to improve the do-mestic firm’s productivity by reducing total production cost, whereas the firm with horizontal incentive FDI is motivated by improving its sales performance. The differing motiva-tions for FDI needs to be ruled out, or at least controlled for micro-level econometric estimations of FDI determination.
We choose SOEs to examine FDI determination at the micro-level, for the purpose of making a fair comparison be-tween the effect of productivity improvement and mark-up profit on FDI. We derive a FDI determination model by uti-lizing the SOE’s regulated pricing, and the ownership struc-ture. The advantage of the FDI determination model is that the associated econometric model can consistently estimate the effect of productivity improvement and mark-up on FDI, for two reasons. First, SOEs have no the vertical incentive FDI and the other corporate governance issues because its ownership and managerial decisions belong to the govern-ment. The only theoretical motivation for FDI remains is to improve the recipient domestic SOE’s productivity. Sec-ond, SOE’s regulated pricing yields predetermined mark-up, a positive excess profit, and the associated investment return. SOEs normally exercise the regulated pricing to protect its industry from monopoly pricing due to SOEs economies of scale, and therefore, the government regulates its pricing at a fixed level.
We begin with analyzing market concentration of Korean industries. The regression analyses for market concentration indices show that industries with SOE and privatized SOE are more likely to be concentrated than other industries with-out SOE. We then perform econometric estimations for the FDI determination model that we derive based on the SOE’s characteristics. We find mark-up, which is given before in-vestment decisions are made, has a strongly significant and positive effect on FDI, and the FDI is more likely to flow into a firm with large production output, physical capital stock and investment, and less likely to flow into labor intensive firms. The empirical findings indicate that foreign investors prefer to invest in domestic firms with large capital, mark-up profit, and a small labor force, and this implies that FDI might
not cause productivity spillover effect in non-competitive in-dustries.
The organization of this paper is as follows: First, we re-view the history of Korean SOE and FDI, and the associated government policies in section 2. Then we review theory of public sector pricing as an element in developing the FDI determination model for SOE in section 3. We derive an empirical model for FDI in SOE at section 4. In section 5 the regression analyses of market concentration indices, and econometric estimations for the FDI determination model are presented.
2
FDI and State Owned Enterprises in
Korea
In this section, we briefly discuss distinguishing features of FDI and SOE in Korea, and examine whether economic analyses of Korean FDI and SOE can be generalized to the other countries’ FDI and SOE. First, we introduce and re-view the history of Korean FDI and the associated govern-ment policies. Then we outline the history of the Korean SOE, how they are categorized by the Korean government, and the associated government policies. Finally, we briefly discuss characteristics of privatized Korean SOE.
2.1
Foreign Direct Investment in KoreaThe Korean economic growth rate from the 1960’s to mid 1990’s is 6.2 percent per year with a relatively low inflation rate and small size of domestic market. The growth rate was driven by rapid expansion of international trade, especially the rapid growth of exports, and has often been referred to as a miracle.1 In the mean time, foreign investment inflow
to the Korean domestic firms grew fast but the trend changed around 1998 at the time of the Asian financial crisis, the Ko-rean economy faced a recession due to the depletion of for-eign currency, which drastically reduced economic growth in the first decade of the 2000s.
After the foreign currency crisis, the Korean government implemented several policies introduced to stimulate foreign investment in domestic firms. The Foreign Investment Pro-motion Act2 defines FDI as foreign investment in corpora-tions of the Republic of Korea to purchase capital stocks or stock shares to participate business activities, and hold per-manent relationship with the corporations. Foreign investors who satisfy those criteria are eligible to apply for the foreign investment benefit package of corporate income tax reduc-tion that consist of five years of complete tax relief, plus 50% reduction after three years of local government tax, access to an exclusive public services. The package also includes use
1For example, Lucas [19] takes Hong Kong, Korea, Singapore and
Tai-wan as an example of rapid economic growth, and refers to Korean economic growth as a miracle to emphasize its distinctive feature.
2The Foreign investment Promotion Act is one of the most notable
10
15
20
25
FDI receives (Log scale)
1960 1970 1980 1990 2000 2010 Year
(a) All Firms
0
10
20
30
FDI receives (Log scale)
1960 1970 1980 1990 2000 2010 Year
Private enterprises Public enterprises
[image:3.595.105.504.85.234.2](b) Private and Public Firms (SOE.png)
Figure 1.Inward FDI into Korean Firms
of government real estate assets without additional payment for greenfield types of investment projects.
By the definition of FDI in the promotion act, the foreign investor can be either the investor’s company itself, or its parent company or the parent company’s shareholders who lend loans to the foreign investment company under a suffi-ciently long-term contract, at least five years. FDI made by purchasing corporate stocks qualifies foreigners whether 1) own common stocks of corporations and companies in Rep. of Korea make up more than 10% of total equity of the com-pany, and exercise voting rights, or 2) own common stocks that is less than 10% of the total equity, but whose partici-pation in business activities can be prove by officially doc-umented contracts. In addition, FDI in Korean corporations falls in four different categories: 1) establishing a new busi-ness, or purchasing stock warrants, 2) purchasing common corporate stocks, 3) long-term loan, and 4) mergers and ac-quisitions.
Figure 1 is time plots for the aggregate inward FDI. The left panel of Figure 1 presents the time trend of the inward FDI in public and private Korean firms. FDI gradually in-creases until 1998, then it plateaus. The volatile trend dur-ing 1960s to the middle of 1970s to foreign investors pre-ferring a one-shot investment during this time period. The relatively stable upward trend after the 70s is then due to the change of the preference to sequential investment because of the steady and fast economic growth. The right panel is sep-arate time plots for FDI private firms and SOE. Note that the vertical line at 1998 indicates a hypothetical breakpoint for foreign currency crisis. FDI dynamics for private firms seems to follow the general tendency of the aggregate FDI series, whereas FDI in SOE, the dashed line, begins in the middle of 1990, then seems to stay constant. Overall, the FDI in SOE’s time trend seems to be identical to the aggregate FDI time trend for both private and public firms.
2.2
State Owned Enterprises in KoreaSOE in Korea have played a crucial role for the rapid eco-nomic growth of the second half of the 21th century. After achieving independence from Japanese colonization in 1945, the Korean government took over most of the Japanese
busi-ness entities and began to operate them. From the 1960s, the government had utilized SOE for its central planning, pro-moting exports with strong industry protection and govern-ment subsidies. In the late 80s, this central planning policy was shifted toward market oriented policies such as opening stock shares in markets, its privatization, and so on. After the foreign currency crisis in 1997, many SOE were gradually privatized as part of recovery and restructuring of the Korean economy.
Recently, the government categorizes SOE based on their size, and evaluate their performance and efficiency. In 2007, the Ministry of Finance enacted the Public Institute Oper-ating Act to distinguish necessary and unnecessary public owned institutes in every year of January, and evaluate the ne-cessity for government funding. In addition, the Ministry of Finance classifies public owned institute into four categories with different criteria and operational goals such as propor-tion of government funding, out of the SOE’s entire revenue in a fiscal year. SOE are divided into “market oriented SOE” and “semi-market oriented SOE”. Market oriented SOE of the total proportion of operating revenue in a year is greater than 85%, the number of employees is greater than 50, and total assets owns are worth more than two trillion won ($ 1.4 billion in USD PPP). The semi market oriented SOE is a SOE that earns annual revenue that consists of more than 50% of operating revenue. In January 2011, there were 14 market oriented SOE that operate in industries such as gas, petroleum oil, local heating, and airports, and 13 semi-market oriented SOE within mining, highway and railway.
2.3
Privatized State Owned Enterprises in KoreaTherefore, president Kim and his administration were able to plan to privatizing 11 parent SOE and their 77 sister compa-nies, and implemented it for 8 parent SOE and their 66 sister companies during that time without facing severe political debate. The privatized SOE are electricity, road and high-way, housing, water resources, telecommunication, tobacco, natural gas, heavy industry, and so on.
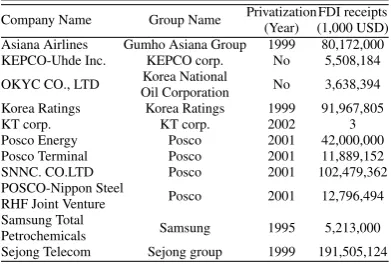
[image:4.595.64.260.310.442.2]Table 1 presents the list of SOE that have received FDI more than once. There are only two SOE, which have never been privatized, and the rest of SOE have received FDI after privatization. The only exception is Asiana Airlines. It re-ceived 172,000 U.S dollars before privation, 0.2% of the total amount, then 80,000,000 U.S dollars received after privatiza-tion. This fact reflects that privatized SOE are preferable to non-privatized SOE, and the reason would be the monopoly profit, which we will discuss later.
Table 1.FDI receipts of Korean State Owned Enterprises
Company Name Group Name Privatization FDI receipts
(Year) (1,000 USD)
Asiana Airlines Gumho Asiana Group 1999 80,172,000
KEPCO-Uhde Inc. KEPCO corp. No 5,508,184
OKYC CO., LTD Korea National No 3,638,394
Oil Corporation
Korea Ratings Korea Ratings 1999 91,967,805
KT corp. KT corp. 2002 3
Posco Energy Posco 2001 42,000,000
Posco Terminal Posco 2001 11,889,152
SNNC. CO.LTD Posco 2001 102,479,362
POSCO-Nippon Steel
Posco 2001 12,796,494
RHF Joint Venture Samsung Total
Samsung 1995 5,213,000
Petrochemicals
Sejong Telecom Sejong group 1999 191,505,124
Notes: FDI receipts is the total (nominal) amount of FDI that have been received from 1960 to 2011, in U.S. dollar. KEPCO-Uhde Inc., and OKYC CO., LTD with the reported privatization year “No” have never been privatized SOE.
3
Theory of State Owned Enterprises:
Literature review
In this section, we review previous literature on the role of SOE in international business and public finance. The main goal here is to develop and support the argument that the SOE’s operating profit and the associated investment re-turn are exogenously given, in order to justify the statistical consistency of our empirical analysis. We thus review public sector pricing theory for the SOE and employ it to develop an econometric model for FDI in the later chapter.
3.1
Role of State Owned EnterprisesVernon [29] proposes the definition and the role of SOE, on the international business perspective that SOE is a tax col-lection agency by producing and selling goods and services to the public, and it is expected to lead an industries produc-tivity growth. Moreover, the SOE play a role in international markets that stimulates international trade by competing with foreign firms and generating a trickle down effect on the other domestic firms in the same industry. Therefore, the interna-tional role of SOE leads domestic firms to becoming more
competitive in international market. The role of SOE, as pro-posed by Vernon [29], seems to be conflicted with the goal for SOE as a public institution. SOE rather plays a role to max-imize social welfare, that is to achieve an efficient allocation of scarce resources to all in its economy, than maximize its own profit, for the reason which we now explain.
In order to be a competitive firm in international market, the SOE requires scarce resources that are then unavailable to private firms. This prioritizing the resource consumption is the main reason that the SOE needs to be treated as a public institution, even we consider its role and performance in in-ternational trade. Bös [5] defines SOE as public enterprises, which produce public utilities such as energy, communica-tion, and transportacommunica-tion, or operate in basic goods industries such as finance, agriculture, health and education. Public en-terprises have generally been regulated in their market activ-ities to sell goods and services, according to Bös [5], in or-der to protect the economy from market failure, and most of the regulations imposing on prices of the public enterprises’ goods and services because the market failure is for SOE to behave as monopolies in their industry.
3.2
Public Sector PricingPublic enterprises operate under a specific pricing strat-egy regulated by the government to protect from monopoly pricing. Bös [5] provides a comprehensive summary of the major three public sector pricing schemes, which are well representing the SOEs’ pricing strategy. The first ismarginal
cost pricing, which is a pricing that charges consumers only
the marginal production cost of public enterprises’ goods and services. The second isRamsey pricingan optimal pricing for a particular industry comprised of both public and private enterprises producing a homogenous good or service, where the price regulation can be imposed only on the good or ser-vice, produced by the public enterprise. Note that Ramsey pricing calculats the price of the public enterprises’ good or service by considering demand for both public and private enterprises’ good or service simultaneously.
not necessarily generate deficits which the government has to subsidize. Because of the positive and stable investment return, in addition, this pricing makes SOE a very attractive investment object, compared with conventional financial in-struments such as stocks, bonds, and currency exchange. So the SOE are able to generate capital investment if the rate of return guarantees an amount which is at least higher than risk-free market return.
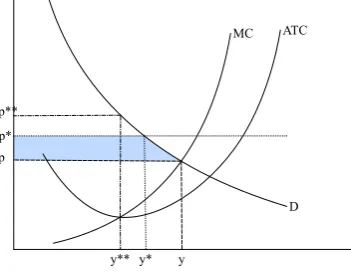
Figure 2 represents public sector pricing graphically. As we reviewed also, public enterprises produce goods and ser-vices asmonopolies so the demand curve, D, has a downward slope. By producingy∗∗, the monopoly firm is able to earn the highest revenue,p∗∗ timesy∗∗. If the government exer-cises marginal cost pricing, there are two possible outcomes. If the regulated price is less thanp, the competitive price, then the firm generates a loss, which has to be subsidized by the government. If the price is greater thanp, on the other hand, the firm makes positive profit, which can be either reinvested, or taxed by the government.
p* p p**
y** y* y
[image:5.595.87.263.330.468.2]D ATC MC
Figure 2.Public Sector Pricing
The main difference between marginal cost pricing and ROI fixed pricing is whether the SOE can adjust its profit and the associated investment return with respect to the changes in factor prices over time. For public enterprises with marginal cost pricing, the amount of profit is determined by marginal cost curve, which represents production tech-nology of firms, even though the government regulates the price. Therefore, the SOE can make more profit by reduc-ing their marginal cost schedule, which is not necessary to improve their productivity. ROI fixed pricing, however, con-siders the demand condition and marginal cost condition si-multaneously so that the firms can keep their profit constant. The shaded region in the figure 2 indicates profit that is given by ROI fixed pricing. This implies also that stable return for investors is guaranteed, given the time variant marginal cost that is uncertain for the investors.
4
FDI on State Owned Enterprises: A
Model
In this section, we derive a model for FDI determination under the specific condition where the investment target firm is a SOE. We design the model based on the assumptions that
i) The ownership of a SOE cannot be changed even though its stocks are traded in the market, ii) the government regulates the SOE’s pricing, so operating profit and the associated in-vestment return are predetermined, and iii) foreign investors face their own uncertainty for the market price due to interest rate and exchange rate parity between the SOE’s home coun-try and host councoun-try changes in government pricing. We then propose an econometric model that is an empirical form of the FDI determination model with micro-level FDI data.
4.1
Theory of Foreign Investment in SOEThe purpose of deriving a new FDI determination model is to estimate the effect of mark-up and productivity factors on FDI at firm level, and compare the effects to see which is more important to bring more FDI to a firm. The most dif-ficult challenge in this empirical analysis is to estimate the effect of mark-up on FDI consistently because a firm is ob-viously able to change its mark-up profit by adjusting quan-tity supplied unless the market is in perfect competition. We choose SOE whose operating profit is regulated by the gov-ernment, and thus, its mark-up is predetermined, or exoge-nously given. In addition, the SOE’s ownership cannot be changed so that we can rule out the role of corporate gover-nance and vertical incentive FDI, where a foreign company or multinational invests in a domestic firm to produce inter-mediate goods for their final output production.
The marginal return for FDI investors in the SOE, under this condition, is given by the price differential between the regulated price and marginal cost of producing a good. But it depends also on exchange and interest rate parities between the host and the investor countries. Since the SOE pays pro-duction cost using domestic currency, the exchange rate par-ity would affect only on the regulated price, so it determines marginal foreign investment return.3 Finally, the change in
the regulated price and exchange rate parity in the future are unobservable to the investor so she treats it as an uncertain factor that she predicts by her own forecasting rule.4 Under
assumption 1), we construct the SOE’s present value profit maximization problem:
max
Kt+1
E
"∞
X
t=0
βt{D(yt, ut)−c(yt)} #
,
s.t. yt = f(Kt, Lt)
It = Kt+1−δKt
where D(yt, ut)is total revenue that is a function of out-putytand uncertain demand shiftut,c(yt)is total cost, and
f(Kt, Lt)is production technology, a function of capital and
labor input. The firm chooses the optimalKt+1, the amount of future capital input that maximizes the present value of its profit.
3Assume that the firm, SOE, produces a single good or a service so that
its marginal cost can account for obtaining profit.
4In the economics and theoretical corporate finance literature, the
Now we consider a new pricep∗in which the foreign
in-vestor recognizes to account for her marginal profit. As we discussedp∗ depends on unobservable government pricing, exchange rate and interest rate parities, so we assume that it is a function of unobservable price changeu∗tand denoted it by a functionp∗(u∗t). Assume also that the production technolo-gies is constant return to scale. Then the foreign investment return maximization problem is the following:
max
kt+1
E
"∞
X
t=0
(β∗)t{p∗(u∗
t)−c(yt)} ·yt
#
,
s.t. yt = f(kt)
It∗ = kt+1−δkt−It
where It∗ is foreign investment and It becomes domestic
investment, kt is the capital-labor ratio, Kt/Lt, β∗ is the
discount rate for the foreign investor that reflects interest rate parity. Note thatp∗(u∗t) andc(yt) can be thought of as average total revenue and average total cost respectively, and sincep∗(ut)does not depend on output, represented by
f(kt), it is equal to marginal revenue. By assumingu∗t is a stochastic process with Martingale property,5the
maximiza-tion problem becomes a standard dynamic stochastic pro-gramming and the solution is the optimal future capital input
kt+1that maximizes a value function:
v(kt, u∗t) = maxkt+1{p∗(ut∗)−c(f(kt))} ·f(kt)
+ β∗R
v(kt+1, u∗t+1)Q(u∗, du∗),
(4.1)
whereQ(u∗, du∗)is a transition density of u∗t, which is a probability distribution function ofu∗over time. Because the investor does not have exact information about the firm’s pro-duction technology, propro-duction cost, and the transition den-sity of uncertain factors on the price, deriving an exact closed form from (4.1) is not relevant. However, we can exploit a simple testable model in which the FDI decision on the firm is determined by variables in the value function (4.1).
4.2
Empirical ModelLetItbe FDI in a SOE. From the value function (4.1),It
can be determined by which the investor chooses to maxi-mize the discounted future profit with respect to capital ac-cumulation,kt+1 = It0+δkt, whereIt0 is investment from the domestic financial market.6 For given capital
depreci-ation rateδand the current capital accumulation, the future period capital accumulation level is determined by the invest-ment decisionIt, so it is the solution of (4.1). SinceItis de-rived under the foreign investor’s maximization problem, and it purchases capital stock, it is relevant to treatItas FDI at
5Martingale property of a stochastic process is that the future realization
of the stochastic process depends only on the current realized value, not the past. This property is a necessary condition to solve discrete dynamic optimization problem under uncertainty because the dynamic system link only two time points. It can be interpreted simply as the efficient market hypothesis, or random walk hypothesis about exchange rate parityu∗t
6Becausek
tis capital-labor ratio, we can think the investmentIt0as a
rate of investment, out of the current level of capital accumulationKt.
t. This leads to suggest a hypothetical linear model for FDI, which is observable as:
It = β0+β1·(AT Rt−1−AT Ct−1) +β2yt
+ β3kt+β4lt+β5·It0+u∗t,
(4.2) whereAT R andAT C are average total revenue and total cost respectively,It0 is investment from the domestic finan-cial market. Because the FDI decision is made by forecast-ing β∗E[ν(kt+1, u∗t)], the expected future profit, a lagged
value of profit measureAT Rt−1−AT Ct−1would be natu-ral for current FDI decision model. The remaining variables are control variables for production technology and the asso-ciated production cost, and the SOE’s capital accumulation and investment status in domestic market.
5
Empirical Analysis
In this section, we introduce the Korean FDI and firm level financial statement data that we use for the empirical analy-sis. We then present market concentration statistics to show industries with SOE are more likely to be concentrated in terms of market share, and the consequences of the SOEs’ privatization. Finally, we present the estimation of (4.2) to demonstrate distinctive factors of SOE and privatized SOE that attract FDI.
5.1
DataFDI data set that we use an administrative record of for-eign investments in Korea, provided by the ministry of trade, industry and energy.7 The records contain information about
domestic recipients, foreign investors, types and amounts of the transactions in U.S. dollar, etc, collected from 1962 to 2011, 28,382 investors were located in 122 countries, and they invested in 23,533 domestic business entities. The to-tal number of records is therefore 47,823. This FDI data has been recorded on daily basis, so we aggregate FDI amount by the domestic business entities and year. Then we merge the data with the Korean firms’ annual financial statement data, provided by National Information & Credit Evaluation’s cor-porate financial statement database (kisvalue).8
Using the financial statement data, we create economic variables such as output, total revenue, total cost, labor in-put, (physical) capital inin-put, and investment according to the standard methodology proposed in National Income and Pro-ductivity Account (NIPA [28]), written by U.S. Bureau of Economic Analysis. According to NIPA [28], a firm’s out-put in a fiscal year can be measured by sales plus changes in inventories, and subtract intermediate goods and services, as gross value added. Revenue can be measured by sales, ex-cludes value added tax, plus interest and dividend receipts,
7The ministry has collected the records of the entire inward monetary
transactions that have been identified as a foreign direct investment since 1964, and published the data at international notification statistics center (INSC). The INSC foreign transaction data excludes equity investment, and the other capital and reinvested earnings.
8The database is available at http://www.kisvalue.com but it is not free to
and the production cost is compensation of employees plus purchases of intermediate good and services, changes in in-ventories, depreciation, and taxes that excludes value added tax. We take fixed asset and number of employees as the mea-sures of physical capital and labor input respectively. Invest-ment is the annual changes in fixed assets, which is the first order lagged difference of fixed asset. Note that all variables are in real terms, adjusted by two-digit industry classifica-tion level GDP deflators. We use Korean Standard Industry Classification (SIC) to match GDP deflators with SOE in our dataset. There are 65 industries in two-digit level SIC so that each industry’s financial figures have been deflated by differ-ent GDP deflators.
5.2
Characteristics of FDI in the Korean CorporatesWe first have a look at whether FDI in Korean SOEs have distinctive characteristics in terms of type, and country of ori-gin.9 The data have a self-reported category of FDI type that
[image:7.595.332.531.365.632.2]consists of i) single incorporation, ii) joint incorporation, iii) right issues as a domestic business entity, and iv) right issues as a foreign business entity. The data also have a self-reported category of FDI purpose that consists of building i) factories, ii) sales establishments, iii) mergers and acquisitions (M&A), and etc. The data have also the FDIs’ country of origin as well.
Table 2.Descriptive Statistics of FDI Receiving by Firm Type
Private corporates State Owned Enterprises
Type Median Std.Dev Total Median Std.Dev Total
Factory 237 14,109 7,071,413 5,000 0.00 5,000
Business 33 8,959 21,865,034 2,902 12,582 170,950
M&A 580 65,765 5,334,220 0.00 0.00 0.00
Etc 111 3,361 18,091 0.00 0.00 0.00
FDI receiving amouts are recorded in thousand U.S. dollar. We convert the FDI receiving amount to the Won, Korean cur-rency, and adjusted its price level change with respect to time using the Korean consumer price index (CPI), then we con-vert it back to U.S. dollar and adjusted its price level change using the U.S. CPI for urban consumers. So, the reported FDI receivings in the table are in real thousand U.S. dollar. Note that those currency conversions and price level adjustments are done by monthly statistics.
These FDI type and country of origin can be indicators that show whether a particular FDI is subject to a MNE’s business operation, and if so, the productivity concerned em-pirical analysis would be biased. Theory of FDI in interna-tional business asserts that foreign investors make investment decisions in purpose of their business operation, rather than expect to make positive investment return from the invested domestic firm’s own business operation. The purpose of FDI for MNEs’ business operation includes: obtaining owner-ships for domestic corporates, locating their production and sales facilities to internalize their business. This is known as the eclectic theory, or the theory of ownership, location, and internalization (OLI), proposed by Dunning [12, 13], and Trevino et al [27]. The OLI framework takes an important
9We thank an anonymous referee for raising the issues that motivated us
to write this section.
role in a firm level FDI analysis because the OLI can ex-plains FDI’s heterogeneous characteristics within country, as well as between country of origins. Obtaining ownership of domestic firms is demanded when the foreign investors make the vertical FDI, whereas the greenfield or horizontal FDI do not necessary to obtain the ownership. In the same way, some FDI aims to localize the investor MNEs’ production facilities only, or sales facilities only, or both.
Since SOEs’ ownership belong to the government and sell-ing the ownership is restricted, however, the ownership con-cerned FDI is merely observed or insignificant in our data and empirical analysis. Table 2 reports descriptive statistics for total FDI receiving by corporate type and FDI purpose. The right panel of the table is for SOEs and M&A purpose FDI are reported as zero, which means there are no M&A purpose FDI in the Korean SOEs, unlike the FDI in private corporates that have about 5 billion U.S. dollar in total, re-ported in the left panel. There is, moreover, only one case of factory building FDI for the SOEs with 5 million U.S. dol-lars in total, reported in the first row of the right panel, and the rest of FDI in SOEs are all for sales or other business establishments.
(a) FDI in Private Corporates
[image:7.595.84.269.427.503.2](b) FDI in State Owned Enterprises
Figure 3.FDI’s Country of Origin
only eight countries have invested in Korean SOEs and they are mostly high income, democratic, and market economy oriented countries such as Germany, France, United States, United Kingdom, Japan, Taiwan, and etc. Moreover, the western European countries have invested about 50 million U.S. dollar each, while U.S. and Japan have invested in the Korean SOEs about 125 thousand and 15 million dollar re-spectively.
From Table 2 and Figure 3, we find that our empirical anal-ysis would not be affected significantly by the OLI factors, institution, and resource based concerns, since we analyze FDI specifically in SOEs. FDI’s country of origin can ex-plain MNEs’ institutional and locational advantage seeking investment, or internalization of their business. FDI in SOEs, however, have little concern about those factors by looking at Figure 2 and the investor countries’ characteristics. The west-ern European countries that have predominantly invested in the Korean SOEs share quite similar characteristics in terms of income, productivitity, and political institutions, even be-fore the European Union (EU) has established.
5.3
SOE and Market CompetitivenessWe then analyze market concentration indices to examine the validity of the critical assumptions for the model (4.2) that a SOE do not operate in perfect competitive environ-ment but instead in a highly concentrated industry. We cal-culate Herfindahl-Hirschman Index (HHI) and the four-firm concentration ratio (CR4) for each Korean industries in SIC
using the Korean financial statement data that covers all pub-lic companies and statutory audit business entities that man-date to report their financial statements. We perform regres-sion analyses of treatment dummy variables for industries with SOE, FDI recipients, and Privatized SOE, on the con-centration indices. The regressions capture average treat-ment effects (ATE) of the industries with SOE, FDI recipi-ents, and Privatized SOE and their interactions further cap-ture differences-in-differences (DID) estimates of the ATE to examine differences in market concentration with respect to type of member firms in an industry.
Pooling the data for all years, we find that the market con-centration in Korean industries is relatively small, and indus-tries with SOE or privatized SOE have significantly higher concentration than the other industries. According to the Horizontal Merger Guidelines by U.S. Department of Jus-tice and the Federal Trade Commission, “HHI below 1,500 are not concentrated, HHI between 1,500 and 2,500 are mod-erately concentrated, and HHI above 2,500 are highly con-centrated market.” We apply this rule to show the extent of market concentration. The last row in Table 3 reports aver-age concentration indices if the industry has neither SOE nor FDI recipient firms. The overall average HHI in column 1 is 944 significantly lower than 1,500. The average HHI of SOE and privatized SOE, columns 1 and 4 respectively, are signif-icantly positive, and this pattern is observed consistently in CR4.
The interaction effect of FDI with SOE and privatized SOE are negative, implying that industries with SOE or privatized SOE that have ever received FDI are more likely to be less
concentrated than the other industries. In other words, the in-dustries with SOE or privatized SOE that have ever received FDI are more likely to be competitive. The third and and the fifth rows in Table 3 report the interaction effects for SOE with FDI and privatized SOE with FDI respectively. Those effects are negatively significant on both HHI and CR4,
re-ported in the first and fifth column respectively. Note that the interaction effects are DID estimates for each treatment group.
(a) 2-digit SIC
(b) 3-digit SIC
(c) 4-digit SIC
[image:8.595.333.500.204.757.2](d) 5-digit SIC
Table 3.Average Treatment Effect Estimates for Market Concentration
Herfindahl-Hirschman Index The four-firm Concentration Ratio (CR4)
All year 1980-1989 1990-1999 2000-2011 All year 1980-1989 1990-1999 2000-2011
[image:9.595.334.525.424.562.2]SOE 662.54*** 1357.40*** 817.81*** -163.39 8.87*** 17.22*** 12.18*** -1.84
[117.9] [204.9] [220.5] [181.1] [1.3] [2.3] [2.4] [1.7]
FDI recipients -334.25*** 1116.83*** -111.55 -1116.78*** 4.91*** 22.46*** 12.87*** -8.16***
[52.4] [132.2] [93.8] [68.5] [0.6] [1.6] [1.0] [0.7]
SOE with FDI -402.61** -242.67 -470.59 142.46 -4.75** -1.38 -0.74 -1.82
(Interaction) [190.3] [494.1] [315.7] [266.7] [2.0] [5.0] [3.2] [2.4]
Privatized SOE 526.55 377.79 1131.37*** 0.57 17.64*** 7.47**
[324.9] [247.3] [348.9] [2.9] [2.7] [3.0]
Privatized SOE with FDI -2100.08*** -926.79 -2057.55*** -14.81*** -16.92*** -8.12*
(Interaction) [433.2] [920.8] [471.7] [4.1] [5.1] [4.3]
Constant 944.45*** 780.33*** 3698.15*** 4531.22*** 10.69*** 8.70*** 50.87*** 78.15***
[101.6] [100.3] [149.2] [127.8] [1.2] [1.2] [1.7] [1.3]
Year Fixed yes yes yes yes yes yes yes yes
(Dummies)
R-squared 0.041 0.072 0.003 0.027 0.178 0.125 0.044 0.095
# of obs 26964 7490 7490 11984 26964 7490 7490 11984
Notes: Standard errors are reported in parentheses and Heteroskedasticity Robust Standard Errors are reported in square brackets. The symbols, *, **, and *** indicate respectively that the estimated coefficient is statistically significant under 10%, 5%, and 1% significance levels.
The negative interaction effects, reported in 3rd and 5th
rows, can be interpreted as which industries with SOE and privatized SOE become competitive or the SOE exercises monopoly pricing where lowering quantity supplied to the point that maximizes its profit, if they have ever received FDI. Both cases can have smaller market share and there-fore, the concentration indices are smaller than those for the other industries but it is not clear in what way FDI plays a role on the effect of market concentration and competitive-ness. FDI’s own effects are significantly negative on HHI but those are positive on CR4in the second row of the first and
fifth columns in Table 3.
The average market concentration indices have been changed drastically when we disaggregate the data by de-code. The second, third, and fourth columns are the estimates for 80s, 90s, and 2000s respectively, and those show that the HHI has made stiff increase over the decades. This pattern is consistent with CR4in the sixth, seventh, and eighth columns
in Table 3. This market concentration trend is consistent with Korean economic growth dynamics with extremely fast rates in the 80s and early 90s, then a steep decline during the harsh recession in 1997 and the accompanying bankrupt-cies.10 Draconian financial reform policies were then
imple-mented afterward. About 4,000 HHI and 70% CR4in Table 3
are almost suspiciously high but those can be understood as a reflection of the Korean economic dynamics, or those might be amplified because we use the most detailed industry clas-sification.
SOEs’ market share and its ranking are greater than the other companies regardless of time and industry classifica-tions. Figure 4 presents time plots for median industry mar-ket shares by firm type and different industry classification. Note that two, three, four, and five-digit SIC have 76, 228,
10Lim and Halm [18] provide that in Korea, 14 out of 30 largest companies
reported in 1996 went bankrupt until 1999. See Lim and Halm [18] for more detail statistics.
487, and 1,145 industries respectively in the 2007 Korean SIC. As shown in Figure 4, more detail SIC have lower me-dian industry market share but SOE and SOE with FDI tend to have greater market shares than the other firms and indus-tries in any time.
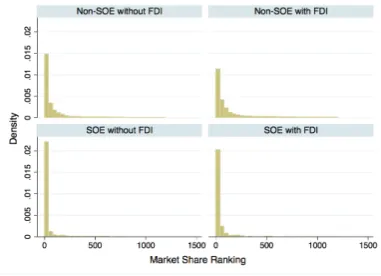
Figure 5.Market Share Ranking within Industry
Moreover, the SOE and SOE with FDI tend to have greater market share rankings within their industries. Figure 5 presents histograms of market share rankings by firm type. The lower two panels in Figure 5 seem to have ranking dis-tributions more left skewed that is closed to the top rank, than the top two panels. This is additional indirect evidence that SOE are likely to operate in concentrated markets and indus-tries.
5.4
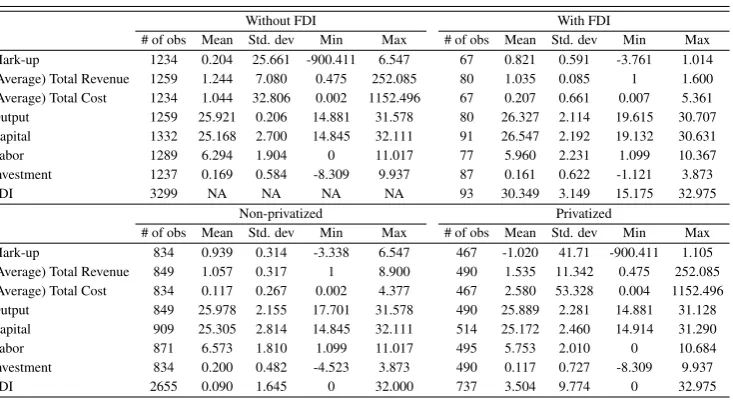
Descriptive Statistics for SOE with FDI recipients and non-recipientsthe right panel is for SOE that have received FDI at least once, over the sample periods, from 1980 to 2011. As we can see the mark-up at the first row, SOE with FDI have higher means and significantly lower standard deviations than SOE without FDI. This implies that FDI flows into the SOE with higher and stable returns, and may result from significantly lower average total cost of the SOE with FDI. By looking at the standard deviation of the average total cost for SOE without FDI, however, we cannot conclude, in a naïve way, that SOE with FDI have better quality production technol-ogy. The production technology then enable them to produce goods and services with lower production costs, and even-tually they earn higher profit than SOE without FDI, under the same revenue stream. The volatile average total cost of SOE without FDI makes difficult to conclude that the higher mark-up of SOE with FDI comes from less marginal cost at a given price level.
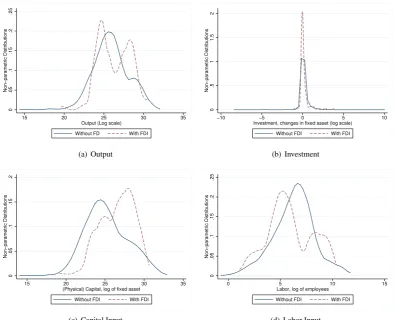
By looking at the differences of the other variables in the table, which are related to production technology such as output and its factor inputs, capital and labor, we can see that the statistics show no variables have significant differ-ence between SOE with and without FDI. These findings are consistent with graphical representations of the distributions of such variables. Figure 6 is the non-parametric distribu-tion estimadistribu-tions for the four producdistribu-tion related variables. As we interpreted in the top panel of Table 3, no variables have distributions that take significantly different places on their intervals.
The lower panel of Table 3 shows descriptive statistics for the variables, categorized by privatization. The left panel is for SOE that are not privatized, or before their privati-zation, and the right panel is for privatized SOE. The pri-vatized SOE have negative mark-up, whereas non-pripri-vatized SOE still earn positive mark-up. This pattern looks the same
as the pattern in the top panel of the table in which higher average total cost of privatized SOE yields negative mark-up, even though the privatized SOE have slightly higher average total revenue. But this is statistically inconclusive because the standard deviation of privatized SOE’s average total cost is incomparably greater than non-privatized SOE’s.
The panel (a) of Figure 7 shows an empirical average total revenue function of Korean SOE, which is horizontal over the associated output level. The solid line through the data points is the LOESS (locally weighted scatterplot smoothing) line, a non-parametric method to fit a simple regression line, which shows the mean relationship between average total revenue and output of Korean SOE, confirming that it is horizontal. This figure provides indirect evidence that SOE operate un-der the particular pricing. The SOE operate obviously in monopoly industries so that their average total revenue curve is downward sloping so that they have downward sloping demand as well, which allows them to exercise monopoly pricing to maximize their profit. There might be an external force, however, to keep the average total revenue curve hor-izontal, and that force is the public pricing in which we can assume Korean government’s pricing impulses on SOE.
[image:10.595.110.477.534.734.2]Unlike the empirical average total revenue curve, the aver-age total cost curve, in panel (b) of Figure 7, seems to take a U-shape, consistent with the theory of firms that average total cost function is a convex function of output so that it yields upward sloping marginal cost. Note that the solid line in the panel (b) is the LOESS non-parametric average cost curve. The two firms’ production decision related plots pro-vide notable epro-vidence support its assumptions of our theo-retical model. The model estimation is thus relevant way to investigate specific preferences of foreign investors in SOE on SOE in a novel way that compared to previous studies of FDI determinants.
Table 4.Descriptive Statistics for SOE with and without FDI
Without FDI With FDI
# of obs Mean Std. dev Min Max # of obs Mean Std. dev Min Max
Mark-up 1234 0.204 25.661 -900.411 6.547 67 0.821 0.591 -3.761 1.014
(Average) Total Revenue 1259 1.244 7.080 0.475 252.085 80 1.035 0.085 1 1.600
(Average) Total Cost 1234 1.044 32.806 0.002 1152.496 67 0.207 0.661 0.007 5.361
Output 1259 25.921 0.206 14.881 31.578 80 26.327 2.114 19.615 30.707
Capital 1332 25.168 2.700 14.845 32.111 91 26.547 2.192 19.132 30.631
Labor 1289 6.294 1.904 0 11.017 77 5.960 2.231 1.099 10.367
Investment 1237 0.169 0.584 -8.309 9.937 87 0.161 0.622 -1.121 3.873
FDI 3299 NA NA NA NA 93 30.349 3.149 15.175 32.975
Non-privatized Privatized
# of obs Mean Std. dev Min Max # of obs Mean Std. dev Min Max
Mark-up 834 0.939 0.314 -3.338 6.547 467 -1.020 41.71 -900.411 1.105
(Average) Total Revenue 849 1.057 0.317 1 8.900 490 1.535 11.342 0.475 252.085
(Average) Total Cost 834 0.117 0.267 0.002 4.377 467 2.580 53.328 0.004 1152.496
Output 849 25.978 2.155 17.701 31.578 490 25.889 2.281 14.881 31.128
Capital 909 25.305 2.814 14.845 32.111 514 25.172 2.460 14.914 31.290
Labor 871 6.573 1.810 1.099 11.017 495 5.753 2.010 0 10.684
Investment 834 0.200 0.482 -4.523 3.873 490 0.117 0.727 -8.309 9.937
FDI 2655 0.090 1.645 0 32.000 737 3.504 9.774 0 32.975
0
.05
.1
.15
.2
.25
Non−parametric Distributions
15 20 25 30 35
Output (Log scale)
Without FD With FDI
(a) Output
0
.5
1
1.5
2
Non−parametric Distributions
−10 −5 0 5 10
Investment, changes in fixed asset (log scale) Without FDI With FDI
(b) Investment
0
.05
.1
.15
.2
Non−parametric Distributions
15 20 25 30 35
(Physical) Capital, log of fixed asset
Without FDI With FDI
(c) Capital Input
0
.05
.1
.15
.2
.25
Non−parametric Distributions
0 5 10 15
Labor, log of employees Without FDI With FDI
[image:11.595.108.503.84.404.2](d) Labor Input
Figure 6.Empirical Distributions of Production Related Variables
−2
0
2
4
6
Average Total Revenue (Log scale)
15 20 25 30 35
Output (Log scale)
(a) Average Total Revenue
−5
0
5
10
Average Total Cost (Log scale)
15 20 25 30 35
Output (Log scale)
(b) Average Total Cost
Figure 7.Empirical SOE’s Production
5.5
EstimationWe aggregate FDI amount in the data by firm and by year to match the variables from the annual corporate income statements. We use each firms’ accumulated FDI to treat it as a stock variable rather than a flow. Thus we have an an-nual panel dataset for Korean SOES with inward FDI records. The model that represents the panel data is given as:
Iit = β0+β1·(AT Rit−1−AT Cit−1) +β2yit
+ β3kit+β4lit+β5·Iit0 +uit,
(5.1)
where uit is an idiosyncratic error term. We can use the model parameters to hypothesize the effect of the explana-tory variables on FDI decisions. For instance, ifβ2 andβ4
are significantly positive whereasβ1is statistically insignifi-cant, it means FDI aim to realize investment return from com-petitive profit by increasing capital inputs and employment. This can be an evidence for FDI spillover effect. On the other hand, ifβ1is significantly positive whileβ2andβ4are
[image:11.595.105.504.443.592.2]to SOE does not play a role in increasing SOEs’s productiv-ity, as has been widely argued in the previous literature on inward FDI. In this case, foreign investors are motivated by capturing sum of the monopoly profit.
In order to estimate the model consistently, we use three different estimation methods, which are ordinary least squares (OLS), panel data model, and censored tobit. Since the model is derived from the theory that we reviewed in the section 4, OLS with time and cross section dummies with consistent estimation despite the presence of uncontrolled cross sectional heterogeneity. Panel data model estimation, called random effect and fixed effect, yields consistent esti-mation when there exists the uncontrolled heterogeneity. The possible source of bias in FDI determination model estima-tion isdata censoringproblem. Because FDI purchases ei-ther physical capital or firms’ stock, it is obvious that the investor is able to sell it . In this case, FDI takes negative values, but the FDI data record only the positive amounts of FDI will the negative amounts are censored.
The data censoring is a well known source of bias in econometrics, and the censored tobit model is known as an econometric method that controls for the bias. To illustrate inconsistent estimation problem in FDI model, here we con-sider a vector representation of the model (5.1) as:
Iit∗ =xitβ+uit, uit|xit∼N(0, σ2), (5.2)
where Iit∗ is latent FDI investment that takes value from negative to positive interval. LetIit be an observable FDI record that takes value only from positive interval so that
Iit =max(0, Iit∗). If we deal with the observable FDI, then the population model that we want to estimate is following:
E[Iit|xit, Iit>0] = xitβ+E[uit|uit>−xitβ]
= xitβ+σ
φ(x
itβ/σ)
Φ (xitβ/σ)
,
whereφ(·)andΦ(·)are normal probability distribution and cumulative distribution functions respectively. The far right term is the inverse mills ratio and it plays a role as an omit-ted variable so any estimators without controlling the inverse mills ratio yields inconsistency if the data is left censored and any independent variables are correlated with the inverse mills ratio.
5.6
ResultTable 5 reports the FDI model estimates using the three different methods. The last two columns report censored to-bit regression results, and the last row of the two columns show that inverse mills ratio is highly significant. This im-plies the OLS and panel estimates are biased due to the left censored dependent variable. As we can see in the first row, mark ups, defined by subtracting average total cost from av-erage total revenue, are negative in both OLS and Panel data model while the censored tobit estimate is positive. Neg-ative mark up means that FDI leads SOE to sacrifice their monopoly profit to produce more and it is the case where so-cial welfare is improved by FDI.
Censored tobit estimates show that, however, the positive role of FDI is exaggerated by data censoring bias. In the second and fourth rows, output and labor input, we can see the same pattern of difference between censored tobit and the other estimations. In OLS and panel data model, output and labor input are positive but statistically insignificant for all model specifications, which means the firms try to real-ize monopoly profit by reducing output and labor input when they receive FDI, and positive mark-up decreases FDI but it is statistically insignificant. The OLS and panel data model estimates can be interpreted that foreign investors, who are willing to invest in SOE, prefer the SOE with positive profit. The output and capital input are positive in the fifth and sixth column, which come up with positive and significant coefficients of mark-up, whereas coefficients of labor input are negative in both estimates. The only difference between two model, estimated by censored tobit, is whether it con-trols for industry or group company by dummy variables. Be-cause data matrix becomes singular once the both firms and group dummies are considered at the same time, we could not try to estimate the model with both group and industry dummies to obtain group and industry fixed effect estimation. Thus, interpreting only the coefficients that have same sign in both censored tobit model is relevant. Even though we can only interpret mark up and privatization that have same signs, however, the consequences that FDI flows into SOE to earn monopoly profit as its return does not change because those two censored tobit estimations are consistent with each other. Privatized SOE is clearly good chance to exercise monopoly pricing for both domestic and foreign investors.
Overall, the several different estimates of FDI on SOE shows that 1) foreign investors consider the mark-up profit of SOE, caused by the government pricing strategy so that it is stable and less risky, 2) foreign investors also consider pro-duction technology of the SOE but only for capital intensive production technology, not labor intensive, and 3) privatized SOE are highly preferable for foreign investors. These three results give a new perspective on the positive effect of FDI on domestic firms and business that contrasts with the previous literature on FDI effects. Because the foreign investors pre-fer firms with capital intensive production technology (posi-tive coefficient of capital input) a small number of employ-ees (negative coefficient of labor input), and give the highest priority to privatization of SOE (largest coefficient values of privatization). These three results are the strong evidence that the foreign investors make FDI decision on the SOE in which the higher and stable profit is guaranteed, so that increasing firms’ productivity and competing with the other firms that operate in the same industry are not necessary conditions for investment.
Table 5.Model Estimates of Foreign Direct Investment
Fixed Effect OLS Panel Data Model Censored Tobit
(1) (2) Random Effect Fixed Effect (5) (6)
Mark-up -0.0077* -0.0077* -0.0043 -0.0077 1.1253*** 1.1211***
(A year lagged) [0.003] [0.003] [0.004] [0.005] [0.283] [0.286]
Output 0.3310 0.3310 0.3702 0.3310 1.0900*** 1.0741***
[0.187] [0.187] [0.271] [0.283] [0.024] [0.023]
Capital -0.3435* -0.3435* -0.0883 -0.3435 1.637*** 1.6117***
[0.168] [0.168] [0.200] [0.243] [0.023] [0.023]
Labor 1.0943** 1.0943** 0.4724 1.0943 -0.8940*** -0.8646***
[0.410] [0.410] [0.676] [0.961] [0.093] [0.091]
Investment -0.4567 -0.4567 -0.4629 -0.4567 2.711*** 2.7202***
[0.335] [0.335] [0.477] [0.502] [0.495] [0.509] Privatization 2.2082*** 2.2082*** 2.1602* 2.2082* 14.714*** 14.7164***
[0.548] [0.548] [1.067] [1.086] [0.574] [0.572]
Year Fixed yes yes yes yes yes yes
(Dummies)
Industry Fixed yes yes no no no yes
(Dummies)
Firm Fixed no yes no no yes yes
(Dummies)
Group Company Fixed no yes yes no yes no
(Dummies)
Constant -5.3671 -6.5245 -8.5709 -5.4865 -111.2257*** -113.1220*** [4.636] [4.591] [6.383] [7.995] [0.628] [0.626]
Inverse Mill’s ratio 7.0285*** 7.0282***
[0.078] [0.072]
R2 0.8092 0.8092 0.4609 0.0041 {0.5678} {0.5678}
Number of Observations 1176 1176 1176 1176 1176 1176
Notes: Standard errors are reported in parentheses and Heteroskedasticity Robust Standard Errors are reported in square brackets. The symbols,∗,∗∗, and∗∗∗indicate respectively that the estimated coefficient is statistically sig-nificant under 10%, 5%, and 1% significance levels. Because Maximum Likelihood Estimation does not provide sum of squared error and sum of squared regression for censored tobit, unlike Ordinary Least Squares, Coefficient of De-terminations, calledR2, plays no longer role as a measure of explanatory power. We calculate thus pseudoR2, that is given byCorr(y,y)ˆ2, whereyˆis fitted value of dependent variable, and reported in curly brackets. Notice that PseudoR2is not a theoretically valid measure.
firm’s capital asset, the more FDI it attracts. It implies also that the industry in which the SOE operates is dominated by economies of scale so the SOE easily turns out to be a natural monopoly. In this situation, the SOE might possess already monopoly power and will exercise monopoly pricing imme-diately after being privatized. It is therefore a relevant guess that the foreign investors have a incentive to reduce output level that increases the privatized SOE’s profit, since the re-duction of output level from competitive level of output is the way of increasing profit by monopoly pricing.
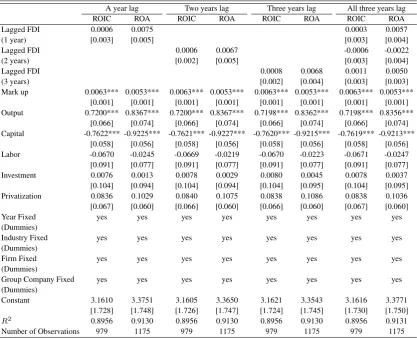
In order to examine the inference that inward FDI on SOE does not affect firms’ productivity and performance, we per-form the model estimations with two different measures of firm performance as dependent variables and the lagged cu-mulative FDI receipts as independent variables. The two measures of firm performance are the return on invested cap-ital (ROIC) and the return on asset (ROA), defined as the pro-portion of sum of net sales plus interest payments and the net sales itself respectively, out of total assets.11 Table 5 report 11Under the notion of the rate of return regulated pricing that prices of
goods and services, produced by SOE, are regulated by government and it keeps the firms’ rate of return, the model specification is irrelevant because the dependent variables, measures of rate of return, are exogenously given.
the estimates with different lagged FDI variables to investi-gate both short-run and long-run effect of FDI on firms’ per-formance. As we can see in the first three rows in all columns, no model estimates and lagged FDIs are statistically signif-icant. The other interesting fact that SOEs with high output levels and lower capital inputs perform better, and the effect of mark-up profit is significant but slightly smaller than the effect of output consistent with the results in table 4.
These findings are consistent with the basic principle of operating SOE and the investment in physical capital. The primary goal of SOEs’ market operation is to produce goods and services sufficiently at a lower price, and supply to their economy as a whole to make it better off. This goal, called socially optimum, can be achieved regardless of the amount of FDI the SOE has received, and the government would be willing to allow earning higher rate of return to the investors. The trade off between the higher rate of return, given by government, and cost to produce more goods and services at a lower price may occur in foreign investors’ decision. If any SOE have fixed the rate of return, foreign investors will search the optimal investment opportunity that yields the
Table 6.Model Estimates of Firm performances
A year lag Two years lag Three years lag All three years lag
ROIC ROA ROIC ROA ROIC ROA ROIC ROA
Lagged FDI 0.0006 0.0075 0.0003 0.0057
(1 year) [0.003] [0.005] [0.003] [0.004]
Lagged FDI 0.0006 0.0067 -0.0006 -0.0022
(2 years) [0.002] [0.005] [0.003] [0.004]
Lagged FDI 0.0008 0.0068 0.0011 0.0050
(3 years) [0.002] [0.004] [0.003] [0.003]
Mark up 0.0063*** 0.0053*** 0.0063*** 0.0053*** 0.0063*** 0.0053*** 0.0063*** 0.0053*** [0.001] [0.001] [0.001] [0.001] [0.001] [0.001] [0.001] [0.001] Output 0.7200*** 0.8367*** 0.7200*** 0.8367*** 0.7198*** 0.8362*** 0.7198*** 0.8356***
[0.066] [0.074] [0.066] [0.074] [0.066] [0.074] [0.066] [0.074] Capital -0.7622*** -0.9225*** -0.7621*** -0.9227*** -0.7620*** -0.9215*** -0.7619*** -0.9213***
[0.058] [0.056] [0.058] [0.056] [0.058] [0.056] [0.058] [0.056]
Labor -0.0670 -0.0245 -0.0669 -0.0219 -0.0670 -0.0223 -0.0671 -0.0247
[0.091] [0.077] [0.091] [0.077] [0.091] [0.077] [0.091] [0.077]
Investment 0.0076 0.0013 0.0078 0.0029 0.0080 0.0045 0.0078 0.0037
[0.104] [0.094] [0.104] [0.094] [0.104] [0.095] [0.104] [0.095]
Privatization 0.0836 0.1029 0.0840 0.1075 0.0838 0.1086 0.0838 0.1036
[0.067] [0.060] [0.066] [0.060] [0.066] [0.060] [0.067] [0.060]
Year Fixed yes yes yes yes yes yes yes yes
(Dummies)
Industry Fixed yes yes yes yes yes yes yes yes
(Dummies)
Firm Fixed yes yes yes yes yes yes yes yes
(Dummies)
Group Company Fixed yes yes yes yes yes yes yes yes
(Dummies)
Constant 3.1610 3.3751 3.1605 3.3650 3.1621 3.3543 3.1616 3.3771
[1.728] [1.748] [1.726] [1.747] [1.724] [1.745] [1.730] [1.750]
R2 0.8956 0.9130 0.8956 0.9130 0.8956 0.9130 0.8956 0.9131
Number of Observations 979 1175 979 1175 979 1175 979 1175
Notes: Standard errors are reported in parentheses and Heteroskedasticity Robust Standard Errors are reported in square brackets. The symbols,∗, ∗∗, and∗∗∗indicate respectively that the estimated coefficient is statistically significant under 10%, 5%, and 1% significance levels.
highest profit, given by subtracting the marginal cost from the fixed rate of return. The very clear fact is that FDI on SOE does not necessarily increase productivity and market performance to earn higher return with respect to the amount of investment.
6
Conclusion
Throughout this study, we examine the potential dark side of the FDI, that foreign investors would only be interested in realizing positive excess return from domestic firm’s mark-up, where positive profit is made by exercising monopoly pricing, and that foreign investors do not have an incentive to improve domestic firms’ productivity. The consequence of this scenario is then no productivity spillover effect can be generated by FDI. From the econometric estimations of the FDI determination model (4.2) using Korean SOE data and FDI recipient records, we find that FDI is more likely to flow into a firm with large-scale physical capital and output, and positive mark-up, and the effect is the inverse of the number of workers in the firm.
As Wang and Wang [30] mentioned in conclusion, many developing countries have implemented FDI stimulus poli-cies that provide tax benefit, government subsidies, and the
other incentives to their foreign investors. The industry and the domestic economy overall might benefits from FDI, and the FDI literature has thoroughly examined this aggregate ef-fect. In order to avoid misguided policy implementation in the developing countries by the FDI literature, the future re-search needs to pay attention to the finding that FDI may have the opposite effect on the domestic industries and economy in a specific situation.
Acknowledgements
We thank Damir Cosic, Gabriel Movesyan, and all other CUNY Graduate Center’s Economics student seminar par-ticipants for their helpful comments. We also thank Seoky-oon Hwang, Kristin Mammen, Warrick Bell, and Gregory Pashayan for his great research assist. This research is also supported, in part, under National Science Foundation Grants CNS-0958379 and CNS-0855217, the City University of New York High Performance Computing Center at the Col-lege of Staten Island. This research was supported in part by the Sookmyung Women’s University Research Grants in 2012.
REFERENCES
[1] Aitken, B.J. and Harrison, A.E., “Do domestic firms benefit from direct foreign investment? Evidence from Venezuela"
American Economic Review, 89(3), 605-618, (1999).
[2] Bergstrand, J. H., and Egger, P. (2007)., “A knowledge-and-physical-capital model of international trade flows, foreign di-rect investment, and multinational enterprises” Journal of In-ternational Economics, 73(2), 278-308.
[3] Blonigen, B. A. (2005). “A review of the empirical litera-ture on FDI determinants”Atlantic Economic Journal’, 33(4), 383-403.
[4] Blonigen, B. A., and Piger, J. (2014). “Determinants of foreign direct investment” Canadian Journal of Economics, 47(3), 775-812.
[5] Bös , D., (1985). “Public sector pricing"Handbook of Public Economics, Ch 3, Vol 1, 129-211.
[6] Caballero, Ricardo J., (1991). “On the Sign of the Investment-Uncertainty Relationship," American Economic Review, 81, 279-288.
[7] Carr, D. L., Markusen, J. R., and Maskus, K. E. (2001). “Esti-mating the knowledge-capital model of the multinational en-terprise”American Economic Review, 91(3), 693-708.
[8] Choe Sang-hun., “South Korean Police Try Again to Evict Workers From Auto Factory" New York Times 6 August 2009.
[9] Choe, S and Wassenerjan, B., “Korean Carmaker Seeks Re-ceivership." New York Times 9 January 2009.
[10] Cho, Y. W, Sul, and Seo, M., (2008). “Foreign investors’ block acquisition, purpose of acquisition and firm value,"Journal of Korea Trade, 12, 67-105.
[11] Dixit, A, and Pindyck, R.S, (1994). Investment under Uncer-tainty. Princeton University Press, Princeton, NJ.
[12] Dunning, J. H. (1973). The determinants of international pro-duction.Oxford economic papers, 25(3), 289-336.
[13] Dunning, J. H. (2001). The eclectic (OLI) paradigm of inter-national production: past, present and future. International journal of the economics of business, 8(2), 173-190.
[14] Eicher, T. S., Helfman, L., and Lenkoski, A. (2012). “Robust FDI determinants: Bayesian model averaging in the presence of selection bias”Journal of Macroeconomics, 34(3), 637-651.
[15] Helpman, E. (1984). “A simple theory of international trade with multinational corporations”Journal of Political Econ-omy, 451-471.
[16] Hayashi, Fumio, (1982). “Tobin’s Marginal q and Average q: A Neoclassical Interpretation,"Econometrica, 50, 213-224.
[17] Khanna, S. (2014). “State-Owned Enterprises in India: Re-structuring and Growth”Copenhagen Journal of Asian Stud-ies, 30(2), 5-28.
[18] Lim, W., and Hahm, J. H. (2004). Financial globalization and Korea’s post-crisis reform: A political economy perspective.
Korea Development Institute.
[19] Lucas Jr, R. E. (1993). Making a miracle. Econometrica: Journal of the Econometric Society, 251-272.
[20] Lucas,R. E., Jr. and Prescott, E, C,. “Investment under Uncer-tainty,"Econometrica, 39, 659-681, (1971).
[21] Meyer, K, E. (2004). “Perspectives on multinational enter-prises in emerging economies"Journal of International Busi-ness Studies, 35, 259-276.
[22] Markusen, J. R. (1984). Multinationals, multi-plant
economies, and the gains from trade.Journal of international economics, 16(3-4), 205-226.
[23] Park, J. and Park, S. (2011). “Privatization of state owned enterprises in Korea: Performance assessment and policy di-rection,”Working Paper Series: Korea Institute of Public Fi-nance,.
[24] Pindyck, R, S., “Irreversible Investment, Capacity Choice, and the Value of the Firm”American Economic Review, 78, 969-985, (1988).
[25] Sembenelli, A., and Siotis, G. (2008). “Foreign Direct Invest-ment and mark-up dynamics: Evidence from Spanish firms”
Journal of International Economics, 76(1), 107-115.
[26] Tobin, J., “A General Equilibrium Approach to Monetary Theory,” Journal of Money, Credit, and Banking, 1, 15-29, (1969).
[27] Trevino, L. J., Thomas, D. E., & Cullen, J. (2008). The three pillars of institutional theory and FDI in Latin America: An institutionalization process. International Business Review, 17(1), 118-133.
[28] U.S. Bureau of Economic Analysis., “An introduction to the national income and product accounts"Methodology pa-pers: U.S. National Income and Product AccountsSeptember, (2007).
[29] Vernon, J., “The international aspect of state- owned enter-prises”Journal of International Business Studies, 10, 7-15, (1979).